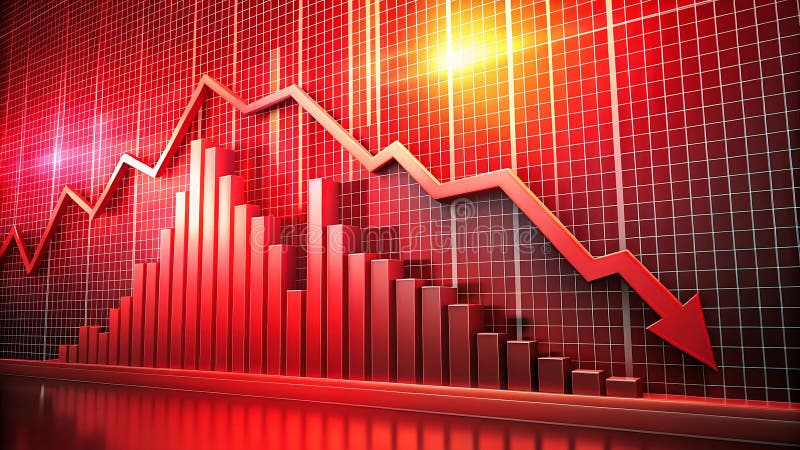
Free with trial Orange bar chart with downward arrow showing decline in industrial production. Manufacturing business downturn with economic crisis concept. Decrease crash illustrations Orange bar chart with downward arrow showing decline in industrial production
Free with trial Falling economy. Vector illustration. The risk economic failure increases during times inflation and deterioration Companies may find themselves on verge bankruptcy due to decreasing profits. Decrease crash vectors Falling economy. Investments become riskier during economic crisis. Falling economy. Vector illustration. The risk economic failure increases during times inflation and deterioration Companies may find themselves on verge bankruptcy due to decreasing profits
Free with trial Red arrows pointing down on a world map with falling stock prices falling crisis bearish trend Can be customized to fit various themes and styles. Decrease crash illustrations Red arrows pointing down on a world map with falling stock prices , falling, crisis, bearish trend. Red arrows pointing down on a world map with falling stock prices falling crisis bearish trend Can be customized to fit various themes and styles
Free with trial The graph of the economy went down, the growth of unemployment. Market trading problems. Women are sitting on the graph and are sad vector illustration. Business is low and arrow fall. Lost money. Decrease crash vectors The graph of the economy went down, the growth of unemployment. Market trading problems. Women are sitting on the graph and are
Free with trial Bankruptcy concept in flat design business. design vector illustration. Decrease crash vectors Bankruptcy concept in flat illustration vector design business. bankruptcy concept in flat design business.design vector illustration
Free with trial Large downward arrow next to coins falling from a cloud, indicating loss, recession, reduced income. Ideal for finance, economics, banking, investment, savings budgeting simple flat metaphor. Decrease crash vectors Downward Trending Arrow with Falling Coins Representing Financial Loss or Economic Decline. Large downward arrow next to coins falling from a cloud, indicating loss, recession, reduced income. Ideal for finance, economics, banking, investment, savings budgeting simple flat metaphor
Free with trial View falling Trends in Market And Economic Downturn, Chart Analysis, Indicators , layered depth. Decrease crash illustrations View falling Trends in Market And Economic Downturn, Chart Analysis, Indicators
Free with trial Bitcoin and virtual money concept. Bitcoin stock growth. Business. Decrease crash illustrations Bitcoin and virtual money concept. Bitcoin stock growth
Free with trial Business portfolio with three arrows pointing down, representing a decrease in value or career prospects. Decrease crash vectors Portfolio under pressure falling business icon showing decreasing career opportunities. Business portfolio with three arrows pointing down, representing a decrease in value or career prospects
Free with trial A simple line drawing of a decreasing chart with an arrow pointing downwards, depicting negative growth or decline. Useful for presentations, infographics, and reports. Decrease crash vectors Minimalist Line Style Decreasing Chart Arrow Down Financial Graphic Element. A simple line drawing of a decreasing chart with an arrow pointing downwards, depicting negative growth or decline. Useful for presentations, infographics, and reports.
Free with trial Bankruptcy concept in flat design business. design vector illustration. Decrease crash vectors Flat vector design bankruptcy concept. bankruptcy concept in flat design business.design vector illustration
Free with trial Losing money from business or bankruptcy, wrong investment or economic crisis, hopeless businessman watching his money flew away, eps10. Decrease crash vectors Losing money from business or bankruptcy, wrong investment or economic crisis, hopeless businessman watching his money flew away
Free with trial This image depicts a financial loss with red arrows and bars on a stock market chart showing a downward trend. The concept conveys the theme of financial decline and loss in the stock market. The arrows and bars symbolize a negative trend in the financial market, indicating a decrease in value of stocks and shares. The image captures the significance of financial loss and the impact it can have on investors and the economy. The meaning behind it highlights the importance of understanding the risks associated with investing in the stock market and the need for informed decisions. This image is ideal for use in financial reports, presentations, and articles related to the stock market and investments. Decrease crash illustrations Financial Loss: Red Arrows and Bars on Stock Market Chart Showing Downward Trend. This image depicts a financial loss with red arrows and bars on a stock market chart showing a downward trend. The concept conveys the theme of financial decline and loss in the stock market. The arrows and bars symbolize a negative trend in the financial market, indicating a decrease in value of stocks and shares. The image captures the significance of financial loss and the impact it can have on investors and the economy. The meaning behind it highlights the importance of understanding the risks associated with investing in the stock market and the need for informed decisions. This image is ideal for use in financial reports, presentations, and articles related to the stock market and investments.
Free with trial A close-up shot depicts a businessman's hands interacting with a holographic projection of a declining bar graph displayed on his laptop screen. The graph illustrates a significant downward trend, suggesting a negative financial performance or market downturn. The scene is set in a modern office environment, highlighted by a blurred potted plant in the background, adding a touch of natural. Decrease crash illustrations Businessman Analyzing Decreasing Stock Market Trend on Laptop, Financial Loss. A close-up shot depicts a businessman's hands interacting with a holographic projection of a declining bar graph displayed on his laptop screen. The graph illustrates a significant downward trend, suggesting a negative financial performance or market downturn. The scene is set in a modern office environment, highlighted by a blurred potted plant in the background, adding a touch of natural
Free with trial Steeply falling graph arrow pointing down dark background sharp decline ruin Ideal for websites and social media. Decrease crash illustrations Steeply falling graph, arrow pointing down, dark background, sharp decline, ruin. Steeply falling graph arrow pointing down dark background sharp decline ruin Ideal for websites and social media
Free with trial Money exchange doodle icon sketch vector. money exchange sign. isolated symbol illustration. Decrease crash illustrations Money exchange icon doodle illustration. money exchange doodle icon sketch vector. money exchange sign. isolated symbol illustration
Free with trial A series of wooden blocks, each marked with a percentage symbol, form a descending staircase. A bold red arrow dramatically points downwards, symbolizing financial decline. Decrease crash illustrations A red arrow graph shows a sharp decline, indicating a significant drop in percentages. A series of wooden blocks, each marked with a percentage symbol, form a descending staircase. A bold red arrow dramatically points downwards, symbolizing financial decline
Free with trial A conceptual vector icon representing a downturn in the housing market. The downward arrow inside the house symbolizes falling prices, property value depreciation, or a real estate crisis. Decrease crash vectors Real Estate Market Decline Vector Icon. A conceptual vector icon representing a downturn in the housing market. The downward arrow inside the house symbolizes falling prices, property value depreciation, or a real estate crisis
Free with trial Steeply falling graph arrow pointing down dark background collapse devastation Perfect for blogs, articles, and online content. Decrease crash illustrations Steeply falling graph, arrow pointing down, dark background, collapse, devastation. Steeply falling graph arrow pointing down dark background collapse devastation Perfect for blogs, articles, and online content
Free with trial Sharp downward sloping line graph red arrow pointing down statistics dip trend Can be used as a banner or header image. Decrease crash illustrations Sharp downward sloping line graph, red arrow pointing down, statistics, dip, trend. Sharp downward sloping line graph red arrow pointing down statistics dip trend Can be used as a banner or header image
Free with trial Bear market stock chart illustration. It features strong, financial decline. It serves to visualize the concept of financial downturn. Decrease crash illustrations Bear market and stock chart illustration symbolizes financial risk and investment trend. Bear market stock chart illustration. It features strong, financial decline. It serves to visualize the concept of financial downturn
Free with trial Falling Chart After Its Peak. The Concept Of Not Succeeding And Falling Stocks. Generative AI. Decrease crash illustrations Falling Chart After Its Peak. The Concept Of Not Succeeding And Falling Stocks. Generative AI
Free with trial Close up of laptop keyboard with bank card and downward red crisis chart grid on blurry concrete wall background. Recession and economic fall concept. Double exposure. Decrease crash illustrations Close up of laptop keyboard with bank card and downward red crisis chart grid on blurry concrete wall background. Recession and
Free with trial Bankruptcy concept in flat design business. design vector illustration. Decrease crash vectors Bankruptcy concept in flat design business
Free with trial Dramatic sunset cityscape reflecting in water with superimposed falling graph, symbolizing economic crisis. Decrease crash illustrations Economic crisis affecting city skyline at sunset with falling graph. Dramatic sunset cityscape reflecting in water with superimposed falling graph, symbolizing economic crisis
Free with trial Dramatic sunset cityscape reflecting in water with superimposed falling graph, symbolizing economic crisis. Decrease crash illustrations Economic crisis affecting city skyline at sunset with falling graph. Dramatic sunset cityscape reflecting in water with superimposed falling graph, symbolizing economic crisis
Free with trial Futuristic cityscape rendered with a glowing red network of lines, representing interconnected data and technology, creating a dynamic and energetic scene. High quality photo. Decrease crash vectors Futuristic cityscape rendered with a glowing red network of lines, representing interconnected data and technology
Free with trial Sad Piggy Bank Icon Representing Financial Loss Economic Crisis and Budget Issues. Decrease crash vectors Sad Piggy Bank Icon Representing Financial Loss Economic Crisis and Budget Issues
Free with trial Global RAM Shortage Crisis Impacting Computer Hardware Market and Semiconductor Supply Chain with Declining Performance Trend. Decrease crash vectors Global RAM Shortage Crisis Impacting Computer Hardware Market and Semiconductor Supply Chain
Free with trial A collection of minimalist outline icons depicting economic recession, financial crisis, and downturn related concepts. Perfect for illustrating articles, presentations, or websites focused on economic issues and market trends. Decrease crash vectors Minimalist Outline Economic Recession And Financial Crisis Icon Set Illustration. A collection of minimalist outline icons depicting economic recession, financial crisis, and downturn related concepts. Perfect for illustrating articles, presentations, or websites focused on economic issues and market trends.
Free with trial Chart decline icon. Market loss symbol. Vector trend design. Black background shape. EPS 10. Decrease crash vectors Chart decline icon. Market loss symbol. Vector trend design. Black background shape.
Free with trial Modern buildings in Moscow with financial graph overlay, showing market decline on blue background, symbolizing economic and investment crisis. Decrease crash illustrations Moscow city skyline with financial stock chart overlay depicting property market downturn and economic crisis impact on real. Modern buildings in Moscow with financial graph overlay, showing market decline on blue background, symbolizing economic and investment crisis
Free with trial With red and orange bars, this financial chart displays a downward trend. 3D rendering. Decrease crash illustrations With red and orange bars, this financial chart displays a downward trend. 3D rendering
Free with trial View Two golden bull figurines face each other, placed on a wooden surface in a trading workspace A stock market chart with green and red lines indicates market fluctuations Vertical Mobile Wallpaper. Decrease crash illustrations Two golden bull figurines face each other on wood, symbolizing market fluctuations. view Two golden bull figurines face each other, placed on a wooden surface in a trading workspace A stock market chart with green and red lines indicates market fluctuations Vertical Mobile Wallpaper
Free with trial A shiny, red, jagged arrow pointing downwards, symbolizing a decline or loss, isolated on a clean white background. Decrease crash illustrations Red jagged downward arrow isolated on white background. A shiny, red, jagged arrow pointing downwards, symbolizing a decline or loss, isolated on a clean white background
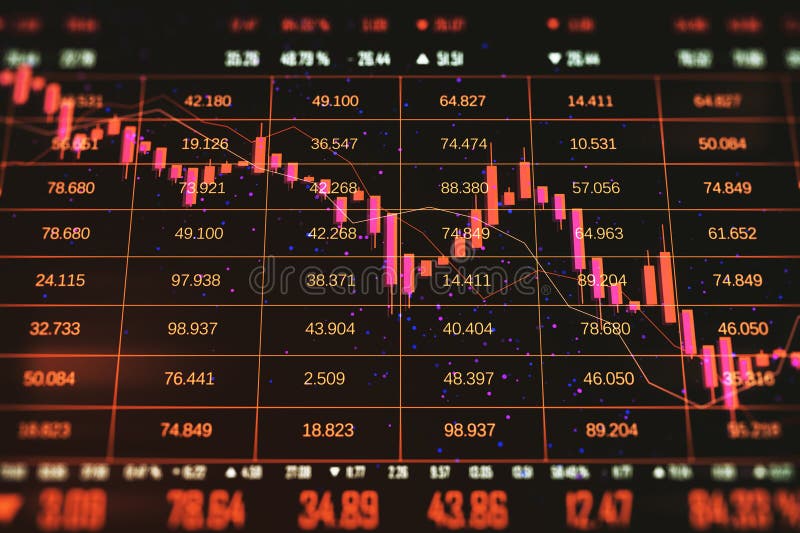
Free with trial A close-up, shallow depth of field shot of a digital stock market ticker board. The screen displays rows of stock symbols and their corresponding prices in bright red and green LED lights against a dark background. Some numbers are in green, indicating gains, while others are in red, signifying losses or negative trends. The bokeh effect from out-of-focus lights adds a dynamic and professional feel, perfect for illustrating financial concepts. Decrease crash illustrations Stock Market Ticker Display with Red and Green Numbers. A close-up, shallow depth of field shot of a digital stock market ticker board. The screen displays rows of stock symbols and their corresponding prices in bright red and green LED lights against a dark background. Some numbers are in green, indicating gains, while others are in red, signifying losses or negative trends. The bokeh effect from out-of-focus lights adds a dynamic and professional feel, perfect for illustrating financial concepts.
Free with trial This image symbolizes the potential negative impact of tariffs on the economy. It features a yellow warning sign that reads "Tariffs" in front of a stock market graph and the US Capitol Building. The sky is dark and stormy. Decrease crash illustrations Tariffs warning sign with stock market crash and US Capitol Building. This image symbolizes the potential negative impact of tariffs on the economy. It features a yellow warning sign that reads "Tariffs" in front of a stock market graph and the US Capitol Building. The sky is dark and stormy
Free with trial Crisis and bearish market concept with perspective view on digital graphic falling red arrow on dark technological background. 3D rendering. Decrease crash illustrations Crisis and bearish market concept with perspective view on digital graphic falling red arrow on dark technological background. 3D
Free with trial Financial chart with red candlesticks showing a downtrend, glowing on a dark background. Represents stock market downturn, financial crisis. 3D Rendering. Decrease crash illustrations Financial chart with falling red candlesticks and data on a dark interface backdrop, representing market decline and economic loss. Financial chart with red candlesticks showing a downtrend, glowing on a dark background. Represents stock market downturn, financial crisis. 3D Rendering
Free with trial Close up of laptop with downward red crisis chart grid on blurry chalkboard wall and coffee cup background. Recession and economic fall concept. 3D Rendering. Decrease crash illustrations Close up of laptop with downward red crisis chart grid on blurry chalkboard wall and coffee cup background. Recession and economic
Free with trial A digital stock market chart showing a downward trend arrow against a blue and black background, illustrating an economic downturn concept. Decrease crash illustrations A digital stock market chart showing a downward trend arrow against a blue and black background, illustrating an economic downturn
Free with trial Falling economy. Vector illustration. A comprehensive approach is needed to address root causes economic decline The falling economy serves as reminder importance prudent financial management. Decrease crash vectors Falling economy. Government intervention becomes necessary to address challenges posed by falling economy. Falling economy. Vector illustration. A comprehensive approach is needed to address root causes economic decline The falling economy serves as reminder importance prudent financial management
Free with trial Bankruptcy concept in flat design business. design vector illustration. Decrease crash vectors Business and finance concept bankruptcy flat vector design. bankruptcy concept in flat design business.design vector illustration
Free with trial Red arrows pointing down on a world map with falling stock prices plunge world recession Can be customized to fit various themes and styles. Decrease crash illustrations Red arrows pointing down on a world map with falling stock prices , plunge, world, recession. Red arrows pointing down on a world map with falling stock prices plunge world recession Can be customized to fit various themes and styles
Free with trial Blue arrow pointing downward on financial graph. Business chart showing descending trend. Digital stock market data visualization for decline analysis. Decrease crash illustrations Blue arrow pointing downward on financial graph. Business chart showing descending trend
Free with trial Stock market crisis or financial failure. Professional entrepreneurs observe and analyze the stock market with its downward graph. Decrease crash vectors Professional entrepreneurs observe and analyze the stock market with a downward graph. Stock market crisis or financial failure. Professional entrepreneurs observe and analyze the stock market with its downward graph
Free with trial Contrasting close-up trading chart, the concept of stock price volatility and stock market instability. High quality photo. Decrease crash illustrations Contrasting close-up trading chart, the concept of stock price volatility and stock market instability
Free with trial Magnifying glass analyzing candlestick chart showing stock market crash, concept of financial crisis, investment and trading. Decrease crash illustrations Magnifying glass analyzing stock market candlestick chart displaying financial crisis. Magnifying glass analyzing candlestick chart showing stock market crash, concept of financial crisis, investment and trading
Free with trial Illustration shows a stock market decline with candlestick charts and downward trending arrow. The design features a light blue background and a simple layout. Useful for financial articles, reports, or any material illustrating loss, recession, or negative trends in commercial sector. Decrease crash illustrations Falling stock market chart showing economic downturn and financial loss. Illustration shows a stock market decline with candlestick charts and downward trending arrow. The design features a light blue background and a simple layout. Useful for financial articles, reports, or any material illustrating loss, recession, or negative trends in commercial sector
Free with trial Businessman walking with a sad feeling. Fall of the economy, reduction of capital. Declining economy. Economic Recession concept. trend modern vector flat illustration. Decrease crash vectors Businessman walking with a sad feeling. Fall of the economy, reduction of capital. Declining economy.
Free with trial Descending data analytics line graphic outline icon in white and black colors. descending data analytics line graphic flat vector icon from business collection for web, mobile apps and ui. Decrease crash vectors Descending data analytics line graphic outline icon in white and black colors. descending data analytics line graphic flat vector
Free with trial Cube with arrow pointing down on wooden surface. Close-up. Decrease crash illustrations Cube with arrow pointing down on wooden surface
Free with trial Stock market bear market. Downward tread chart on the investment. Bear trader wearing eyeglasses sitting at office monitoring stock market. Generative Ai. Decrease crash illustrations Bull trader wearing eyeglasses sitting at office monitoring stock market. Generative Ai. Stock market bear market. Downward tread chart on the investment. Bear trader wearing eyeglasses sitting at office monitoring stock market. Generative Ai
Free with trial A red stock market decline is shown with a bar chart against a dark background. The image conveys a sense of financial crisis and economic downturn, visually representing negative trends. Decrease crash illustrations Red Stock Market Decline Graphic Bar Chart Financial Crisis Concept on Dark Background. A red stock market decline is shown with a bar chart against a dark background. The image conveys a sense of financial crisis and economic downturn, visually representing negative trends
Free with trial US GDP decline with American flag and down arrow. 3D rendering isolated on white background. Decrease crash illustrations US GDP decline with American flag and down arrow. 3D rendering. Isolated on white background
Free with trial This 3D rendered image shows three stacks of gold coins of varying heights arranged from left to right. A thick red arrow, forming a downward trend line, is positioned diagonally from the top left to the bottom right, pointing towards the smallest stack of coins. The background is a solid, soft pink color. Decrease crash illustrations 3D Rendering of Falling Red Arrow Over Stacks of Gold Coins on a Pink Background finance. This 3D rendered image shows three stacks of gold coins of varying heights arranged from left to right. A thick red arrow, forming a downward trend line, is positioned diagonally from the top left to the bottom right, pointing towards the smallest stack of coins. The background is a solid, soft pink color
Free with trial Cyborg robot in front of digital stock market chart with red downward arrows on dark background, concept of financial crisis and automation. 3D Rendering. Decrease crash illustrations Futuristic robot analyzing falling stock market chart on dark background with red indicators and downward trend line representing. Cyborg robot in front of digital stock market chart with red downward arrows on dark background, concept of financial crisis and automation. 3D Rendering
Free with trial Bankruptcy concept in flat design business. design vector illustration. Decrease crash vectors Business bankruptcy concept in flat vector design. bankruptcy concept in flat design business.design vector illustration
Free with trial Money loss and arrow down. Recession Financial Crisis. Investment expenses, economic depression. Decrease crash vectors Money loss and arrow down. Recession Financial Crisis. Investment expenses, economic depression
Free with trial Red stock market investment decline chart. Downward arrow. Negative growth concept, business development, declining profits. Analytical financial chart. Trend. Changes in exchange rates, interest rates. Decrease crash vectors Red stock market investment decline chart. Downward arrow. Negative growth concept, business development, declining profits.
Free with trial A red arrow crashes through a stock market graph displayed on a tablet screen. the scene is set against a dark blue background, symbolizing financial crisis and economic downturn. it represents loss and risk. Decrease crash illustrations Red arrow crashing through stock market graph on tablet screen in a dark blue background. a red arrow crashes through a stock market graph displayed on a tablet screen. the scene is set against a dark blue background, symbolizing financial crisis and economic downturn. it represents loss and risk.
Free with trial Red graph shows plummeting house prices scattered coins economic crisis risk management Vector illustration for high-quality printing. Decrease crash illustrations Red graph shows plummeting house prices; scattered coins , economic crisis, risk management. Red graph shows plummeting house prices scattered coins economic crisis risk management Vector illustration for high-quality printing
Free with trial Generative ai, The image is of a red bar graph and a red line graph. The line graph is going down, and the bar graph is going down. The image is set against a red background. The image is most likely representing a financial decline. It is a striki. Decrease crash illustrations A red bar graph and line graph displays a downward trend, with the bar graph decreasing in height and the line graph going down. generative ai, The image is of a red bar graph and a red line graph. The line graph is going down, and the bar graph is going down. The image is set against a red background. The image is most likely representing a financial decline. It is a striki
Free with trial Financial crisis business market. Currency risk. Red header with arrows and percent signs for global inflation concept. Decrease crash illustrations Arrows and percents signs going up to illustrate global inflation over red background banner. Financial crisis business market. Currency risk. Red header with arrows and percent signs for global inflation concept.
Free with trial Stock market losses. The concept of the global economic crisis is illustrated with a graph of declining financial values. Descending trading graph. Decrease crash vectors Stock market losses. The concept of the global economic crisis is illustrated with a graph of declining financial values.
Free with trial 3D rendering showing falling gold coins and a downward trending graph, symbolizing financial market decline. Decrease crash illustrations Financial Market Decline: Visual Representation of Decreasing Value and Economic Downturn. 3D rendering showing falling gold coins and a downward trending graph, symbolizing financial market decline
Free with trial Financial business concept going bankrupt flat vector design. design vector illustration. Decrease crash vectors Financial concept going bankrupt flat vector design illustration. financial business concept going bankrupt flat vector design.design vector illustration
Free with trial Steeply falling graph arrow pointing down dark background plummeting downward trend risk Ideal for websites and social media. Decrease crash illustrations Steeply falling graph, arrow pointing down, dark background, plummeting, downward trend, risk. Steeply falling graph arrow pointing down dark background plummeting downward trend risk Ideal for websites and social media
Free with trial Red graph shows plummeting house prices scattered coins coin scatter investment strategy Vector illustration. Decrease crash illustrations Red graph shows plummeting house prices; scattered coins , coin scatter, investment strategy. Red graph shows plummeting house prices scattered coins coin scatter investment strategy Vector illustration.
Free with trial A 3D figure holds its head in distress beneath a large red downward arrow, symbolizing loss, decline, or financial troubles. Generative AI. Decrease crash illustrations A 3D figure holds its head in distress beneath a large red downward arrow, symbolizing loss, decline, or financial troubles.
Free with trial This image features a red stock market decline chart with a dark background. It represents a financial crisis concept with a descending bar graph, indicating a negative trend in the market. The use of red highlights the severity of the decline and signals a potential risk in the investment landscape. Decrease crash illustrations Red Stock Market Decline Chart with Dark Background representing Financial Crisis Concept. This image features a red stock market decline chart with a dark background. It represents a financial crisis concept with a descending bar graph, indicating a negative trend in the market. The use of red highlights the severity of the decline and signals a potential risk in the investment landscape
Free with trial A 3d rendering of a green bar graph with a red arrow pointing downwards and gold dollar coins. Decrease crash illustrations 3d rendering of a green bar graph with a downward trending red arrow and gold dollar coins. A 3d rendering of a green bar graph with a red arrow pointing downwards and gold dollar coins
Free with trial A stark visual representation of a downward trend in business metrics and market conditions. Decrease crash illustrations Red arrow graph illustrates sharp decline in financial performance and economic downturn. A stark visual representation of a downward trend in business metrics and market conditions
Free with trial Financial business concept going bankrupt flat vector design. design vector illustration. Decrease crash vectors Financial concept going bankrupt flat vector design illustration. financial business concept going bankrupt flat vector design.design vector illustration
Free with trial Falling economy. Vector illustration. A falling economy is like sinking ship, where banking sector faces turbulent waters The falling economy metaphor illustrates challenges and difficulties. Decrease crash vectors Falling economy. A falling economy is like sinking ship, where banking sector faces turbulent waters. Falling economy. Vector illustration. A falling economy is like sinking ship, where banking sector faces turbulent waters The falling economy metaphor illustrates challenges and difficulties
Free with trial Falling red arrow illustrating financial downturn on dark grid drop business decline fall Suitable for digital platforms. Decrease crash illustrations Falling red arrow illustrating financial downturn on dark grid , drop, business decline, fall. Falling red arrow illustrating financial downturn on dark grid drop business decline fall Suitable for digital platforms
Free with trial This image depicts a stock market decline with a red bar chart against a dark background, illustrating a financial crisis concept. The chart shows a downward trend, indicating negative market performance. Decrease crash illustrations Red Stock Market Decline Chart Displaying Financial Crisis on Dark Background. This image depicts a stock market decline with a red bar chart against a dark background, illustrating a financial crisis concept. The chart shows a downward trend, indicating negative market performance
Free with trial The Red arrow Down on Business background 3d rendering. Decrease crash illustrations The Red arrow Down on Business background 3d rendering