Free with trial Math percentage sign hand drawn. calculation finance, statistics increase, decrease ratio math percentage sign vector sketch. isolated color illustration. Decrease performance vectors Math percentage sign sketch hand drawn vector. math percentage sign hand drawn. calculation finance, statistics increase, decrease ratio math percentage sign vector sketch. isolated color illustration
Free with trial A simple, flat design icon depicting a downward trend. The image features a red graph line descending from the top left to the bottom right, with an arrow indicating the direction. The graph is set against a clean white background, emphasizing the visual impact of the trend. This graphic is suitable for illustrating concepts such as financial decline, decreasing sales, or negative performance in business, economics, or data analysis. Decrease performance vectors Downward Trend Graph Icon. A simple, flat design icon depicting a downward trend. The image features a red graph line descending from the top left to the bottom right, with an arrow indicating the direction. The graph is set against a clean white background, emphasizing the visual impact of the trend. This graphic is suitable for illustrating concepts such as financial decline, decreasing sales, or negative performance in business, economics, or data analysis.
Free with trial 3D illustration of a bar graph showing a declining trend. Red bars of decreasing height are set against a backdrop of a light gray frame. The image is perfect for presentations, reports, or any visual representation of negative growth, decline, or decrease in data. Suitable for use in business, finance, and educational contexts. Decrease performance vectors Declining Trend Bar Graph. 3D illustration of a bar graph showing a declining trend. Red bars of decreasing height are set against a backdrop of a light gray frame. The image is perfect for presentations, reports, or any visual representation of negative growth, decline, or decrease in data. Suitable for use in business, finance, and educational contexts.
Free with trial Math percentage sign hand drawn. calculation finance, statistics increase, decrease ratio math percentage sign vector sketch. isolated black illustration. Decrease performance illustrations Math percentage sign sketch hand drawn vector. math percentage sign hand drawn. calculation finance, statistics increase, decrease ratio math percentage sign vector sketch. isolated black illustration
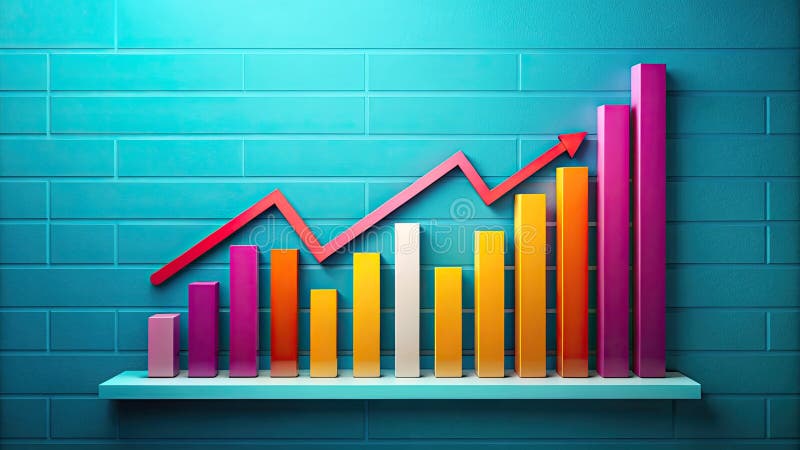
Free with trial Colorful bar charts illustrating positive and negative business trends from january to may provide a clear visual representation of performance. Decrease performance illustrations Colorful bar charts illustrating positive and negative business trends from january to may provide a clear visual
Free with trial Description: This abstract image depicts a financial stock market trading chart with a gold arrow pointing downwards on a blue background. The downtrend of the arrow symbolizes a decrease in stock prices or market performance. The contrasting colors and geometric shapes convey a sense of complexity and volatility in the financial market. This image can be used to represent concepts such as market analysis, investment strategies, and economic trends. Decrease performance illustrations Abstract Financial Stock Market Trading Chart with Gold Arrow Downtrend on Blue Background. Description: This abstract image depicts a financial stock market trading chart with a gold arrow pointing downwards on a blue background. The downtrend of the arrow symbolizes a decrease in stock prices or market performance. The contrasting colors and geometric shapes convey a sense of complexity and volatility in the financial market. This image can be used to represent concepts such as market analysis, investment strategies, and economic trends.
Free with trial Upgrade your vehicle's aesthetic and comfort with premium ceramic car window film. This innovative tint technology significantly reduces solar heat, keeping your interior cool and comfortable during the hottest days. Experience a noticeable decrease in interior temperature, contributing to improved fuel efficiency. Ceramic film's exceptional heat rejection properties are a game-changer for. Decrease performance illustrations Transform Your Ride with Ceramic Car Window Tint Superior Heat Rejection UV Protection and Enhanced Style. Upgrade your vehicle's aesthetic and comfort with premium ceramic car window film. This innovative tint technology significantly reduces solar heat, keeping your interior cool and comfortable during the hottest days. Experience a noticeable decrease in interior temperature, contributing to improved fuel efficiency. Ceramic film's exceptional heat rejection properties are a game-changer for
Free with trial Symbol percentage sign hand drawn. math calculation, finance statistics, increase decrease symbol percentage sign vector sketch. isolated color illustration. Decrease performance illustrations Symbol percentage sign sketch hand drawn vector. symbol percentage sign hand drawn. math calculation, finance statistics, increase decrease symbol percentage sign vector sketch. isolated color illustration
Free with trial Symbol percentage sign hand drawn. math calculation, finance statistics, increase decrease symbol percentage sign vector sketch. isolated black illustration. Decrease performance vectors Symbol percentage sign sketch hand drawn vector. symbol percentage sign hand drawn. math calculation, finance statistics, increase decrease symbol percentage sign vector sketch. isolated black illustration
Free with trial This compelling image depicts a visual representation of the current state of the real estate market. Wooden houses, symbolic of residential properties, are nestled within an empty shopping cart. A red downward-trending chart, overlaid with a soft bokeh effect, graphically illustrates the negative market trend. This visual narrative conveys a significant drop in sales, a decrease in property. Decrease performance illustrations Wooden Homes in Shopping Cart A Visual Representation of the Declining Real Estate Market and Reduced Demand. This compelling image depicts a visual representation of the current state of the real estate market. Wooden houses, symbolic of residential properties, are nestled within an empty shopping cart. A red downward-trending chart, overlaid with a soft bokeh effect, graphically illustrates the negative market trend. This visual narrative conveys a significant drop in sales, a decrease in property
Free with trial Metric management icon with black gear and graph. flat simple trend modern stats logotype graphic design web element isolated on white. concept of key performance indicator or bad operation strategy. Decrease performance vectors Metric management icon with black gear and graph
Free with trial Thin line gear with graph like crisis management. concept of key performance indicator or bad strategy. linear simple trend modern outline stats logotype graphic design web element isolated on white. Decrease performance vectors Thin line gear with graph like crisis management
Free with trial Finance percentage sign hand drawn. statistics increase, decrease ratio, proportion interest finance percentage sign vector sketch. isolated color illustration. Decrease performance illustrations Finance percentage sign sketch hand drawn vector. finance percentage sign hand drawn. statistics increase, decrease ratio, proportion interest finance percentage sign vector sketch. isolated color illustration
Free with trial Finance percentage sign hand drawn. statistics increase, decrease ratio, proportion interest finance percentage sign vector sketch. isolated black illustration. Decrease performance illustrations Finance percentage sign sketch hand drawn vector. finance percentage sign hand drawn. statistics increase, decrease ratio, proportion interest finance percentage sign vector sketch. isolated black illustration
Free with trial Finance percentage sign hand drawn. statistics increase, decrease ratio, proportion interest finance percentage sign vector sketch. isolated color illustration. Decrease performance illustrations Finance percentage sign sketch hand drawn vector. finance percentage sign hand drawn. statistics increase, decrease ratio, proportion interest finance percentage sign vector sketch. isolated color illustration
Free with trial Linear gear with graph like crisis management icon. concept of key performance indicator or bad strategy. flat simple trend modern outline stats logotype graphic design web element isolated on white. Decrease performance vectors Linear gear with graph like crisis management icon
Free with trial This sleek, minimalist linear bar graph is perfect for showcasing downward trends in your business data. Ideal for presentations, reports, and dashboards, this editable graphic allows you to easily customize stroke width and colors to match your brand. The clean design and simple layout make complex data easily digestible, highlighting key performance indicators and areas needing attention. Decrease performance illustrations Editable Linear Bar Graph Visualize Downward Trends for Powerful Business Analytics Reports and Presentations. This sleek, minimalist linear bar graph is perfect for showcasing downward trends in your business data. Ideal for presentations, reports, and dashboards, this editable graphic allows you to easily customize stroke width and colors to match your brand. The clean design and simple layout make complex data easily digestible, highlighting key performance indicators and areas needing attention.
Free with trial Statistics percentage sign hand drawn. increase decrease, ratio proportion, interest profit statistics percentage sign vector sketch. isolated black illustration. Decrease performance vectors Statistics percentage sign sketch hand drawn vector. statistics percentage sign hand drawn. increase decrease, ratio proportion, interest profit statistics percentage sign vector sketch. isolated black illustration
Free with trial Statistics percentage sign hand drawn. increase decrease, ratio proportion, interest profit statistics percentage sign vector sketch. isolated black illustration. Decrease performance illustrations Statistics percentage sign sketch hand drawn vector. statistics percentage sign hand drawn. increase decrease, ratio proportion, interest profit statistics percentage sign vector sketch. isolated black illustration
Free with trial Statistics percentage sign hand drawn. increase decrease, ratio proportion, interest profit statistics percentage sign vector sketch. isolated color illustration. Decrease performance vectors Statistics percentage sign sketch hand drawn vector. statistics percentage sign hand drawn. increase decrease, ratio proportion, interest profit statistics percentage sign vector sketch. isolated color illustration
Free with trial Statistics percentage sign hand drawn. increase decrease, ratio proportion, interest profit statistics percentage sign vector sketch. isolated black illustration. Decrease performance illustrations Statistics percentage sign sketch hand drawn vector. statistics percentage sign hand drawn. increase decrease, ratio proportion, interest profit statistics percentage sign vector sketch. isolated black illustration
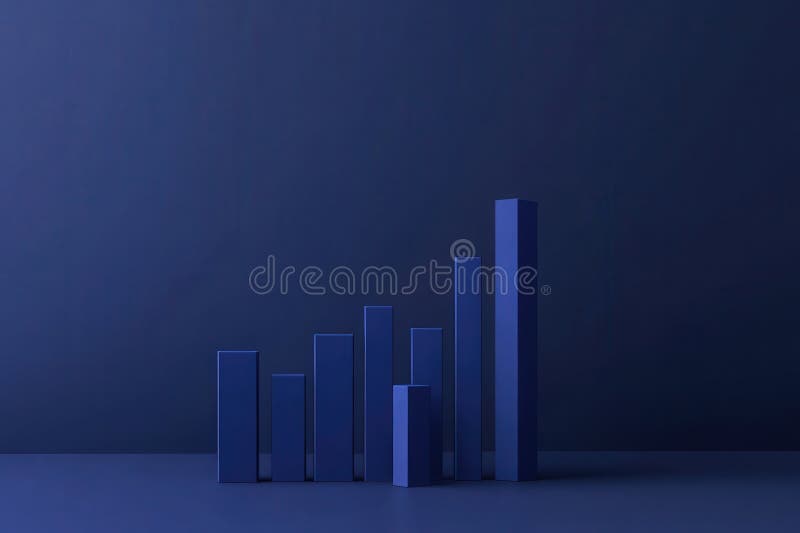
Free with trial The visual displays a clean and minimalist bar chart, illustrating a notable decrease in financial performance over a recent quarter, with a focus on dark blue tones to enhance impact. Decrease performance illustrations Minimalist financial bar chart showing significant decline in earnings over the past quarter. The visual displays a clean and minimalist bar chart, illustrating a notable decrease in financial performance over a recent quarter, with a focus on dark blue tones to enhance impact.
Free with trial Calculation percentage sign hand drawn. finance statistics, increase decrease, ratio proportion calculation percentage sign vector sketch. isolated color illustration. Decrease performance illustrations Calculation percentage sign sketch hand drawn vector. calculation percentage sign hand drawn. finance statistics, increase decrease, ratio proportion calculation percentage sign vector sketch. isolated color illustration
Free with trial Calculation percentage sign hand drawn. finance statistics, increase decrease, ratio proportion calculation percentage sign vector sketch. isolated color illustration. Decrease performance vectors Calculation percentage sign sketch hand drawn vector. calculation percentage sign hand drawn. finance statistics, increase decrease, ratio proportion calculation percentage sign vector sketch. isolated color illustration
Free with trial Calculation percentage sign hand drawn. finance statistics, increase decrease, ratio proportion calculation percentage sign vector sketch. isolated black illustration. Decrease performance illustrations Calculation percentage sign sketch hand drawn vector. calculation percentage sign hand drawn. finance statistics, increase decrease, ratio proportion calculation percentage sign vector sketch. isolated black illustration
Free with trial Calculation percentage sign hand drawn. finance statistics, increase decrease, ratio proportion calculation percentage sign vector sketch. isolated color illustration. Decrease performance illustrations Calculation percentage sign sketch hand drawn vector. calculation percentage sign hand drawn. finance statistics, increase decrease, ratio proportion calculation percentage sign vector sketch. isolated color illustration
Free with trial This graphic illustrates stable bank withdrawals alongside a rising financial trend with coins and bars, Bank withdrawals are currently stable and not showing any significant increase or decrease. Decrease performance vectors This graphic illustrates stable bank withdrawals alongside a rising financial trend with coins and bars, Bank withdrawals are
Free with trial Minimalist black and white outline vector illustration of a simplified line graph icon for business analytics and financial performance tracking in a corporate environment. Decrease performance vectors Clean and straightforward icon depicting an increasing and decreasing line graph. Minimalist black and white outline vector illustration of a simplified line graph icon for business analytics and financial performance tracking in a corporate environment
Free with trial Analysis of website traffic using magnifying glass on laptop. Detailed data, graphs reviewed for blog ranking. Online marketing, business performance monitoring key. Research. Decrease performance illustrations Analysis of website traffic using magnifying glass on laptop. Detailed data, graphs reviewed for blog ranking. Online marketing
Free with trial Close-up view of a graph with vibrant blue background. detailed analysis of data trends, insights, and patterns ,Generative AI. Decrease performance illustrations Detailed analysis, exploring data trends and patterns in vibrant blue graph. closeup view of business performance market insights. Close-up view of a graph with vibrant blue background. detailed analysis of data trends, insights, and patterns ,Generative AI
Free with trial Close-up of a microchip with a red downward stock market graph on a circuit board, symbolizing declining tech sector performance - AI-generated. Decrease performance illustrations Close-up of a microchip with a red downward stock market graph on a circuit board, symbolizing declining tech sector performance
Free with trial Reduction chart icon Vector symbol or sign set collection in black and white outline. Decrease performance vectors Decline Chart Icon Illustrating Decrease in Performance, Economic Downturn, and Analytical Data. Reduction chart icon Vector symbol or sign set collection in black and white outline
Free with trial Clean animated bar chart visualizing rising and falling market trends with green bars representing growth, profit, and positive performance, and red bars indicating decline, loss, and negative movement. Symbolizes financial volatility, stock market cycles, economic fluctuations, investment performance, and business analytics. Ideal for illustrating bullish and bearish phases, economic indicators, trading activity, and financial data visualization. Decrease performance illustrations Financial Market Trend Animation Showing Upturn and Downturn Phases. Clean animated bar chart visualizing rising and falling market trends with green bars representing growth, profit, and positive performance, and red bars indicating decline, loss, and negative movement. Symbolizes financial volatility, stock market cycles, economic fluctuations, investment performance, and business analytics. Ideal for illustrating bullish and bearish phases, economic indicators, trading activity, and financial data visualization.
Free with trial Declining bar graph with trend line symbolizing financial loss or business decrease. Decrease performance illustrations Declining Bar Chart with Downward Trend Line Illustration. Declining bar graph with trend line symbolizing financial loss or business decrease. Declining bar graph with trend line symbolizing financial loss or business decrease.
Free with trial A simple line chart illustrates a decreasing trend with distinct dot markers representing data points. The design emphasizes the shift in values over time and aids in visualizing performance. Decrease performance vectors Chart Displaying a Downward Trend in Data Analysis. A simple line chart illustrates a decreasing trend with distinct dot markers representing data points. The design emphasizes the shift in values over time and aids in visualizing performance.
Free with trial A graphic representing financial or performance decline featuring an orange arrow pointing downwards over a wavy line, with the word LOSS displayed below. Decrease performance illustrations Orange downward trend arrow over wavy line with loss text. A graphic representing financial or performance decline featuring an orange arrow pointing downwards over a wavy line, with the word LOSS displayed below
Free with trial Voltage meter RGB color icon. Energy measuring, power management. Monitoring, tracking. Increase arrow, decrease. Isolated vector illustration. Simple filled line drawing. Editable stroke. Decrease performance vectors Voltage meter RGB color icon
Free with trial Trends blinking sales graph illustration data visualization, performance revenue, metrics dashboard trends blinking sales graph. Decrease performance illustrations Trends blinking sales graph
Free with trial Graph chart infographic report set with statistic arrow data elements for financial market analysis and planning in business performance research for your illustration. Decrease performance vectors Graph chart infographic report set
Free with trial Graph chart infographic report set with statistic arrow data elements for financial market analysis and planning in business performance research for your illustration. Decrease performance vectors Graph chart infographic report set
Free with trial Graph chart infographic report set with statistic arrow data elements for financial market analysis and planning in business performance research for your illustration. Decrease performance vectors Graph chart infographic report set
Free with trial Reduction annual report green illustration carbon responsibility, commitment graph, decrease company reduction annual report green. Decrease performance illustrations Reduction annual report green
Free with trial A vibrant 3D bar chart icon isolated on a clean white background. This minimalist data visualization features five colorful bars in a soft, pastel palette of yellow, pink, and purple, arranged in descending order. The clean, modern render is perfect for illustrating concepts like business statistics, financial reports, market analysis, and performance metrics. An ideal graphic element for presentations, infographics, websites, and educational materials, symbolizing data, comparison, and analytics in a visually appealing way. 3D illustration. Decrease performance illustrations 3D Colorful Bar Chart for Business and Data Analysis. A vibrant 3D bar chart icon isolated on a clean white background. This minimalist data visualization features five colorful bars in a soft, pastel palette of yellow, pink, and purple, arranged in descending order. The clean, modern render is perfect for illustrating concepts like business statistics, financial reports, market analysis, and performance metrics. An ideal graphic element for presentations, infographics, websites, and educational materials, symbolizing data, comparison, and analytics in a visually appealing way. 3D illustration.
Free with trial Analysis dissolving revenue chart illustration data trends, visualization metrics, performance financials analysis dissolving revenue chart. Decrease performance illustrations Analysis dissolving revenue chart
Free with trial A blue line chart illustrates a downward trend, suggesting decline and loss and can be used to show financial or business performance. Decrease performance illustrations Downward Trend Chart. A blue line chart illustrates a downward trend, suggesting decline and loss and can be used to show financial or business performance
Free with trial An AI image illustration of an era where Bitcoin will experiencing a significant decrease in a short up to medium term, or so called a bearish time. Decrease performance illustrations Bitcoin bearish time. an AI image illustration of an era where Bitcoin will experiencing a significant decrease in a short up to medium term, or so called a bearish time
Free with trial A 3D rendered illustration depicting business growth. The image showcases two upward-trending arrow charts, one in gold and the other in blue, representing positive trends, progress, and success. The charts are set against a clean, light background, emphasizing the upward movement and potential for financial gain. Suitable for illustrating economic growth, investment strategies, and business performance. Decrease performance illustrations Growth Chart with Arrows. A 3D rendered illustration depicting business growth. The image showcases two upward-trending arrow charts, one in gold and the other in blue, representing positive trends, progress, and success. The charts are set against a clean, light background, emphasizing the upward movement and potential for financial gain. Suitable for illustrating economic growth, investment strategies, and business performance.
Free with trial Data merging loss graph illustration analysis metrics, performance validation, accuracy convergence data merging loss graph. Decrease performance illustrations Data merging loss graph
Free with trial A minimalist black and white icon representing a financial growth chart. It features a series of vertical bars of varying heights, symbolizing data points or periods, overlaid with a line graph connecting circular nodes. This graphic effectively conveys concepts of financial analysis, business growth, performance tracking, and data visualization. Ideal for presentations, reports, websites, and applications related to finance, economics, and business intelligence. Decrease performance vectors Growth Analysis Finance Chart Icon. A minimalist black and white icon representing a financial growth chart. It features a series of vertical bars of varying heights, symbolizing data points or periods, overlaid with a line graph connecting circular nodes. This graphic effectively conveys concepts of financial analysis, business growth, performance tracking, and data visualization. Ideal for presentations, reports, websites, and applications related to finance, economics, and business intelligence.
Free with trial Data merging sales graph illustration analysis trends, revenue performance, forecast comparison data merging sales graph. Decrease performance illustrations Data merging sales graph
Free with trial This image shows a financial report with bar graphs and numerical data, generated by AI, suggesting business performance or investment analysis. The document rests on a wooden desk, with coins blurred in the background, hinting at financial matters. Decrease performance illustrations Financial Report Analysis. This image shows a financial report with bar graphs and numerical data, generated by AI, suggesting business performance or investment analysis. The document rests on a wooden desk, with coins blurred in the background, hinting at financial matters.
Free with trial This image features two variations of a graph icon showing a downward trend. One is a simple outline, while the other is a solid black silhouette. Both depict a graph with a sharp decline, represented by a line with a downward-pointing arrow. The icons are suitable for illustrating concepts like financial loss, economic downturn, negative growth, or any situation involving a decrease in value or performance. Decrease performance illustrations Declining Graph Icon Set. This image features two variations of a graph icon showing a downward trend. One is a simple outline, while the other is a solid black silhouette. Both depict a graph with a sharp decline, represented by a line with a downward-pointing arrow. The icons are suitable for illustrating concepts like financial loss, economic downturn, negative growth, or any situation involving a decrease in value or performance.
Free with trial Chdissolve dissolving revenue chart illustration analysis data, trends visualization, metrics performance chdissolve dissolving revenue chart. Decrease performance illustrations Chdissolve dissolving revenue chart
Free with trial A minimalist bar chart with a descending line graph overlay, symbolizing financial loss, performance decline, or negative data trends. Ideal for presentations, dashboards, economic reports, and warning visuals. Decrease performance vectors Downward Trend Bar Chart Icon. A minimalist bar chart with a descending line graph overlay, symbolizing financial loss, performance decline, or negative data trends. Ideal for presentations, dashboards, economic reports, and warning visuals
Free with trial Data loading sales graph illustration analytics visualization, performance trends, metrics dashboard data loading sales graph. Decrease performance illustrations Data loading sales graph
Free with trial This image features two variations of a decreasing graph icon. One is an outline version, and the other is a solid black version. Both show a bar graph with descending bars and a curved arrow pointing downwards, symbolizing a decline or decrease. These icons are suitable for illustrating concepts like loss, recession, negative trends, or falling statistics in various contexts. Decrease performance illustrations Decreasing Graph Icon Set. This image features two variations of a decreasing graph icon. One is an outline version, and the other is a solid black version. Both show a bar graph with descending bars and a curved arrow pointing downwards, symbolizing a decline or decrease. These icons are suitable for illustrating concepts like loss, recession, negative trends, or falling statistics in various contexts.
Free with trial A 3D stock market chart displays a bearish trend, with red bars dominating the view. The visual represents downturns in market performance and investor sentiment. Decrease performance illustrations Bearish Stock Market Graph. A 3D stock market chart displays a bearish trend, with red bars dominating the view. The visual represents downturns in market performance and investor sentiment.
Free with trial A business professional displays a digital graph of business growth trends. The graph showcases upward and downward fluctuations, representing the dynamic and complex nature of market analysis. The image is a visual representation of business growth and analysis using technology. The professional is likely studying data to make informed decisions for optimal performance and future growth. Decrease performance illustrations Business Growth Trend Analysis with Digital Graph. A business professional displays a digital graph of business growth trends. The graph showcases upward and downward fluctuations, representing the dynamic and complex nature of market analysis. The image is a visual representation of business growth and analysis using technology. The professional is likely studying data to make informed decisions for optimal performance and future growth
Free with trial This image depicts a downward trending arrow formed by a series of red dots against a bright blue sky with fluffy white clouds. The trajectory is clearly negative, visually representing a decline or decrease. This graphic was generated by AI, offering a simple yet effective visual representation of. Decrease performance illustrations AI Generated Downward Trend. This image depicts a downward trending arrow formed by a series of red dots against a bright blue sky with fluffy white clouds. The trajectory is clearly negative, visually representing a decline or decrease. This graphic was generated by AI, offering a simple yet effective visual representation of
Free with trial A 3D icon featuring a red downward arrow, commonly representing a decline, decrease, or negative trend in financial and business metrics. Decrease performance vectors 3D Red Downward Trend Arrow Icon. A 3D icon featuring a red downward arrow, commonly representing a decline, decrease, or negative trend in financial and business metrics
Free with trial Bar graphs data illustration company year, color performance, categories trend bar graphs data. Decrease performance illustrations Bar graphs data
Free with trial Growth scanning revenue chart illustration decline forecast, data performance, metrics visualization growth scanning revenue chart. Decrease performance illustrations Growth scanning revenue chart
Free with trial A simple line graph illustration showing fluctuations and an upward trend. The graph is drawn on a grid with a black line and red data points, indicating a period of increase, followed by a decrease, and then a final increase. This image can be used to represent business trends, financial analysis, stock market data, or any data that shows changes over time. Decrease performance vectors Line Graph with Fluctuations. A simple line graph illustration showing fluctuations and an upward trend. The graph is drawn on a grid with a black line and red data points, indicating a period of increase, followed by a decrease, and then a final increase. This image can be used to represent business trends, financial analysis, stock market data, or any data that shows changes over time.
Free with trial This image shows a 3D rendering of a red line graph sharply declining, resting on a white cube. The graphic is generated by AI, and visually represents a negative trend or downturn, suitable for presentations or reports on market analysis, economic forecasts, or business performance. Decrease performance illustrations Declining Trend Visualization. This image shows a 3D rendering of a red line graph sharply declining, resting on a white cube. The graphic is generated by AI, and visually represents a negative trend or downturn, suitable for presentations or reports on market analysis, economic forecasts, or business performance.
Free with trial Analysis replicating sales graph illustration trends visualization, performance growth, revenue forecasting analysis replicating sales graph. Decrease performance illustrations Analysis replicating sales graph
Free with trial Responsibility annual report green illustration commitment graph, decrease company, eco friendly responsibility annual report green. Decrease performance illustrations Responsibility annual report green
Free with trial A clean, minimalist 3D render of a blue bar chart with a blue trend line connecting circular data points. The bars vary in height, illustrating growth and fluctuations. The background is a bright, clean white, emphasizing the chart's elements. This graphic is ideal for representing financial data, business growth, market trends, statistics, and performance analysis in a modern and professional style. Decrease performance illustrations 3D Blue Bar Chart with Trend Line. A clean, minimalist 3D render of a blue bar chart with a blue trend line connecting circular data points. The bars vary in height, illustrating growth and fluctuations. The background is a bright, clean white, emphasizing the chart's elements. This graphic is ideal for representing financial data, business growth, market trends, statistics, and performance analysis in a modern and professional style.
Free with trial Visualization blinking sales graph illustration performance revenue, metrics dashboard, insights forecast visualization blinking sales graph. Decrease performance illustrations Visualization blinking sales graph
Free with trial A simple, flat design graphic illustrating a downward trend in a graph. A stylized person with flames above their head is positioned below the declining line graph, symbolizing stress, loss, or a negative impact. Suitable for presentations, articles, or social media posts related to business performance, market analysis, personal development, or any situation involving a downward trend. The flat design makes it versatile and easily adaptable for various uses. Decrease performance vectors Declining Graph with Stressed Person. A simple, flat design graphic illustrating a downward trend in a graph. A stylized person with flames above their head is positioned below the declining line graph, symbolizing stress, loss, or a negative impact. Suitable for presentations, articles, or social media posts related to business performance, market analysis, personal development, or any situation involving a downward trend. The flat design makes it versatile and easily adaptable for various uses.
Free with trial Close-up of a digital stock market ticker showing share symbols, prices, percentage changes, and market index performance. The display features rising and falling stocks, market fluctuations, and trading data. Ideal for financial concepts, investment visuals, stock exchange, market trends, trading platforms, finance news, economic reports, and financial presentations. Decrease performance illustrations . Close-up of a digital stock market ticker showing share symbols, prices, percentage changes, and market index performance. The display features rising and falling stocks, market fluctuations, and trading data. Ideal for financial concepts, investment visuals, stock exchange, market trends, trading platforms, finance news, economic reports, and financial presentations.
Free with trial Vector icon of a downward arrow or falling graph, symbolizing financial decline, loss trends, market crash, and negative economic performance. Ideal for finance apps, investment platforms, business reports, stock market analysis, and economic infographics. Clean, impactful, and scalable for both digital and print use. Decrease performance vectors Financial Decline Trend Loss Graph Icon. Vector icon of a downward arrow or falling graph, symbolizing financial decline, loss trends, market crash, and negative economic performance. Ideal for finance apps, investment platforms, business reports, stock market analysis, and economic infographics. Clean, impactful, and scalable for both digital and print use.
Free with trial Vector illustration of a red downward trend line graph showing economic crisis, financial loss, or business decline. Concept of recession, risk, and negative performance. Decrease performance vectors Downward trend red graph illustration. Vector illustration of a red downward trend line graph showing economic crisis, financial loss, or business decline. Concept of recession, risk, and negative performance.
Free with trial The image depicts a red arrow graph with a blue glow, indicating a downward trend. it is set against a dark gray, textured wall illuminated by a spotlight from above, creating a dramatic effect. the arrow starts high on the left and descends sharply towards the bottom right, suggesting a significant decline in performance, such as in business or finance. the floor is a smooth, dark surface that reflects the light, adding depth to the scene. Decrease performance illustrations Red arrow graph showing downward trend. the image depicts a red arrow graph with a blue glow, indicating a downward trend. it is set against a dark gray, textured wall illuminated by a spotlight from above, creating a dramatic effect. the arrow starts high on the left and descends sharply towards the bottom right, suggesting a significant decline in performance, such as in business or finance. the floor is a smooth, dark surface that reflects the light, adding depth to the scene.
Free with trial A versatile set of business and finance icons isolated on a white background. This collection features various data visualization elements, including bar charts, line graphs, pie charts, and diagrams. The clean, vector style represents concepts like statistical analysis, market growth, financial reporting, and economic trends. These infographic elements are perfect for presentations, business reports, websites, and marketing materials to illustrate progress, performance, and data-driven insights. Decrease performance vectors Business and Finance Chart and Graph Icon Set. A versatile set of business and finance icons isolated on a white background. This collection features various data visualization elements, including bar charts, line graphs, pie charts, and diagrams. The clean, vector style represents concepts like statistical analysis, market growth, financial reporting, and economic trends. These infographic elements are perfect for presentations, business reports, websites, and marketing materials to illustrate progress, performance, and data-driven insights.
Free with trial A modern flat design icon representing financial data analysis and market trends. This vector illustration features a combination of a green bar chart and a dark grey line graph, showing fluctuations in performance. An upward arrow indicates initial growth, followed by a volatile trend line symbolizing concepts like market instability, economic changes, profit and loss, or business analytics. This versatile graphic is perfect for infographics, financial reports, presentations, websites, and applications related to business, finance, statistics, and economics. Isolated on a white background for easy use. Decrease performance vectors Financial Market Fluctuation Graph Icon. A modern flat design icon representing financial data analysis and market trends. This vector illustration features a combination of a green bar chart and a dark grey line graph, showing fluctuations in performance. An upward arrow indicates initial growth, followed by a volatile trend line symbolizing concepts like market instability, economic changes, profit and loss, or business analytics. This versatile graphic is perfect for infographics, financial reports, presentations, websites, and applications related to business, finance, statistics, and economics. Isolated on a white background for easy use.
Free with trial Mobile app uninstall rate affects user retention and engagement. Tracking uninstall analytics helps optimize app performance, reduce churn, improve mobile app marketing strategies vector illustration. Decrease performance vectors Mobile app uninstall rate affects user retention and engagement. Tracking uninstall analytics helps optimize app
Free with trial A vibrant 3D bar chart featuring multiple colorful columns, including red, blue, green, yellow, and purple, set against a clean white background. The bars vary in height, representing different data points or categories, and are displayed on a reflective surface, adding depth to the visualization. Grid lines provide a clear scale for interpretation. This modern graphic is ideal for illustrating statistics, business growth, financial performance, market analysis, and educational concepts in presentations, reports, and digital media. Decrease performance illustrations Colorful 3D Bar Chart on White Background. A vibrant 3D bar chart featuring multiple colorful columns, including red, blue, green, yellow, and purple, set against a clean white background. The bars vary in height, representing different data points or categories, and are displayed on a reflective surface, adding depth to the visualization. Grid lines provide a clear scale for interpretation. This modern graphic is ideal for illustrating statistics, business growth, financial performance, market analysis, and educational concepts in presentations, reports, and digital media.
Free with trial A 3D icon of a red downward arrow, often used to represent a recession, economic decline, or negative financial performance. Decrease performance vectors 3D Red Downward Arrow Indicating Recession Icon. A 3D icon of a red downward arrow, often used to represent a recession, economic decline, or negative financial performance
Free with trial A modern, colorful bar chart illustrates a downward trend in financial performance or statistical data. Decrease performance illustrations Financial Data Analysis Graph Illustration. A modern, colorful bar chart illustrates a downward trend in financial performance or statistical data
Free with trial A vibrant, glossy red 3D percentage symbol stands prominently on a clean white background, casting a subtle shadow. This eye-catching graphic is perfect for conveying concepts of discounts, sales, interest rates, financial growth, or statistical data. Its bold, modern design makes it ideal for marketing campaigns, business presentations, retail promotions, economic reports, or any project requiring a clear and impactful representation of percentages, savings, or performance metrics. Decrease performance illustrations Red 3D Percentage Symbol on White Background. A vibrant, glossy red 3D percentage symbol stands prominently on a clean white background, casting a subtle shadow. This eye-catching graphic is perfect for conveying concepts of discounts, sales, interest rates, financial growth, or statistical data. Its bold, modern design makes it ideal for marketing campaigns, business presentations, retail promotions, economic reports, or any project requiring a clear and impactful representation of percentages, savings, or performance metrics.