Free with trial This image features two minimalist icons representing financial or data trends. The left icon is a white line graph with circular data points and directional arrows, set against a solid black shield shape. The right icon presents the same line graph and data points within a black outline of a shield, on a white background. Both icons depict fluctuating data, with one showing a downward trend and the other an upward trend, symbolizing market volatility, analysis, and security. Decrease performance illustrations Line Graph Icon with Shield Symbol - Upward and Downward Trends. This image features two minimalist icons representing financial or data trends. The left icon is a white line graph with circular data points and directional arrows, set against a solid black shield shape. The right icon presents the same line graph and data points within a black outline of a shield, on a white background. Both icons depict fluctuating data, with one showing a downward trend and the other an upward trend, symbolizing market volatility, analysis, and security.
Free with trial This image depicts a computer screen displaying a sharply declining stock market graph, generated by AI. The red line dramatically illustrates a significant market downturn, accompanied by numerous data points and financial indicators. The dark aesthetic enhances the sense of urgency and potential. Decrease performance illustrations AI-Generated Stock Market Decline. This image depicts a computer screen displaying a sharply declining stock market graph, generated by AI. The red line dramatically illustrates a significant market downturn, accompanied by numerous data points and financial indicators. The dark aesthetic enhances the sense of urgency and potential
Free with trial A stack of coins rests on a financial chart showing a downward trend. This image, generated by AI, visually represents economic fluctuations and market instability. The dark coins emphasize the seriousness of the financial situation depicted by the graph. Decrease performance illustrations Financial Market Trends. A stack of coins rests on a financial chart showing a downward trend. This image, generated by AI, visually represents economic fluctuations and market instability. The dark coins emphasize the seriousness of the financial situation depicted by the graph.
Free with trial The image shows a visual representation of a downward trend using a bar chart and a bold red arrow pointing downward. The chart is displayed on a light-colored easel with a small figure standing behind it, suggesting a presentation or analysis of decreasing values over time, possibly in a business or financial context. Decrease performance illustrations Declining trend illustrated with bar chart and arrow on easel. The image shows a visual representation of a downward trend using a bar chart and a bold red arrow pointing downward. The chart is displayed on a light-colored easel with a small figure standing behind it, suggesting a presentation or analysis of decreasing values over time, possibly in a business or financial context
Free with trial Black silhouette of descending bar chart with arrow, isolated on white background. concept of financial decline, statistics, economic downturn, data analysis, business graph. Decrease performance vectors Black silhouette of descending bar chart with arrow, isolated on white background. concept of financial decline, statistics
Free with trial Falling bar chart with up and right arrows illustrating declining business trends. Decrease performance vectors Falling bar chart with up and right arrows illustrating declining business trends
Free with trial Bar chart collapse icon with downward arrow. Decline and negative trend sign symbol vector. Decrease performance vectors Bar chart collapse icon with downward arrow. Decline and negative trend sign symbol
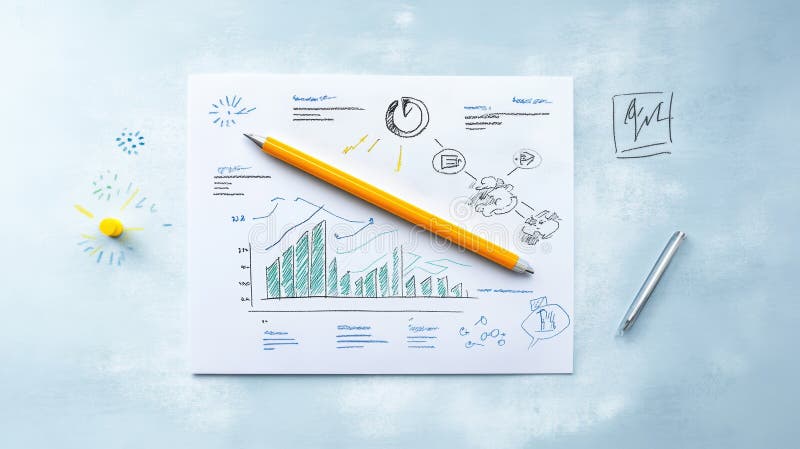
Free with trial Graph depiction on paper with a pencil ,Generative ai. Decrease performance illustrations Pencil and paper, a detailed illustration of graph for data analysis visualization. Graph depiction on paper with a pencil ,Generative ai
Free with trial Digital illustration depicting a financial decline with red downward-trending graphs, coin stacks, and scattered currency symbols. Set against a dark grid background with neon highlights, this image conveys themes of market loss, economic recession, and financial analysis�ideal for business, editorial, and presentation use. Decrease performance illustrations Economic Downturn Illustration Red Decline Graph with Coin Stacks on Digital Grid. Digital illustration depicting a financial decline with red downward-trending graphs, coin stacks, and scattered currency symbols. Set against a dark grid background with neon highlights, this image conveys themes of market loss, economic recession, and financial analysis�ideal for business, editorial, and presentation use.
Free with trial A stark red arrow zigzags downwards, powerfully representing economic downturns, market crashes, and negative financial trends. This visual signifies a crisis or significant drop. Decrease performance illustrations Red downward arrow symbolizing financial decline and economic recession trends. A stark red arrow zigzags downwards, powerfully representing economic downturns, market crashes, and negative financial trends. This visual signifies a crisis or significant drop
Free with trial A visual representation of a declining stock market trend, depicted by a bold red arrow descending across a financial graph, symbolizing economic downturn and investment loss. Decrease performance illustrations A red arrow pointing downwards on a stock market graph, isolated on white background. A visual representation of a declining stock market trend, depicted by a bold red arrow descending across a financial graph, symbolizing economic downturn and investment loss
Free with trial Collection of various red infographic elements including charts, graphs, diagrams, and symbols, perfect for presentations and data visualization. Ideal for showcasing data trends, progress, and comparisons. Easily customizable and adaptable to diverse projects. Decrease performance illustrations Red Infographic Elements
Free with trial A graph shows a downward trend. Green bars diminish in height along a timeline. A red arrow underscores the downward movement of the data on the timeline. Decrease performance illustrations Decreasing graph showing green bars plunging downward with a red arrow indication. A graph shows a downward trend. Green bars diminish in height along a timeline. A red arrow underscores the downward movement of the data on the timeline
Free with trial A collection of black and white icons representing financial concepts such as growth charts, decline arrows, and money symbols, all presented clearly on a plain white background for easy integration i. Decrease performance vectors Financial growth and decline icons isolated on transparent background. A collection of black and white icons representing financial concepts such as growth charts, decline arrows, and money symbols, all presented clearly on a plain white background for easy integration i
Free with trial Dark grey descending bar chart with arrow indicating decline on white background. Decrease performance illustrations Dark grey descending bar chart with arrow indicating decline on white background
Free with trial Interface displaying downward-trending bar chart and dotted line on dashboard, with ticker symbols. Finance, analytics, data visualization, investment, technological, corporate, digital. Decrease performance illustrations Interface displaying downward-trending bar chart and dotted line on dashboard, with ticker symbols
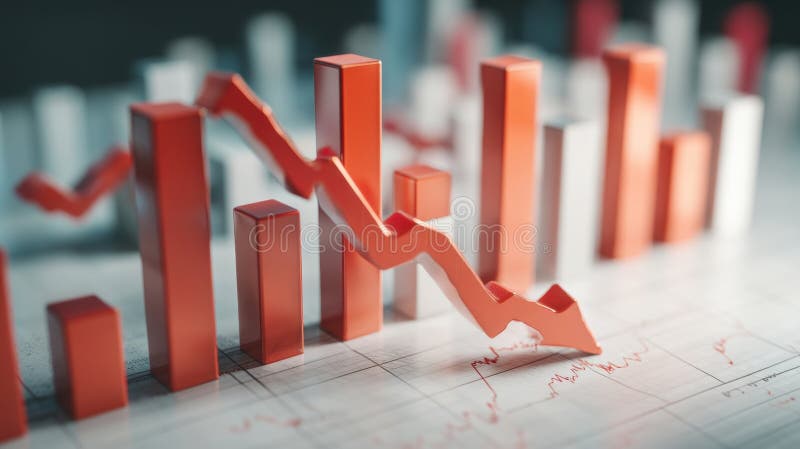
Free with trial This image depicts a 3D rendering of a downward trending graph, generated by AI, showcasing a clear visual representation of market decline or economic downturn. The red bars and arrow emphasize the severity of the fall, suggesting potential financial instability or crisis. Decrease performance illustrations Declining Market Trends. This image depicts a 3D rendering of a downward trending graph, generated by AI, showcasing a clear visual representation of market decline or economic downturn. The red bars and arrow emphasize the severity of the fall, suggesting potential financial instability or crisis.
Free with trial This image depicts a downward trending graph, generated by AI, illustrating a sharp decline in market performance. The 3D rendered red arrow emphasizes the severity of the fall. It symbolizes economic downturn, financial crisis, or market instability. Decrease performance illustrations Declining Market Trends. This image depicts a downward trending graph, generated by AI, illustrating a sharp decline in market performance. The 3D rendered red arrow emphasizes the severity of the fall. It symbolizes economic downturn, financial crisis, or market instability.
Free with trial Businessman on percentage sign with falling down. Depicts Inflation, decline, falling profits in an economic recession and falling stock market values. Success talent concept. Decrease performance vectors Profit Fall in Economic Recession. Businessman on Percentage Sign with Falling Down. Businessman on percentage sign with falling down. Depicts Inflation, decline, falling profits in an economic recession and falling stock market values. Success talent concept
Free with trial A currency icon with downward arrows represents loss and declining financial value. This graphic suits risk reports, business dashboards, accounting materials, and market analysis presentations. Decrease performance vectors Loss Finance Downward Currency Symbol. A currency icon with downward arrows represents loss and declining financial value. This graphic suits risk reports, business dashboards, accounting materials, and market analysis presentations
Free with trial Up and down arrow on bar chart icon set. Growth and decline graph symbol illustration. Financial trend concept. Decrease performance vectors Up and down arrow on bar chart icon set. Growth and decline graph symbol. Financial trend concept
Free with trial Year to year on white paper background. Decrease performance illustrations Year to year on white paper
Free with trial Revenue turnover word block on white background. Decrease performance illustrations Revenue turnover word block on white
Free with trial A snarling brown bear symbolizes a bear market, with a declining stock chart and red candlestick graph, illustrating financial downturn and investment losses against a dark red background. Decrease performance illustrations Bear Market Snarl: Stock Chart Downtrend, Candlestick Graph Plunge. A snarling brown bear symbolizes a bear market, with a declining stock chart and red candlestick graph, illustrating financial downturn and investment losses against a dark red background
Free with trial Red downward arrows symbolize a decline in financial markets or economic downturn. The background features blurred lights, enhancing the dramatic effect. Decrease performance illustrations Red downward arrows symbolize a decline in financial markets or economic downturn.
Free with trial This futuristic visualization, generated by AI, depicts a global Bitcoin network, highlighting its worldwide reach and digital infrastructure. Data streams and interactive elements showcase the complex interplay of transactions and information flow within the cryptocurrency ecosystem. Decrease performance illustrations Global Bitcoin Network
Free with trial This conceptual illustration depicts the relationship between productivity signals and cognitive flow lines in human brains. The image features two stylized human heads, one with a red and orange network representing a decrease in productivity, and the other with a blue and green network representing an increase in productivity. The illustration highlights the importance of understanding mental states and optimizing workflow to achieve success and improve overall well-being. Decrease performance vectors Mental health A conceptual illustration of productivity signals and cognitive flow lines in human brains. This conceptual illustration depicts the relationship between productivity signals and cognitive flow lines in human brains. The image features two stylized human heads, one with a red and orange network representing a decrease in productivity, and the other with a blue and green network representing an increase in productivity. The illustration highlights the importance of understanding mental states and optimizing workflow to achieve success and improve overall well-being.
Free with trial Set of twelve black and white icons representing business and finance concepts such as graphs charts analysis tools and targets isolated on transparent background. Decrease performance vectors Collection of business and finance icons including graphs charts and analysis tools for presentations and reports. Set of twelve black and white icons representing business and finance concepts such as graphs charts analysis tools and targets isolated on transparent background
Free with trial Calendar graph line icon. Halftone dotted pattern. Gradient icon with grain shadow. Column chart sign. Growth diagram symbol. Line calendar graph icon. Various designs. Vector. Decrease performance vectors Calendar graph line icon. Column chart sign. Halftone dotted pattern. Vector. Calendar graph line icon. Halftone dotted pattern. Gradient icon with grain shadow. Column chart sign. Growth diagram symbol. Line calendar graph icon. Various designs. Vector
Free with trial A striking 3D rendering features an abstract bar graph composed of numerous translucent blue rectangular blocks against a dark, almost black, background. The varying heights of the blocks create a dynamic visual representation of data, statistics, or growth trends. This modern and futuristic design is ideal for illustrating concepts related to business, finance, technology, analytics, market research, or digital information in presentations, reports, websites, and corporate media. Decrease performance illustrations Abstract 3D Blue Bar Graph Visualization. A striking 3D rendering features an abstract bar graph composed of numerous translucent blue rectangular blocks against a dark, almost black, background. The varying heights of the blocks create a dynamic visual representation of data, statistics, or growth trends. This modern and futuristic design is ideal for illustrating concepts related to business, finance, technology, analytics, market research, or digital information in presentations, reports, websites, and corporate media.
Free with trial A glowing neon blue line graph depicts a steep downward trend with an arrow indicating a significant fall. Decrease performance illustrations Neon blue graph illustrating a sharp decline and downward trend on a dark background. A glowing neon blue line graph depicts a steep downward trend with an arrow indicating a significant fall
Free with trial Travel industry decline, concept. Colorful suitcases with downward red arrow. 3D rendering isolated on white background. Decrease performance illustrations Travel industry decline, concept. Colorful suitcases with downward red arrow. 3D rendering
Free with trial Red line graph showing a sharp decline overlays a world map, symbolizing a global financial crisis and market downturn. The graph, illuminated in red, sharply contrasts the dark background, highlighting volatility and economic instability. The map features continents in a subdued light, enhancing the focus on the graph's fluctuating line. This visual concept emphasizes the widespread impact of economic recession. Decrease performance illustrations Glowing red graph showing a stock market crash and economic recession over a world map. Red line graph showing a sharp decline overlays a world map, symbolizing a global financial crisis and market downturn. The graph, illuminated in red, sharply contrasts the dark background, highlighting volatility and economic instability. The map features continents in a subdued light, enhancing the focus on the graph's fluctuating line. This visual concept emphasizes the widespread impact of economic recession.
Free with trial Viewing Progress Icon Line Design Style Finance and Business Symbol Vector Illustrations. Decrease performance vectors Viewing Progress Icon Line Design Style Finance and Business Symbol
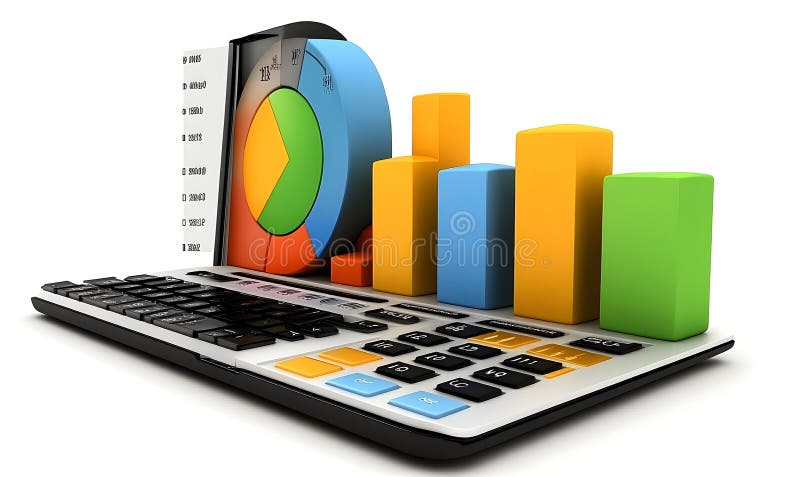
Free with trial Colorful Charts on a Calculator Keyboard. Decrease performance illustrations Colorful Charts on a Calculator Keyboard
Free with trial A simple black line graph depicts a downward trend with sharp fluctuations on white. Decrease performance illustrations Black line graph showing a downward trend on a white background chart. A simple black line graph depicts a downward trend with sharp fluctuations on white
Free with trial This image shows a calculator, tablet, and financial charts, all generated by AI for illustrative purposes. The blue color scheme emphasizes the data-driven nature of modern finance and business analytics. The image suggests efficiency and precision in financial planning and analysis. Decrease performance illustrations Financial Data Analysis. This image shows a calculator, tablet, and financial charts, all generated by AI for illustrative purposes. The blue color scheme emphasizes the data-driven nature of modern finance and business analytics. The image suggests efficiency and precision in financial planning and analysis.
Free with trial Business data is visually represented in black and white through various charts and graphs illustrating growth analysis and strategic planning for financial reporting showing a clear picture of market. Decrease performance vectors Black and white business data visualization with charts and graphs showing growth and analysis for financial reporting and. Business data is visually represented in black and white through various charts and graphs illustrating growth analysis and strategic planning for financial reporting showing a clear picture of market
Free with trial Graphs set with line charts, bar charts, and scatter plots illustrating upward and downward trends with arrows and data points. Decrease performance vectors Graphs set with line charts, bar charts, and scatter plots illustrating upward and
Free with trial Decreasing graph line icon. Halftone dotted pattern. Gradient icon with grain shadow. Column chart sign. Crisis diagram symbol. Line decreasing graph icon. Various designs. Vector. Decrease performance vectors Decreasing graph line icon. Crisis chart sign. Halftone dotted pattern. Vector. Decreasing graph line icon. Halftone dotted pattern. Gradient icon with grain shadow. Column chart sign. Crisis diagram symbol. Line decreasing graph icon. Various designs. Vector
Free with trial A close-up shot shows a hand placing a wooden block with a percentage symbol and downward arrow onto others spelling COST, representing a decrease in expenses or savings. Decrease performance illustrations Hand adjusting wooden blocks spelling cost with percentage symbol implying cost reduction. A close-up shot shows a hand placing a wooden block with a percentage symbol and downward arrow onto others spelling COST, representing a decrease in expenses or savings
Free with trial 3D illustration of a red bar chart with a downward arrow, isolated on a transparent background. Symbolizes financial loss, economic crisis, revenue drop, or business decline. Ideal for presentations, finance reports, investment warnings, stock market analysis, and economic downturn visuals. Decrease performance illustrations 3D Red Downward Arrow Graph Icon Showing Financial Decline on Transparent Background. 3D illustration of a red bar chart with a downward arrow, isolated on a transparent background. Symbolizes financial loss, economic crisis, revenue drop, or business decline. Ideal for presentations, finance reports, investment warnings, stock market analysis, and economic downturn visuals.
Free with trial A simple bar graph illustrating upward growth and financial success. Ideal for presentations, reports, and website use. Decrease performance vectors Upward Trending Bar Graph: Business Growth and Financial Success. A simple bar graph illustrating upward growth and financial success. Ideal for presentations, reports, and website use.
Free with trial Close-up of a financial chart showing a red line declining. The chart is on a piece of white paper and the red line is the main focus. Decrease performance illustrations Financial Chart Showing Decline. Close-up of a financial chart showing a red line declining. The chart is on a piece of white paper and the red line is the main focus
Free with trial Graph line icon. Neumorphic, Flat shadow, 3d buttons. Column chart sign. Growth diagram symbol. Line graph chart icon. Social media icons. Vector. Decrease performance vectors Graph line icon. Column chart sign. Neumorphic buttons. Vector. Graph line icon. Neumorphic, Flat shadow, 3d buttons. Column chart sign. Growth diagram symbol. Line graph chart icon. Social media icons. Vector
Free with trial Financial data analysis tools, vibrant background Generative AI. Decrease performance illustrations Financial data analysis tools
Free with trial A business professional conducts a thorough analysis of financial data using a magnifying glass, illustrating market trends with graphs and charts on a digital interface. Scalp. Decrease performance illustrations Business Professional Analyzing Financial Data with a Magnifying Glass, Graphs, and Visual Representation of Market. A business professional conducts a thorough analysis of financial data using a magnifying glass, illustrating market trends with graphs and charts on a digital interface. Scalp
Free with trial Falling Sales: Declining Chart with Tag, Downward Trend Arrow and Business Graph Concept. Decrease performance vectors Falling Sales: Declining Chart with Tag, Downward Trend Arrow and Business Graph Concept
Free with trial A close-up shot of a printed financial report showing market fluctuations indicated by a red line graph. Decrease performance illustrations A financial document showing a fluctuating red line graph displayed. A close-up shot of a printed financial report showing market fluctuations indicated by a red line graph
Free with trial A diverse team of business professionals collaborating in a meeting. This vector illustration features five colleagues, men and women in corporate attire, gathered around a laptop and tablet, actively discussing a project. The scene, depicted in a clean, modern flat design style on a white background, is ideal for concepts like teamwork, data analysis, problem-solving, and strategic planning. The negative number shown can represent financial review, performance metrics, or tackling a business challenge, making it versatile for various corporate and financial themes. Decrease performance illustrations Business Team Collaboration Analyzing Negative Results Vector Illustration. A diverse team of business professionals collaborating in a meeting. This vector illustration features five colleagues, men and women in corporate attire, gathered around a laptop and tablet, actively discussing a project. The scene, depicted in a clean, modern flat design style on a white background, is ideal for concepts like teamwork, data analysis, problem-solving, and strategic planning. The negative number shown can represent financial review, performance metrics, or tackling a business challenge, making it versatile for various corporate and financial themes.
Free with trial A black graph on a white background depicts a sharp downward trend with an arrow indicating further decline. Decrease performance illustrations Black graph showing a downward trend on a white background chart decline. A black graph on a white background depicts a sharp downward trend with an arrow indicating further decline
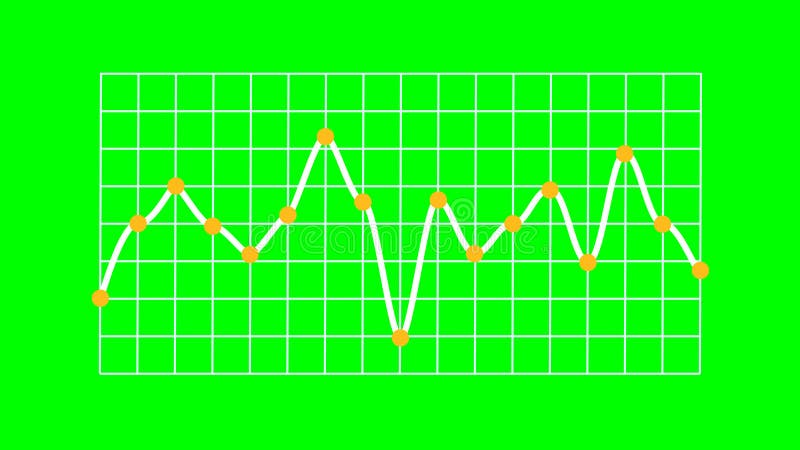
Free with trial Rendered line graph showing a single white line indicating data trends with distinct fluctuations. Yellow marker points animate vertically from the X-axis, and each plotted value features an orange circular dot. The white line runs over a structured white grid on a bright green screen background, enabling chroma keying. No axis values or units are present, emphasizing visual representation of abstract data and business trends. Decrease performance illustrations Business Trend Line Graph Showing Trading on Green Screen. Rendered line graph showing a single white line indicating data trends with distinct fluctuations. Yellow marker points animate vertically from the X-axis, and each plotted value features an orange circular dot. The white line runs over a structured white grid on a bright green screen background, enabling chroma keying. No axis values or units are present, emphasizing visual representation of abstract data and business trends.
Free with trial Hand drawing a down arrow over a decreasing bar chart on a green chalkboard. Decrease performance illustrations Hand drawing declining bar graph on blackboard. Hand drawing a down arrow over a decreasing bar chart on a green chalkboard
Free with trial This image illustrates a comparison between an increasing trend and a decreasing trend using bar graphs and arrows. Decrease performance illustrations Comparison of increasing and decreasing trends. This image illustrates a comparison between an increasing trend and a decreasing trend using bar graphs and arrows
Free with trial Hand presents a declining bar graph illustrating cost reduction, creating a compelling business visual Perfect for presentations and financial analysis. Decrease performance illustrations Presenting Cost Reduction with Graph and Hand. Hand presents a declining bar graph illustrating cost reduction, creating a compelling business visual Perfect for presentations and financial analysis
Free with trial This 3D rendered image shows a computer screen displaying various charts and graphs, including bar charts, pie charts, and line graphs. The data visualization is colorful and easy to understand, generated by AI for quick data interpretation. The design is simple and modern, ideal for presentations. Decrease performance illustrations AI-Generated Data Dashboard. This 3D rendered image shows a computer screen displaying various charts and graphs, including bar charts, pie charts, and line graphs. The data visualization is colorful and easy to understand, generated by AI for quick data interpretation. The design is simple and modern, ideal for presentations
Free with trial Modern, minimalistic chart icon for business and finance. Decrease performance illustrations Modern, minimalistic chart icon for business and finance
Free with trial Graph line icon. Continuous line with share plane. Column chart sign. Growth diagram symbol. 3d heart in speech bubble. Graph chart single line ribbon. Loop curve pattern. Vector. Decrease performance vectors Graph line icon. Column chart sign. Continuous line with plane. Vector. Graph line icon. Continuous line with share plane. Column chart sign. Growth diagram symbol. 3d heart in speech bubble. Graph chart single line ribbon. Loop curve pattern. Vector
Free with trial This image represents a financial crisis with a downward trend and a broken surface. Decrease performance illustrations Economic downturn concept with a red graph and a blue arrow pointing down. This image represents a financial crisis with a downward trend and a broken surface
Free with trial A minimalist, black and white vector icon representing a bar chart or graph. The icon features a series of vertical bars of varying heights, set against a base of horizontal lines. This clean and modern design is ideal for representing data, statistics, progress, growth, or financial information in digital and print media. Its simple aesthetic makes it versatile for use in presentations, websites, apps, and infographics. Decrease performance vectors Abstract Bar Chart Icon. A minimalist, black and white vector icon representing a bar chart or graph. The icon features a series of vertical bars of varying heights, set against a base of horizontal lines. This clean and modern design is ideal for representing data, statistics, progress, growth, or financial information in digital and print media. Its simple aesthetic makes it versatile for use in presentations, websites, apps, and infographics.
Free with trial A robotic hand interacts with a digital display showcasing a declining cost graph, symbolizing advancements in finance and technology in a modern business setting. Synapse. Decrease performance illustrations Futuristic Robot Hand Pointing Towards Digital Cost Decrease Graph Over Dark Business Environment with City Lights in. A robotic hand interacts with a digital display showcasing a declining cost graph, symbolizing advancements in finance and technology in a modern business setting. Synapse
Free with trial A cartoon illustration of a man interacting with a bar chart. The man is depicted in a simple, clean style, wearing a blue shirt and brown pants. He is holding a green bar, seemingly adjusting or interacting with the colorful bars displayed on a table. The illustration is suitable for conveying concepts related to data analysis, business, finance, and presentation. Decrease performance illustrations Cartoon Man and Bar Chart. A cartoon illustration of a man interacting with a bar chart. The man is depicted in a simple, clean style, wearing a blue shirt and brown pants. He is holding a green bar, seemingly adjusting or interacting with the colorful bars displayed on a table. The illustration is suitable for conveying concepts related to data analysis, business, finance, and presentation.
Free with trial Business decline and economic recession concept with a falling bar graph and a downward red arrow. Decrease performance vectors Business decline and economic recession concept with a falling bar graph and a downward red arrow
Free with trial Blue graphs and charts depicting financial analysis and market trends with fountain pen. Decrease performance illustrations Blue graphs and charts depicting financial analysis and market trends with
Free with trial Business decline icon vector with downward arrow. Loss, failure, or economic crisis symbol with long shadow. Decrease performance vectors Business decline icon with downward arrow. Loss, failure, or economic crisis symbol with long shadow
Free with trial Unemployment rate gauge shows the current economic climate with a red needle pointing towards a high rate indicating potential financial instability market downturn and job insecurity reflecting conc. Decrease performance illustrations Unemployment rate gauge showing economic conditions with a red indicator needle pointing up. Unemployment rate gauge shows the current economic climate with a red needle pointing towards a high rate indicating potential financial instability market downturn and job insecurity reflecting conc
Free with trial Red bar graph with decreasing values. Generative AI. Decrease performance illustrations Red bar graph with decreasing values
Free with trial Collection of black flat design icons illustrating downward trending graphs, magnifying glass analysis, broken server, report documents, and gear with bar chart, used for business and finance visuals. Generative AI. Decrease performance vectors Black flat design icons set showing declining business graphs charts magnifying glass office documents computer screen and. Collection of black flat design icons illustrating downward trending graphs, magnifying glass analysis, broken server, report documents, and gear with bar chart, used for business and finance visuals. Generative AI
Free with trial Black filled database icon with minus symbol representing subtraction, reduction, or removal. Decrease performance vectors Database Remove Minus Icon. Black filled database icon with minus symbol representing subtraction, reduction, or removal. Black filled database icon with minus symbol representing subtraction, reduction, or removal.
Free with trial A person's hands gently cradle a vibrant, dynamic data visualization generated by AI. The image showcases interconnected nodes and lines, forming a complex yet aesthetically pleasing network. This represents the power of AI in data analysis and presentation. Decrease performance illustrations AI-Generated Data Visualization. A person's hands gently cradle a vibrant, dynamic data visualization generated by AI. The image showcases interconnected nodes and lines, forming a complex yet aesthetically pleasing network. This represents the power of AI in data analysis and presentation.
Free with trial Downward trend bar chart with red arrow icon. Financial loss, decline, or economic crisis symbol vector. Decrease performance vectors Downward trend bar chart with red arrow icon. Financial loss, decline, or economic crisis symbol
Free with trial Up and down graph icon on black circle. Outline bar chart with uptrend and downtrend arrow symbol vector. Decrease performance vectors Up and down graph icon on black circle. Outline bar chart with uptrend and downtrend arrow symbol
Free with trial Decreasing Bar Chart with Arrow: Business Decline, Negative Trend, Financial Loss and Downturn. Decrease performance vectors Decreasing Bar Chart with Arrow: Business Decline, Negative Trend, Financial Loss and Downturn
Free with trial 3D icon representing business decline, downturn, and financial loss. Decrease performance illustrations 3D business growth down concept icon. 3D icon representing business decline, downturn, and financial loss
Free with trial Data visualization with red and green chart on a wall display ,Generative ai. Decrease performance illustrations Dynamic data visualization, red and green chart analysis on wall display. Data visualization with red and green chart on a wall display ,Generative ai
Free with trial Line Graph Trend Analysis Line And Solid Icon Set. Data Visualization, Business Growth, Statistical Analysis Symbol Collection. Financial And Market Insights. Isolated Vector Illustration. Decrease performance vectors Line Graph Trend Analysis Line And Solid Icon Set. Data Visualization, Business Growth, Statistical Analysis Symbol
Free with trial This image showcases a dynamic graph, generated by AI, illustrating fluctuating data patterns. The abstract, wave-like design creates a visually engaging representation of complex information, perfect for presentations or reports needing a modern aesthetic. Its cool blue tones evoke a sense of calm. Decrease performance illustrations Abstract Data Visualization. This image showcases a dynamic graph, generated by AI, illustrating fluctuating data patterns. The abstract, wave-like design creates a visually engaging representation of complex information, perfect for presentations or reports needing a modern aesthetic. Its cool blue tones evoke a sense of calm
Free with trial An upward trending bar graph displayed on a laptop screen, illuminated against a backdrop of blurred city lights at night. Shows financial success and progress. Decrease performance illustrations Financial Growth Chart on Laptop Screen at Night. An upward trending bar graph displayed on a laptop screen, illuminated against a backdrop of blurred city lights at night. Shows financial success and progress.
Free with trial Analyze Data with Colorful Graph and Notes for Business Planning Strategy , layered depth. Decrease performance illustrations Analyze Data with Colorful Graph and Notes for Business Planning Strategy
Free with trial A graph showing a downward trend on a grid background. 3D Rendering. Decrease performance illustrations Declining stock market trend illustration. 3D Rendering. A graph showing a downward trend on a grid background. 3D Rendering