Free with trial This minimalist graphic illustration features a bold red line chart trending downwards against a clean background. Several small downward-pointing arrows are positioned along the slope to emphasize the decline. The composition uses a flat design aesthetic with high contrast, conveying a clear message of loss, reduction, or negative performance in a professional context. Decrease statistics vectors A red line graph showing a sharp downward trend with multiple directional arrows. This minimalist graphic illustration features a bold red line chart trending downwards against a clean background. Several small downward-pointing arrows are positioned along the slope to emphasize the decline. The composition uses a flat design aesthetic with high contrast, conveying a clear message of loss, reduction, or negative performance in a professional context
Free with trial Simple Bar Chart Showing Business Growth and Data Trends. Decrease statistics vectors Simple Bar Chart Showing Business Growth and Data Trends
Free with trial 3d bar graph illustrating financial growth with upward green arrow and downward red arrows indicating trends. Decrease statistics vectors Bar graph rising with arrows showing increase decrease. 3d bar graph illustrating financial growth with upward green arrow and downward red arrows indicating trends
Free with trial 3D rendered pyramid chart with a pie chart overlay and data icons on a light background. Useful for infographics and business presentations. Decrease statistics illustrations 3d pyramid infographic with pie chart and data icons. 3D rendered pyramid chart with a pie chart overlay and data icons on a light background. Useful for. 3D rendered pyramid chart with a pie chart overlay and data icons on a light background. Useful for infographics and business presentations
Free with trial A three-dimensional funnel chart displaying segmented layers in a descending order, each filled with distinct color gradients ranging from purple at the top to green at the bottom. The chart is rendered with a pixelated or voxel-like texture, giving it a modern and digital aesthetic. The funnel shape visually represents stages or proportions in a process, emphasizing a decreasing volume as it. Decrease statistics illustrations Vibrant 3d funnel chart with layered color gradients. A three-dimensional funnel chart displaying segmented layers in a descending order, each filled with distinct color gradients ranging from purple at the top to green at the bottom. The chart is rendered with a pixelated or voxel-like texture, giving it a modern and digital aesthetic. The funnel shape visually represents stages or proportions in a process, emphasizing a decreasing volume as it
Free with trial A set of sixteen modern line icons depicting various business and finance concepts, including graphs, charts, planning, ideas, and global connectivity. Perfect for presentations, reports, and websites. Decrease statistics vectors Collection of Business and Finance Line Icons Set. A set of sixteen modern line icons depicting various business and finance concepts, including graphs, charts, planning, ideas, and global connectivity. Perfect for presentations, reports, and websites.
Free with trial A large, three-dimensional pink percentage symbol is prominently displayed against a plain, light-colored background. The symbol appears to be made of a glossy, plastic-like material, giving it a shiny and reflective appearance. Decrease statistics illustrations Large pink percentage symbol on a plain background. A large, three-dimensional pink percentage symbol is prominently displayed against a plain, light-colored background. The symbol appears to be made of a glossy, plastic-like material, giving it a shiny and reflective appearance
Free with trial A minimalist line icon depicting strategic analysis. Decrease statistics illustrations Strategic Analysis Knight, Graph, Magnifying Glass Icon. A minimalist line icon depicting strategic analysis.
Free with trial This minimalist vector illustration depicts a downward trending line graph alongside a bar chart that appears to be shattering or breaking apart. The color palette utilizes high-contrast red and dark gray tones to emphasize a sense of urgency and economic instability. The clean lines and geometric shapes create a professional yet dramatic visual representation of loss, failure, or market. Decrease statistics vectors A red line graph shows a sharp decline in performance and financial market value. This minimalist vector illustration depicts a downward trending line graph alongside a bar chart that appears to be shattering or breaking apart. The color palette utilizes high-contrast red and dark gray tones to emphasize a sense of urgency and economic instability. The clean lines and geometric shapes create a professional yet dramatic visual representation of loss, failure, or market
Free with trial Businessman in suit analyzing market growth on digital screen isolated on transparent background. Decrease statistics illustrations Businessman Analyzing Market Growth on Digital Screen. Businessman in suit analyzing market growth on digital screen isolated on transparent background
Free with trial Declining business graph on computer monitor screen icon design. Decrease statistics illustrations Declining business graph on computer monitor screen icon
Free with trial The image depicts two bar graphs side by side. The left graph shows an upward trend with green bars increasing in height from left to right, accompanied by a green upward arrow, and is labeled 'Growth. ' The right graph shows a downward trend with red bars decreasing in height from left to right, accompanied by a red downward arrow, and is labeled 'Decline. ' The visual effectively contrasts the. Decrease statistics illustrations Illustrative comparison of growth and decline trends. The image depicts two bar graphs side by side. The left graph shows an upward trend with green bars increasing in height from left to right, accompanied by a green upward arrow, and is labeled 'Growth.' The right graph shows a downward trend with red bars decreasing in height from left to right, accompanied by a red downward arrow, and is labeled 'Decline.' The visual effectively contrasts the
Free with trial A person's hands using a calculator with a red downward trending arrow and the word COST superimposed on a blurred office background. Decrease statistics illustrations Person calculating cost reduction with red down arrow. A person's hands using a calculator with a red downward trending arrow and the word COST superimposed on a blurred office background
Free with trial A stark red downward arrow dominates this compelling graphic, set against a pristine white background. This impactful 3D render visualizes a decreasing trend, effectively representing economic downturns and financial losses. The image's concise nature makes it ideal for illustrating negative market performance, business losses, or budget reduction. Use this conceptual illustration to depict. Decrease statistics illustrations Declining trend represented by a red arrow on a white background depicting economic downturn or financial losses. A stark red downward arrow dominates this compelling graphic, set against a pristine white background. This impactful 3D render visualizes a decreasing trend, effectively representing economic downturns and financial losses. The image's concise nature makes it ideal for illustrating negative market performance, business losses, or budget reduction. Use this conceptual illustration to depict
Free with trial A simple icon showing a line graph with a zigzag pattern trending upwards to the right, indicating positive growth or increase. Below the graph, a straight-lined arrow points upward, reinforcing the sense of rising trend. The entire illustration is enclosed within a circle, suggesting focus on graphs or analytics. The design uses clean, black lines on a white background for a clear, minimalist appearance. Decrease statistics vectors Market Loss Analysis and Negative Trend Graph Icon. A simple icon showing a line graph with a zigzag pattern trending upwards to the right, indicating positive growth or increase. Below the graph, a straight-lined arrow points upward, reinforcing the sense of rising trend. The entire illustration is enclosed within a circle, suggesting focus on graphs or analytics. The design uses clean, black lines on a white background for a clear, minimalist appearance.
Free with trial A 3D rendered icon depicting a downward trend graph is presented on a black circular background with a polished gold rim. The graph features golden bars of decreasing height and a golden line graph with a downward-pointing arrow, clearly illustrating a decline. The entire icon is isolated on a white background, emphasizing its metallic gold and black elements. Decrease statistics illustrations Gold Downward Trend Graph Icon on Black Circle with Gold Rim on White Background chart. A 3D rendered icon depicting a downward trend graph is presented on a black circular background with a polished gold rim. The graph features golden bars of decreasing height and a golden line graph with a downward-pointing arrow, clearly illustrating a decline. The entire icon is isolated on a white background, emphasizing its metallic gold and black elements
Free with trial A comprehensive set of monochromatic icons representing various financial and statistical growth metrics. The icons include bar graphs, line charts, pie charts, and other graphical representations of data. Some icons depict upward trends, stability, percentages, and financial symbols such as dollar signs and coins. The overall theme is focused on financial analysis, economic growth, and data. Decrease statistics illustrations Collection of financial and statistical growth icons. A comprehensive set of monochromatic icons representing various financial and statistical growth metrics. The icons include bar graphs, line charts, pie charts, and other graphical representations of data. Some icons depict upward trends, stability, percentages, and financial symbols such as dollar signs and coins. The overall theme is focused on financial analysis, economic growth, and data
Free with trial Financial graphs and charts with red and white design elements, displayed on an isolated white background. Concept of declining business performance. 3D Rendering. Decrease statistics illustrations Financial graphs and charts showing a decline in performance. 3D Rendering. Financial graphs and charts with red and white design elements, displayed on an isolated white background. Concept of declining business performance. 3D Rendering
Free with trial This image displays two distinct charts illustrating annual revenue performance over quarters. The left chart features a line graph with shaded areas, showing trends and cumulative revenue. The right chart presents a bar graph with stacked segments, offering a clear comparison of revenue contributions across different quarters. Both charts use a clean, modern design with blue, green, and gray color palettes, suitable for business presentations, financial reports, and data visualization. Decrease statistics illustrations Annual Revenue Performance Charts: Line and Bar Graphs. This image displays two distinct charts illustrating annual revenue performance over quarters. The left chart features a line graph with shaded areas, showing trends and cumulative revenue. The right chart presents a bar graph with stacked segments, offering a clear comparison of revenue contributions across different quarters. Both charts use a clean, modern design with blue, green, and gray color palettes, suitable for business presentations, financial reports, and data visualization.
Free with trial 3D yellow arrow pointing downward featuring a percent symbol in white on a plain background. Decrease statistics illustrations Yellow percentage down arrow icon with percent symbol. 3D yellow arrow pointing downward featuring a percent symbol in white on a plain background
Free with trial Depiction of a fluctuating red market graph displayed over a dark digital backdrop with house icons. The visualization suggests property value changes over time The image is. Decrease statistics illustrations Housing market graph showing an upward trending property value chart. Depiction of a fluctuating red market graph displayed over a dark digital backdrop with house icons. The visualization suggests property value changes over time The image is
Free with trial A black jagged line graph with sharp peaks that descends sharply to a horizontal line. Decrease statistics illustrations Black Jagged Line Graph Descending Sharply chart data. A black jagged line graph with sharp peaks that descends sharply to a horizontal line
Free with trial A striking, three-dimensional number '7' is prominently displayed against a dark, gradient background. The numeral is rendered in a clean, modern style with sharp edges and a subtle highlight, suggesting depth and volume. The lighting creates a dramatic effect, with shadows cast on the background, emphasizing the numeral's presence. This image is ideal for concepts related to numbers, counting, achievements, rankings, or any context where the number seven holds significance. Decrease statistics illustrations Bold Number 7 Illuminated on Dark Gradient Background. A striking, three-dimensional number '7' is prominently displayed against a dark, gradient background. The numeral is rendered in a clean, modern style with sharp edges and a subtle highlight, suggesting depth and volume. The lighting creates a dramatic effect, with shadows cast on the background, emphasizing the numeral's presence. This image is ideal for concepts related to numbers, counting, achievements, rankings, or any context where the number seven holds significance.
Free with trial A bar graph illustrating a decline in values with an orange downward arrow indicating loss. Decrease statistics illustrations Graph showing decline and loss with orange bars and arrow. A bar graph illustrating a decline in values with an orange downward arrow indicating loss
Free with trial A three-dimensional gray percentage symbol rendered with a clean, modern aesthetic, casting a subtle shadow on a pure white background, perfect for financial or promotional content. Decrease statistics illustrations A gray percentage symbol isolated on white background. A three-dimensional gray percentage symbol rendered with a clean, modern aesthetic, casting a subtle shadow on a pure white background, perfect for financial or promotional content
Free with trial A collection of eight black silhouette representing various business analytics charts, including bar graphs, pie charts, and line graphs, against a white background. Decrease statistics vectors Set of black silhouette for business analytics charts. A collection of eight black silhouette representing various business analytics charts, including bar graphs, pie charts, and line graphs, against a white background
Free with trial This image depicts a hand-drawn or sketched line graph illustrating a general upward trend with significant fluctuations and sharp peaks. The graph shows a series of rapid increases and decreases, indicating volatility in the data, but overall points to a positive growth trajectory. The peaks are pronounced, suggesting periods of high activity or spikes in whatever variable is being measured. Decrease statistics illustrations Spiking upward trend line graph with volatility peaks. This image depicts a hand-drawn or sketched line graph illustrating a general upward trend with significant fluctuations and sharp peaks. The graph shows a series of rapid increases and decreases, indicating volatility in the data, but overall points to a positive growth trajectory. The peaks are pronounced, suggesting periods of high activity or spikes in whatever variable is being measured
Free with trial A 3D bar chart illustrates a significant downward trend in data, emphasized by a bold red arrow pointing downwards. Decrease statistics illustrations Bar chart showing declining trend with downward arrow. A 3D bar chart illustrates a significant downward trend in data, emphasized by a bold red arrow pointing downwards
Free with trial An illustrated lighthouse stands on the right side of the image, symbolizing guidance and hope, with a detailed compass in the foreground pointing toward the horizon, its arrow aligned upward, suggesting progress and purpose, while on the left, a downward-trending line graph visually represents a decrease in cancer diagnoses, conveying medical advancement and positive health outcomes, all set. Decrease statistics illustrations Lighthouse and compass symbolizing hope and direction with declining cancer diagnosis graph under a sunset sky. An illustrated lighthouse stands on the right side of the image, symbolizing guidance and hope, with a detailed compass in the foreground pointing toward the horizon, its arrow aligned upward, suggesting progress and purpose, while on the left, a downward-trending line graph visually represents a decrease in cancer diagnoses, conveying medical advancement and positive health outcomes, all set
Free with trial A simple blue line graph with circular data points is displayed against a clean white background with subtle horizontal grid lines. The graph shows fluctuations and trends, making it suitable for representing data, analytics, or financial performance. Generated by AI. Decrease statistics vectors Blue Line Graph with Data Points on White Background. A simple blue line graph with circular data points is displayed against a clean white background with subtle horizontal grid lines. The graph shows fluctuations and trends, making it suitable for representing data, analytics, or financial performance. Generated by AI
Free with trial This vibrant 3D rendering showcases an ascending bar chart, featuring colorful cylinders and a rising line graph, all set against a clean white backdrop. Ideal for presentations, reports, or marketing materials to visually represent growth, progress, and success. Decrease statistics illustrations Ascending Colorful 3D Bar Chart with Growth Line on Pink Platform. This vibrant 3D rendering showcases an ascending bar chart, featuring colorful cylinders and a rising line graph, all set against a clean white backdrop. Ideal for presentations, reports, or marketing materials to visually represent growth, progress, and success.
Free with trial Two distinct green, pixelated arrows are presented vertically on a white background. The top arrow points upwards, constructed from stacked cubes, while the bottom arrow points downwards, also formed from a pixelated cube structure. The arrows are identical in style and color, representing opposing directions or concepts. Decrease statistics illustrations Two Green Pixelated Arrows Pointing Up and Down on White Background image photo. Two distinct green, pixelated arrows are presented vertically on a white background. The top arrow points upwards, constructed from stacked cubes, while the bottom arrow points downwards, also formed from a pixelated cube structure. The arrows are identical in style and color, representing opposing directions or concepts
Free with trial Abstract Black White Up Down Arrows Growth Chart Business Infographic Design. Generative AI. Decrease statistics illustrations Abstract Black White Up Down Arrows Growth Chart Business Infographic Design
Free with trial A flat style pie chart displays market shares in teal, green, and yellow, with a dollar coin icon representing financial data. Decrease statistics vectors Flat design pie chart illustration representing business finance and market share analysis. A flat style pie chart displays market shares in teal, green, and yellow, with a dollar coin icon representing financial data.
Free with trial This image features a series of red downward arrows, each containing a percentage symbol. The arrows are evenly spaced and all point downward, indicating a consistent direction. Decrease statistics illustrations Series of red downward arrows with percentage symbols. This image features a series of red downward arrows, each containing a percentage symbol. The arrows are evenly spaced and all point downward, indicating a consistent direction
Free with trial A whiteboard on an easel displaying a red bar graph with a downward trend, indicated by a large red arrow. Decrease statistics illustrations A red graph on a whiteboard showing a downward trend. a whiteboard on an easel displaying a red bar graph with a downward trend, indicated by a large red arrow
Free with trial Red arrow pointing downwards over decreasing stacks of gold coins on a white background. Concept of financial loss, decline. 3D Rendering. Decrease statistics illustrations Red arrow descending over stacks of coins on white background. 3D Rendering. Red arrow pointing downwards over decreasing stacks of gold coins on a white background. Concept of financial loss, decline. 3D Rendering
Free with trial A stylized image depicts a magnifying glass focusing on a declining bar graph being passed from one hand to another. Decrease statistics illustrations Declining Market Analysis Magnifying Glass, Graph, Hands. A stylized image depicts a magnifying glass focusing on a declining bar graph being passed from one hand to another.
Free with trial A visual representation of a stock market crash, showing falling arrows and declining charts. Illustrates financial crisis, economic downturn, and investment loss. A symbolic depiction of recession. Decrease statistics illustrations Stock market crash financial crisis recession investment loss downward trend economic downturn chart analysis. A visual representation of a stock market crash, showing falling arrows and declining charts. Illustrates financial crisis, economic downturn, and investment loss. A symbolic depiction of recession.
Free with trial Financial Growth Represented by Coins and Dynamic Charts. Decrease statistics illustrations Financial Growth Represented by Coins and Dynamic Charts
Free with trial This image showcases vibrant 3D bar and pie charts illustrating upward trending business growth and financial success. Perfect for presentations or reports. Decrease statistics illustrations Colorful 3D Bar Charts and Pie Charts Showing Business Growth. This image showcases vibrant 3D bar and pie charts illustrating upward trending business growth and financial success. Perfect for presentations or reports.
Free with trial A three-dimensional, rounded white percentage symbol stands upright on a light gray surface. The symbol has a smooth, matte finish and is illuminated from the side, casting a soft shadow. The clean lines and simple form suggest a modern and abstract representation of financial or mathematical concepts. The image is a studio shot with consistent lighting. Decrease statistics illustrations 3D Rendering of a White Percentage Symbol on a Light Gray Background image photo. A three-dimensional, rounded white percentage symbol stands upright on a light gray surface. The symbol has a smooth, matte finish and is illuminated from the side, casting a soft shadow. The clean lines and simple form suggest a modern and abstract representation of financial or mathematical concepts. The image is a studio shot with consistent lighting
Free with trial The image displays a prominent percentage symbol in a teal or cyan shade against a plain white background. The design is simple and modern, focusing solely on the symbol without additional elements or text. Decrease statistics illustrations A teal percentage symbol on a white background isolated on white background. The image displays a prominent percentage symbol in a teal or cyan shade against a plain white background. The design is simple and modern, focusing solely on the symbol without additional elements or text
Free with trial Sharp downward trend line on graph red color rapid freefall business Ideal for websites and social media. Decrease statistics illustrations Sharp downward trend line on graph, red color, rapid, freefall, business. Sharp downward trend line on graph red color rapid freefall business Ideal for websites and social media
Free with trial Overlay stock market trading graph. overlay of a stock exchange screen with a strong uptrend, concept for successful investment strategy and economic growth. Decrease statistics illustrations Overlay stock market trading graph. colorful Japanese candlestick chart showing a bullish market breakout, financial trading graph. overlay stock market trading graph. overlay of a stock exchange screen with a strong uptrend, concept for successful investment strategy and economic growth
Free with trial Sharp downward sloping line graph red arrow pointing down background red Suitable for digital platforms. Decrease statistics illustrations Sharp downward sloping line graph, red arrow pointing down, background, red. Sharp downward sloping line graph red arrow pointing down background red Suitable for digital platforms
Free with trial An detailed line art illustration of a dog bone stylized as a diagonal downward arrow, representing negative trends or decline. Decrease statistics vectors Dog bone shaped as a downward arrow indicating decline. An detailed line art illustration of a dog bone stylized as a diagonal downward arrow, representing negative trends or decline
Free with trial A 3D render of a red thermometer with a white liquid column indicating a low temperature, positioned next to a blue square icon featuring three white downward-pointing arrows. The objects are isolated on a clean white background, suggesting a concept of decreasing temperature or a negative trend. Decrease statistics illustrations Red Thermometer Icon With Down Arrow Symbol On White Background temperature cold. A 3D render of a red thermometer with a white liquid column indicating a low temperature, positioned next to a blue square icon featuring three white downward-pointing arrows. The objects are isolated on a clean white background, suggesting a concept of decreasing temperature or a negative trend
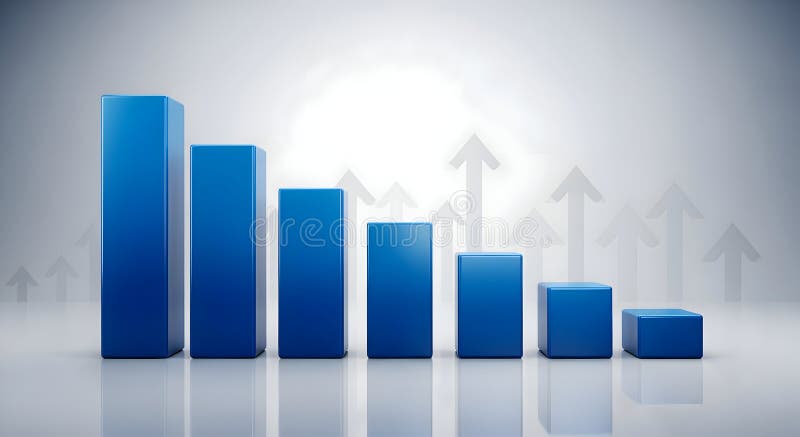
Free with trial A 3D render of a blue bar chart displaying a downward trend, with bars decreasing in height from left to right. The background features a subtle pattern of translucent upward-pointing arrows, suggesting growth or recovery despite the current decline. The scene is set against a clean, gradient gray backdrop with reflections, creating a modern and professional aesthetic. This image is ideal for representing financial downturns, market analysis, economic challenges, or the concept of overcoming obstacles. Decrease statistics illustrations Declining Blue Bar Chart with Upward Arrows Background. A 3D render of a blue bar chart displaying a downward trend, with bars decreasing in height from left to right. The background features a subtle pattern of translucent upward-pointing arrows, suggesting growth or recovery despite the current decline. The scene is set against a clean, gradient gray backdrop with reflections, creating a modern and professional aesthetic. This image is ideal for representing financial downturns, market analysis, economic challenges, or the concept of overcoming obstacles.
Free with trial This is a detailed line art illustration of a dog representing a financial crash or loss in trading. Decrease statistics vectors Shiba Inu looking sad while a market arrow points down. This is a detailed line art illustration of a dog representing a financial crash or loss in trading
Free with trial A digital bar chart displayed on a dark blue screen with a grid overlay. The bars are predominantly blue, with some white bars indicating significant spikes. The chart fluctuating data with reflections on the glossy surface below. Numbers and percentages are visible on the grid lines. Decrease statistics illustrations Blue digital bar chart with grid and reflections graph. A digital bar chart displayed on a dark blue screen with a grid overlay. The bars are predominantly blue, with some white bars indicating significant spikes. The chart fluctuating data with reflections on the glossy surface below. Numbers and percentages are visible on the grid lines
Free with trial A collection of nine flat vector icons for data visualization including bar graphs, line charts, pie charts, and performance meters isolated on a white background. Decrease statistics vectors Simple black data analysis and business chart icon set. A collection of nine flat vector icons for data visualization including bar graphs, line charts, pie charts, and performance meters isolated on a white background
Free with trial Two identical green 3D arrows are positioned vertically on a white background. Both arrows are pointing directly downwards. The top arrow is positioned above the bottom arrow, creating a sense of sequence or progression. The arrows have a smooth, rounded appearance and cast subtle shadows. Decrease statistics illustrations Two Green 3D Arrows Pointing Downward on a White Background down arrow direction. Two identical green 3D arrows are positioned vertically on a white background. Both arrows are pointing directly downwards. The top arrow is positioned above the bottom arrow, creating a sense of sequence or progression. The arrows have a smooth, rounded appearance and cast subtle shadows
Free with trial Declining Bar Chart with Downward Trend Arrow Illustration. Decrease statistics vectors Declining Bar Chart with Downward Trend Arrow Illustration
Free with trial Simple line art business icons set featuring a magnifying glass, minus symbol, pie chart, and rising bar graph for financial data analysis. Decrease statistics illustrations Simple line art business icons set featuring a magnifying glass, minus symbol, pie chart, and rising bar graph for
Free with trial Bar chart with downward arrow icon vector. Financial crisis concept. Economy downturn and loss symbol in circular outline. Decrease statistics vectors Bar chart with downward arrow icon. Financial crisis concept. Economy downturn and loss symbol in circular outline
Free with trial Conceptual image depicting the decline of the music industry. Decrease statistics illustrations Music Industry Decline Magnifying Glass, Graph, Note Icon. Conceptual image depicting the decline of the music industry.
Free with trial A 3D illustration shows a red arrow graph descending sharply over a series of stacked white coins. The coins are arranged in decreasing height, visually representing a financial decline or loss. The composition is set against a clean white background. Decrease statistics illustrations A red arrow graph showing a downward trend over stacked white coins on a white background. A 3D illustration shows a red arrow graph descending sharply over a series of stacked white coins. The coins are arranged in decreasing height, visually representing a financial decline or loss. The composition is set against a clean white background
Free with trial Laptop displaying a bar chart indicating growth and analysis ,Generative ai. Decrease statistics illustrations Laptop with bar chart, visualizing growth, analysis, and business trends. Laptop displaying a bar chart indicating growth and analysis ,Generative ai
Free with trial A vector illustration depicting two interconnected chain links, rendered in a clean, modern black and white line art style with subtle grey shading. One link features a shopping cart icon containing a dollar sign and an upward arrow, symbolizing e-commerce, transactions, or price changes. The other link prominently displays a percentage symbol, representing discounts, sales, or financial rates. This graphic effectively conveys concepts related to online shopping promotions, affiliate marketing, retail analytics, and digital business strategies. Ideal for web design, apps, and marketing materials. Decrease statistics illustrations E-commerce Discount and Shopping Link Icon. A vector illustration depicting two interconnected chain links, rendered in a clean, modern black and white line art style with subtle grey shading. One link features a shopping cart icon containing a dollar sign and an upward arrow, symbolizing e-commerce, transactions, or price changes. The other link prominently displays a percentage symbol, representing discounts, sales, or financial rates. This graphic effectively conveys concepts related to online shopping promotions, affiliate marketing, retail analytics, and digital business strategies. Ideal for web design, apps, and marketing materials.
Free with trial Stock market graph with red candlesticks and downward arrow, displayed on a light background. Concept of economic decline. 3D Rendering. Decrease statistics illustrations Financial stock market graph with downward trend and arrow on light background. 3D Rendering. Stock market graph with red candlesticks and downward arrow, displayed on a light background. Concept of economic decline. 3D Rendering
Free with trial Smartphone with Downward Arrow Financial Decline Concept, illustration. Decrease statistics vectors Smartphone with Downward Arrow Financial Decline Concept
Free with trial A sleek, 3D rendered bar chart made of translucent blue glass illustrates a significant downward trend. The descending steps represent a decline in profits, a market downturn, or negative business results, symbolizing financial challenges and the need for strategic re-evaluation. The clean, minimalist design focuses attention on the datas story of loss and regression. Decrease statistics illustrations Blue Glass Bar Chart Showing a Downward Trend. A sleek, 3D rendered bar chart made of translucent blue glass illustrates a significant downward trend. The descending steps represent a decline in profits, a market downturn, or negative business results, symbolizing financial challenges and the need for strategic re-evaluation. The clean, minimalist design focuses attention on the datas story of loss and regression
Free with trial A decreasing chart with a downward-pointing arrow, isolated on a white background, symbolizing financial loss or decline. Decrease statistics illustrations Decreasing chart with arrow isolated on white background. A decreasing chart with a downward-pointing arrow, isolated on a white background, symbolizing financial loss or decline
Free with trial This illustration, generated by AI, depicts a modern workspace with a computer displaying financial charts and graphs, surrounded by icons representing money, calculations, and productivity. It symbolizes financial analysis and data-driven decision-making. Decrease statistics illustrations AI-Generated Financial Data Visualization. This illustration, generated by AI, depicts a modern workspace with a computer displaying financial charts and graphs, surrounded by icons representing money, calculations, and productivity. It symbolizes financial analysis and data-driven decision-making.
Free with trial The image depicts a bar graph on an easel with a prominent red downward arrow overlaying it. The bars in the graph show a decreasing trend from left to right, indicating a decline in values. The background is plain and gray, focusing attention on the graph and the red arrow. Decrease statistics illustrations Downward trend in bar graph with a prominent red arrow. The image depicts a bar graph on an easel with a prominent red downward arrow overlaying it. The bars in the graph show a decreasing trend from left to right, indicating a decline in values. The background is plain and gray, focusing attention on the graph and the red arrow
Free with trial This image displays a large, bold percentage symbol rendered in a three-dimensional style with shading effects to give it depth and a tactile appearance. The design emphasizes the symbol's curves and angles, making it visually striking and suitable for financial, statistical, or promotional contexts. Decrease statistics illustrations Large percentage symbol in bold three-dimensional style. This image displays a large, bold percentage symbol rendered in a three-dimensional style with shading effects to give it depth and a tactile appearance. The design emphasizes the symbol's curves and angles, making it visually striking and suitable for financial, statistical, or promotional contexts
Free with trial A dynamic black and white background pattern featuring a collection of hand-drawn financial and economic elements. The design includes various currency symbols like the Dollar, Euro, and Yen, alongside upward and downward arrows, zig-zag lines representing market volatility, and simple bar charts indicating growth or decline. Scattered ink splatters add a grunge, artistic touch to the overall composition. This versatile illustration is ideal for conveying concepts related to global finance, business trends, investment, stock market fluctuations, economic data, and wealth management in a creative and engaging way. Decrease statistics vectors Hand Drawn Financial Market Elements Background Pattern. A dynamic black and white background pattern featuring a collection of hand-drawn financial and economic elements. The design includes various currency symbols like the Dollar, Euro, and Yen, alongside upward and downward arrows, zig-zag lines representing market volatility, and simple bar charts indicating growth or decline. Scattered ink splatters add a grunge, artistic touch to the overall composition. This versatile illustration is ideal for conveying concepts related to global finance, business trends, investment, stock market fluctuations, economic data, and wealth management in a creative and engaging way.
Free with trial A dramatic visualization of a financial market downturn featuring falling red candlestick charts and line graphs on a dark high-tech background with digital glitch elements. Decrease statistics illustrations Red Stock Market Crash Chart with Digital Glitch Effect. A dramatic visualization of a financial market downturn featuring falling red candlestick charts and line graphs on a dark high-tech background with digital glitch elements
Free with trial A dramatic image of an oil barrel with a declining graph, symbolizing the economic downturn and financial struggles in the energy industry. The dark background and contrasting light highlight the seriousness of the situation, making it a powerful editorial illustration. Decrease statistics illustrations An oil barrel with a declining graph on a dark background. A dramatic image of an oil barrel with a declining graph, symbolizing the economic downturn and financial struggles in the energy industry. The dark background and contrasting light highlight the seriousness of the situation, making it a powerful editorial illustration
Free with trial The image displays two percentage symbols, one red with the word 'decline' beneath it and another green with the word 'growth' beneath it. The red symbol is crossed out, indicating a negative trend, while the green symbol has a check mark, indicating a positive trend. The design is simple and visually contrasts decline and growth concepts. Decrease statistics vectors Percentage indicators showing decline and growth trends. The image displays two percentage symbols, one red with the word 'decline' beneath it and another green with the word 'growth' beneath it. The red symbol is crossed out, indicating a negative trend, while the green symbol has a check mark, indicating a positive trend. The design is simple and visually contrasts decline and growth concepts
Free with trial A 3D rendered image of a solid, light purple arrow pointing directly downwards. The arrow has a smooth, matte finish and is positioned on a plain, light purple background. The lighting creates a subtle shadow beneath the arrow, giving it a sense of depth. Decrease statistics illustrations 3D rendered light purple arrow pointing downwards on a plain background direction. A 3D rendered image of a solid, light purple arrow pointing directly downwards. The arrow has a smooth, matte finish and is positioned on a plain, light purple background. The lighting creates a subtle shadow beneath the arrow, giving it a sense of depth
Free with trial A golden icon depicting a downward trending bar graph with a sharp arrow indicating a decline. The graph and arrow are set against a black circular background, which is framed by a polished gold rim. The icon is presented in a 3D perspective on a white background. Decrease statistics illustrations Golden Downward Trend Graph Icon with Arrow on Black Circular Background with Gold Rim. A golden icon depicting a downward trending bar graph with a sharp arrow indicating a decline. The graph and arrow are set against a black circular background, which is framed by a polished gold rim. The icon is presented in a 3D perspective on a white background
Free with trial A close-up view of a golden percentage symbol, composed of two zeros, set against a plain white background. Decrease statistics illustrations Golden percentage symbol set against a white background. A close-up view of a golden percentage symbol, composed of two zeros, set against a plain white background
Free with trial Modern, minimalistic chart icon for business and finance. Decrease statistics vectors Modern, minimalistic chart icon for business and finance
Free with trial Bar chart and line graph showing financial data and trends. Generative AI. Decrease statistics illustrations Bar chart and line graph showing financial data and trends
Free with trial A dynamic 3D visualization of financial data, featuring an upward trending blue arrow graph, a series of white and blue bar graphs, and two pie charts. The composition is set against a dark blue, grid-like background, symbolizing data analysis, business growth, and financial success. This image is ideal for presentations, reports, and websites related to finance, economics, and market trends. Decrease statistics illustrations 3D Financial Growth Chart with Pie Charts and Bar Graph. A dynamic 3D visualization of financial data, featuring an upward trending blue arrow graph, a series of white and blue bar graphs, and two pie charts. The composition is set against a dark blue, grid-like background, symbolizing data analysis, business growth, and financial success. This image is ideal for presentations, reports, and websites related to finance, economics, and market trends.
Free with trial This is an isometric 3D illustration depicting a dynamic data visualization. It features a combination of bar charts and a line graph, showcasing rising trends and fluctuating data points. The color palette includes shades of blue, teal, and coral, creating a modern and professional aesthetic. This graphic is ideal for representing financial reports, business analytics, market trends, growth, and performance metrics in a visually engaging and easy-to-understand format. Decrease statistics illustrations Isometric 3D Bar and Line Graph with Data Visualization. This is an isometric 3D illustration depicting a dynamic data visualization. It features a combination of bar charts and a line graph, showcasing rising trends and fluctuating data points. The color palette includes shades of blue, teal, and coral, creating a modern and professional aesthetic. This graphic is ideal for representing financial reports, business analytics, market trends, growth, and performance metrics in a visually engaging and easy-to-understand format.
Free with trial Conceptual image depicting declining sales and the need for analysis. Decrease statistics illustrations Declining Sales Analysis Magnifying Glass, Chart, Calendar. Conceptual image depicting declining sales and the need for analysis.