Free with trial A striking 3D render features a bold red arrow, sharply angled downwards, positioned on a textured wooden surface. The arrow's zigzag path suggests a dynamic decline, making it a powerful visual metaphor for financial downturns, market crashes, or negative trends. The warm tones of the wood contrast with the vibrant red, creating a visually engaging composition. This image is ideal for illustrating concepts related to economic recession, business failure, loss, or any situation involving a downward trajectory. Decrease statistics illustrations Red Arrow Pointing Downward on Wooden Background. A striking 3D render features a bold red arrow, sharply angled downwards, positioned on a textured wooden surface. The arrow's zigzag path suggests a dynamic decline, making it a powerful visual metaphor for financial downturns, market crashes, or negative trends. The warm tones of the wood contrast with the vibrant red, creating a visually engaging composition. This image is ideal for illustrating concepts related to economic recession, business failure, loss, or any situation involving a downward trajectory.
Free with trial A visual representation of financial decline. Stacks of coins are overlaid with a red downtrend graph, suggesting economic downturn. The world map background adds a global context. The composition uses a shallow depth of field. Decrease statistics illustrations Stacks of Coins with Downtrend Graph Overlay, Financial Crisis Concept. A visual representation of financial decline. Stacks of coins are overlaid with a red downtrend graph, suggesting economic downturn. The world map background adds a global context. The composition uses a shallow depth of field
Free with trial A 3D rendered icon of a bar chart with four ascending bars. The bars are a deep blue color and are heavily covered in realistic ice and snow, dripping from the tops. The chart is framed by metallic gray and dark gray. The icon is presented on a white background. Decrease statistics illustrations 3D Bar Chart Icon With Blue Bars Covered in Ice and Snow. A 3D rendered icon of a bar chart with four ascending bars. The bars are a deep blue color and are heavily covered in realistic ice and snow, dripping from the tops. The chart is framed by metallic gray and dark gray. The icon is presented on a white background
Free with trial Modern, minimalistic chart icon for business and finance. Decrease statistics illustrations Modern, minimalistic chart icon for business and finance
Free with trial Graph line icon. Continuous line with share plane. Column chart sign. Growth diagram symbol. 3d heart in speech bubble. Graph chart single line ribbon. Loop curve pattern. Vector. Decrease statistics vectors Graph line icon. Column chart sign. Continuous line with plane. Vector. Graph line icon. Continuous line with share plane. Column chart sign. Growth diagram symbol. 3d heart in speech bubble. Graph chart single line ribbon. Loop curve pattern. Vector
Free with trial Flat design business icons depict various charts, percentage signs, targets, hierarchical diagrams, and coin stacks representing financial growth and data analysis in monochrome. Generative AI. Decrease statistics vectors Black and white flat design business icons including charts percentage target and money stacks illustrating financial growth and. Flat design business icons depict various charts, percentage signs, targets, hierarchical diagrams, and coin stacks representing financial growth and data analysis in monochrome. Generative AI
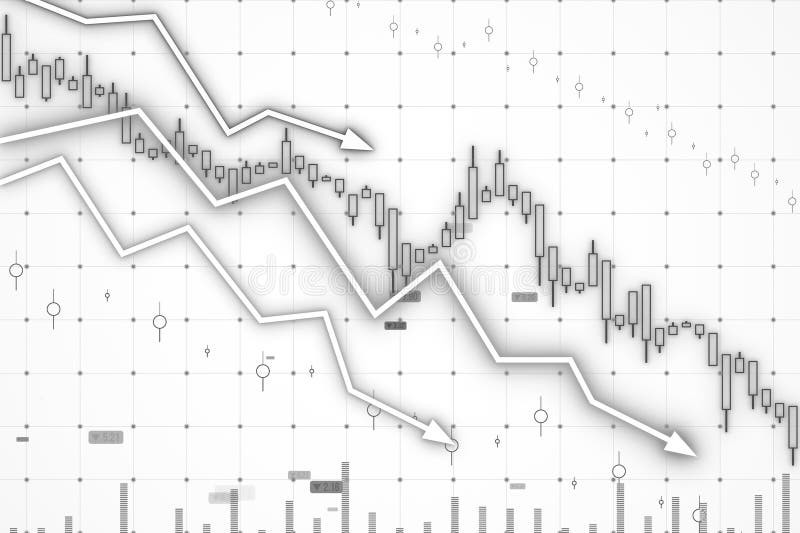
Free with trial Red line graph shows a sharp stock market decline. Economic downturn visualized. Decrease statistics illustrations Stock Market Decline: A Visual Representation of Economic Downturn. Red line graph shows a sharp stock market decline. Economic downturn visualized
Free with trial This image represents a financial crisis with a downward trend and a broken surface. Decrease statistics illustrations Economic downturn concept with a red graph and a blue arrow pointing down. This image represents a financial crisis with a downward trend and a broken surface
Free with trial 3D Rendering of world map with red downward arrows and stock chart on blue background, symbolizing global financial crisis and market collapse. Decrease statistics illustrations Global financial crisis concept with world map and falling stock market chart. 3D Rendering. 3D Rendering of world map with red downward arrows and stock chart on blue background, symbolizing global financial crisis and market collapse
Free with trial A stack of coins rests on a financial chart showing a downward trend. This image, generated by AI, visually represents economic fluctuations and market instability. The dark coins emphasize the seriousness of the financial situation depicted by the graph. Decrease statistics illustrations Financial Market Trends. A stack of coins rests on a financial chart showing a downward trend. This image, generated by AI, visually represents economic fluctuations and market instability. The dark coins emphasize the seriousness of the financial situation depicted by the graph.
Free with trial This image showcases a person using a tablet to interact with business analytics data, generated by AI. The visualization includes graphs and charts, providing real-time insights into key performance indicators. This technology streamlines business decision-making. Decrease statistics illustrations AI-Powered Business Analytics. This image showcases a person using a tablet to interact with business analytics data, generated by AI. The visualization includes graphs and charts, providing real-time insights into key performance indicators. This technology streamlines business decision-making.
Free with trial A conceptual illustration of digital currency coins with a financial candlestick chart in the background, representing cryptocurrency market fluctuations and investment trends. Decrease statistics vectors Digital currency coins on financial stock market candlestick chart showing trading trends and investment growth. a conceptual illustration of digital currency coins with a financial candlestick chart in the background, representing cryptocurrency market fluctuations and investment trends
Free with trial This image shows a downward-trending red arrow graph, generated by AI, illustrating a significant decline. The visual representation is clear and effective in communicating a negative trend, potentially in stock prices, sales figures, or other quantifiable data. Decrease statistics illustrations Downward Trending Graph. This image shows a downward-trending red arrow graph, generated by AI, illustrating a significant decline. The visual representation is clear and effective in communicating a negative trend, potentially in stock prices, sales figures, or other quantifiable data.
Free with trial Displaying green fluctuating data line moving across dashboard grid overlay, with red area graph. Financial, analytics, dashboard, data, technology, investment, digital. Decrease statistics illustrations Displaying green fluctuating data line moving across dashboard grid overlay, with red area graph
Free with trial A light teal-colored baby carriages aligned in falling chart with red arrow pointing down. Decrease statistics illustrations A light teal-colored baby carriages aligned in falling chart with red arrow pointing down
Free with trial This isometric illustration shows a delicious breakfast plate alongside a stock market graph, representing the connection between food trends and market data. The visual, generated by AI, is perfect for illustrating articles about food market analysis or investment opportunities in the food industr. Decrease statistics illustrations Breakfast Market Trends. This isometric illustration shows a delicious breakfast plate alongside a stock market graph, representing the connection between food trends and market data. The visual, generated by AI, is perfect for illustrating articles about food market analysis or investment opportunities in the food industr
Free with trial A cartoon illustration of a man interacting with a bar chart. The man is depicted in a simple, clean style, wearing a blue shirt and brown pants. He is holding a green bar, seemingly adjusting or interacting with the colorful bars displayed on a table. The illustration is suitable for conveying concepts related to data analysis, business, finance, and presentation. Decrease statistics illustrations Cartoon Man and Bar Chart. A cartoon illustration of a man interacting with a bar chart. The man is depicted in a simple, clean style, wearing a blue shirt and brown pants. He is holding a green bar, seemingly adjusting or interacting with the colorful bars displayed on a table. The illustration is suitable for conveying concepts related to data analysis, business, finance, and presentation.
Free with trial Business decline and economic recession concept with a falling bar graph and a downward red arrow. Decrease statistics vectors Business decline and economic recession concept with a falling bar graph and a downward red arrow
Free with trial Blue graphs and charts depicting financial analysis and market trends with fountain pen. Decrease statistics illustrations Blue graphs and charts depicting financial analysis and market trends with
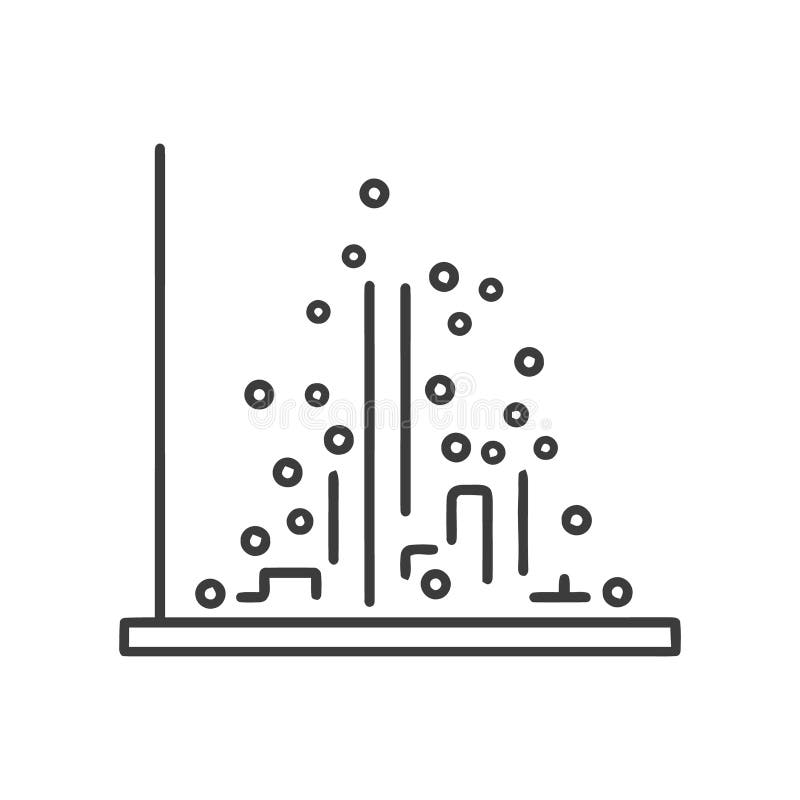
Free with trial Description: Simple line art illustration of a scatter plot graph showing an uneven distribution of data points. Perfect for presentations or reports. Decrease statistics vectors Abstract Data Visualization: Scatter Plot Chart with Irregular Data Points. Description: Simple line art illustration of a scatter plot graph showing an uneven distribution of data points. Perfect for presentations or reports.
Free with trial A world map with a grid overlay, featuring two trend lines in blue and orange. The blue line starts high on the left sid. Decrease statistics illustrations Global Trend Analysis Map. A world map with a grid overlay, featuring two trend lines in blue and orange. The blue line starts high on the left sid.
Free with trial A bold line graph icon displays business data with trend analysis, featuring circles marking data points and horizontal lines indicating value levels. Decrease statistics vectors Bold Line Graph Icon: Business Data Visualization with Trend Analysis. A bold line graph icon displays business data with trend analysis, featuring circles marking data points and horizontal lines indicating value levels
Free with trial Two percentage symbols with one green upward arrow and one red downward arrow isolated on transparent background. Decrease statistics illustrations Percentage symbol with upward and downward arrows indicating growth and decline. Two percentage symbols with one green upward arrow and one red downward arrow isolated on transparent background
Free with trial A visual representation of negative financial performance and economic downturn. This graphic depicts a sharp decline, indicating losses and a downward trend in market or business metrics. Decrease statistics vectors Red downward trending graph with arrow signifying financial decline and economic recession concept. A visual representation of negative financial performance and economic downturn. This graphic depicts a sharp decline, indicating losses and a downward trend in market or business metrics
Free with trial Photo of handwritten charts illustrating inflation and potential recession. Graphs show rising prices and economic downturn concerns. Financial crisis concept depicted with, business. Decrease statistics illustrations Photo of handwritten charts illustrating inflation and potential recession. Graphs show rising prices and economic downturn
Free with trial Business decline icon vector with downward arrow. Loss, failure, or economic crisis symbol with long shadow. Decrease statistics vectors Business decline icon with downward arrow. Loss, failure, or economic crisis symbol with long shadow
Free with trial Unemployment rate gauge shows the current economic climate with a red needle pointing towards a high rate indicating potential financial instability market downturn and job insecurity reflecting conc. Decrease statistics illustrations Unemployment rate gauge showing economic conditions with a red indicator needle pointing up. Unemployment rate gauge shows the current economic climate with a red needle pointing towards a high rate indicating potential financial instability market downturn and job insecurity reflecting conc
Free with trial Red bar graph with decreasing values. Generative AI. Decrease statistics illustrations Red bar graph with decreasing values
Free with trial Global economic downturn sketch falling arrows, documents around Earth business illustration. Decrease statistics illustrations Global Economy Sketch - World Globe with Growth and Decline Arrows. Global economic downturn sketch falling arrows, documents around Earth business illustration
Free with trial Arrows percent icons with up and down signs and percentage symbols featuring arrow, icon, symbol with up and graphics elements for illustrations. Decrease statistics vectors Arrows percent icons with up and down signs and percentage symbols featuring arrow
Free with trial Colorful blocks in decreasing order on a blue surface. Represents decline or recession in a vibrant, illustrative manner. Stock photo. Decrease statistics illustrations Colorful blocks in decreasing order on a blue surface. Represents decline or recession in a vibrant, illustrative manner
Free with trial A person's hands gently cradle a vibrant, dynamic data visualization generated by AI. The image showcases interconnected nodes and lines, forming a complex yet aesthetically pleasing network. This represents the power of AI in data analysis and presentation. Decrease statistics illustrations AI-Generated Data Visualization. A person's hands gently cradle a vibrant, dynamic data visualization generated by AI. The image showcases interconnected nodes and lines, forming a complex yet aesthetically pleasing network. This represents the power of AI in data analysis and presentation.
Free with trial Downward trend bar chart with red arrow icon. Financial loss, decline, or economic crisis symbol vector. Decrease statistics vectors Downward trend bar chart with red arrow icon. Financial loss, decline, or economic crisis symbol
Free with trial Stylized digital illustration showing a virtual coin with a declining market chart in the background. this image symbolizes financial risks, price fluctuations, and market volatility in the electronic currency sector. Decrease statistics vectors Digital illustration of a virtual currency coin with a falling market graph representing financial price volatility. stylized digital illustration showing a virtual coin with a declining market chart in the background. this image symbolizes financial risks, price fluctuations, and market volatility in the electronic currency sector
Free with trial This vibrant 3D rendering showcases a bar chart and pie chart, illustrating data growth and proportions. Ideal for presentations, reports, or educational materials. The colorful design makes it visually appealing and easy to understand. Decrease statistics illustrations Colorful 3D Bar Chart and Pie Chart Data Presentation. This vibrant 3D rendering showcases a bar chart and pie chart, illustrating data growth and proportions. Ideal for presentations, reports, or educational materials. The colorful design makes it visually appealing and easy to understand.
Free with trial A 3D rendered icon featuring a vibrant blue circular shape with a white percentage symbol prominently displayed in the center. The icon has a glossy finish and is presented on a white background, making it suitable for various digital and print applications related to finance, sales, and discounts. Decrease statistics illustrations Blue Circle With White Percentage Symbol 3D Icon sign. A 3D rendered icon featuring a vibrant blue circular shape with a white percentage symbol prominently displayed in the center. The icon has a glossy finish and is presented on a white background, making it suitable for various digital and print applications related to finance, sales, and discounts
Free with trial A digital line graph displays a sharp decline in interest rates, highlighting sudden market shifts and economic downturn trends. Decrease statistics illustrations A digital line graph displays a sharp decline in interest rates, highlighting sudden market shifts and economic downturn trends
Free with trial Data visualization with red and green chart on a wall display ,Generative ai. Decrease statistics illustrations Dynamic data visualization, red and green chart analysis on wall display. Data visualization with red and green chart on a wall display ,Generative ai
Free with trial This image displays a financial growth chart, featuring both a candlestick chart and a bar graph, laid out on a wooden surface. The candlestick chart illustrates stock market fluctuations with red and green candles, while the bar graph shows increasing values over time. The overall composition suggests positive financial trends, investment performance, and economic progress. It's ideal for representing concepts like business growth, market analysis, financial planning, and investment strategies. Decrease statistics illustrations Financial Growth Chart with Candlestick and Bar Graph. This image displays a financial growth chart, featuring both a candlestick chart and a bar graph, laid out on a wooden surface. The candlestick chart illustrates stock market fluctuations with red and green candles, while the bar graph shows increasing values over time. The overall composition suggests positive financial trends, investment performance, and economic progress. It's ideal for representing concepts like business growth, market analysis, financial planning, and investment strategies.
Free with trial Line Graph Trend Analysis Line And Solid Icon Set. Data Visualization, Business Growth, Statistical Analysis Symbol Collection. Financial And Market Insights. Isolated Vector Illustration. Decrease statistics vectors Line Graph Trend Analysis Line And Solid Icon Set. Data Visualization, Business Growth, Statistical Analysis Symbol
Free with trial Graph showing a line that is green and has a black background. The line is going up and to the right. Decrease statistics illustrations Graph showing a line that is green and has a black background
Free with trial Abstract 3D render of a descending bar chart made of blue glass rectangles. The bars are reflected on a glossy surface, creating a clean and modern aesthetic. The image can be used to represent data visualization, financial trends, business performance, or concepts like decline, recession, or negative growth. The cool blue color palette adds a sense of calm and professionalism. Decrease statistics illustrations Abstract Blue Glass Bar Chart. Abstract 3D render of a descending bar chart made of blue glass rectangles. The bars are reflected on a glossy surface, creating a clean and modern aesthetic. The image can be used to represent data visualization, financial trends, business performance, or concepts like decline, recession, or negative growth. The cool blue color palette adds a sense of calm and professionalism.
Free with trial This image showcases a dynamic graph, generated by AI, illustrating fluctuating data patterns. The abstract, wave-like design creates a visually engaging representation of complex information, perfect for presentations or reports needing a modern aesthetic. Its cool blue tones evoke a sense of calm. Decrease statistics illustrations Abstract Data Visualization. This image showcases a dynamic graph, generated by AI, illustrating fluctuating data patterns. The abstract, wave-like design creates a visually engaging representation of complex information, perfect for presentations or reports needing a modern aesthetic. Its cool blue tones evoke a sense of calm
Free with trial An upward trending bar graph displayed on a laptop screen, illuminated against a backdrop of blurred city lights at night. Shows financial success and progress. Decrease statistics illustrations Financial Growth Chart on Laptop Screen at Night. An upward trending bar graph displayed on a laptop screen, illuminated against a backdrop of blurred city lights at night. Shows financial success and progress.
Free with trial Analyze Data with Colorful Graph and Notes for Business Planning Strategy , layered depth. Decrease statistics illustrations Analyze Data with Colorful Graph and Notes for Business Planning Strategy
Free with trial A graph showing a downward trend on a grid background. 3D Rendering. Decrease statistics illustrations Declining stock market trend illustration. 3D Rendering. A graph showing a downward trend on a grid background. 3D Rendering
Free with trial Chart icon with descending bar graph, gear with cross, and downward arrow with dollar symbol, minimal black silhouette for finance loss and cost reduction concept. Decrease statistics vectors Chart icon with descending bar graph, gear with cross, and downward arrow with dollar symbol
Free with trial A blue-toned image depicting a stock market chart showing a significant downward trend. The chart features white candlestick patterns and moving averages, indicating a bearish market. Red and green bars at the bottom suggest trading volume. The image conveys concepts of financial loss, economic downturn, and investment risk. Decrease statistics illustrations Falling Stock Market Chart. A blue-toned image depicting a stock market chart showing a significant downward trend. The chart features white candlestick patterns and moving averages, indicating a bearish market. Red and green bars at the bottom suggest trading volume. The image conveys concepts of financial loss, economic downturn, and investment risk.
Free with trial A modern, clean isometric illustration showcasing various data visualizations. Multiple charts and graphs, including bar charts, line graphs, and pie charts, are displayed on floating screens, representing data analysis, business intelligence, or financial reporting. Ideal for presentations, reports, or website banners related to data-driven concepts. Decrease statistics illustrations Isometric 3D Data Visualization: Charts and Graphs on Floating Screens. A modern, clean isometric illustration showcasing various data visualizations. Multiple charts and graphs, including bar charts, line graphs, and pie charts, are displayed on floating screens, representing data analysis, business intelligence, or financial reporting. Ideal for presentations, reports, or website banners related to data-driven concepts.
Free with trial A 3D bar chart shows a downward trend with a prominent red arrow indicating a significant decrease in value. Decrease statistics illustrations Red arrow graph showing steep decline in bar chart data. A 3D bar chart shows a downward trend with a prominent red arrow indicating a significant decrease in value
Free with trial The image shows a bar graph placed on top of an open financial report book. The bar graph displays data with blue bars of varying heights, and two lines are plotted across the bars, one red and one blue. The graph appears to be indicating trends or comparisons over time. The financial report book underneath has detailed tables and charts, suggesting a thorough analysis of financial data. Decrease statistics illustrations Bar graph on financial report. The image shows a bar graph placed on top of an open financial report book. The bar graph displays data with blue bars of varying heights, and two lines are plotted across the bars, one red and one blue. The graph appears to be indicating trends or comparisons over time. The financial report book underneath has detailed tables and charts, suggesting a thorough analysis of financial data
Free with trial Stacks of coins diminish, mirroring a falling stock market chart against a world map backdrop, symbolizing global economic decline and financial loss. Decrease statistics illustrations Global Economic Downturn: Coin Stacks Decline with Bearish Stock Chart. Stacks of coins diminish, mirroring a falling stock market chart against a world map backdrop, symbolizing global economic decline and financial loss
Free with trial Graph with a green arrow pointing upwards. The graph is labeled with numbers and the numbers are increasing. Decrease statistics illustrations Graph with a green arrow pointing upwards
Free with trial A sharp red arrow pointing downwards in a zig-zag pattern, isolated on a clean white background. Represents decline or loss. Decrease statistics illustrations Red downward trend arrow isolated on white background. A sharp red arrow pointing downwards in a zig-zag pattern, isolated on a clean white background. Represents decline or loss
Free with trial A sharp red arrow indicating a downward trend or decline, isolated on a clean white background. Decrease statistics illustrations Red downward trend arrow isolated on white background. A sharp red arrow indicating a downward trend or decline, isolated on a clean white background
Free with trial Bar graphs with various upward and downward trending arrows and a stylized dollar sign indicating financial growth and decline. Decrease statistics vectors Bar graphs with various upward and downward trending arrows and a stylized dollar sign
Free with trial Hand drawing a decreasing bar graph with chalk on a dark chalkboard. Decrease statistics illustrations Hand drawing declining bar chart on blackboard. Hand drawing a decreasing bar graph with chalk on a dark chalkboard
Free with trial A simple line drawing of a hand with a percentage sign hovering above it. Decrease statistics vectors A hand holding a percentage sign. A simple line drawing of a hand with a percentage sign hovering above it
Free with trial This impactful illustration depicts the challenging realities of business downsizing. A digital tablet screen showcases a downward trending graph and decreasing staff icons, visually representing staff reduction and layoffs. The image poignantly conveys concepts of unemployment, financial decline, and economic loss. Ideal for presentations on finance, economy, or discussions surrounding job cuts,. Decrease statistics illustrations Business downsizing phase depicted on a digital tablet screen with decreasing staff and arrow. This impactful illustration depicts the challenging realities of business downsizing. A digital tablet screen showcases a downward trending graph and decreasing staff icons, visually representing staff reduction and layoffs. The image poignantly conveys concepts of unemployment, financial decline, and economic loss. Ideal for presentations on finance, economy, or discussions surrounding job cuts,
Free with trial Close up shot of a businessman analyzing cost reduction strategies using a laptop and pen highlighting a declining graph representing reduced expenses he is focused on achieving business success through financial analysis and efficiency improvements the image highlights the use of modern digital tools in cost management and financial planning. Decrease statistics illustrations Analyzing Cost Reduction Strategies with Digital Tools and Data Analysis for Business Success. Close up shot of a businessman analyzing cost reduction strategies using a laptop and pen highlighting a declining graph representing reduced expenses he is focused on achieving business success through financial analysis and efficiency improvements the image highlights the use of modern digital tools in cost management and financial planning
Free with trial Stacks of coins diminish with a red arrow pointing down, overlaid with a world map and financial chart, illustrating economic decline and global market downturn. Decrease statistics illustrations Declining Economy: Stacks of Coins with Red Arrow and World Map Overlay. Stacks of coins diminish with a red arrow pointing down, overlaid with a world map and financial chart, illustrating economic decline and global market downturn
Free with trial This hand-drawn bar chart, generated by AI, visually represents growth over time. The chart shows an initial decline followed by a significant upward trend, highlighting potential recovery or resurgence after a setback. The artistic style adds a unique touch. Decrease statistics illustrations AI-Generated Growth Chart. This hand-drawn bar chart, generated by AI, visually represents growth over time. The chart shows an initial decline followed by a significant upward trend, highlighting potential recovery or resurgence after a setback. The artistic style adds a unique touch.
Free with trial Neon graph shows falling trend with pink arrow pointing down. Blue bars indicate decline on, dark textured background. Modern abstract finance concept. Decrease statistics illustrations Neon graph shows falling trend with pink arrow pointing down. Blue bars indicate decline on dark textured background. Modern. Neon graph shows falling trend with pink arrow pointing down. Blue bars indicate decline on, dark textured background. Modern abstract finance concept.
Free with trial Bar chart icon with downward arrow showing declining business performance, financial loss, recession, negative trend, market crash analytics and falling sales report. Decrease statistics vectors Bar chart icon with downward arrow showing declining business performance, financial
Free with trial A financial chart showing declining index lines in blue shades on a grid-style white background. Concept of market analysis and trends. 3D Rendering. Decrease statistics illustrations Financial chart with declining index lines on grid background. 3D Rendering. A financial chart showing declining index lines in blue shades on a grid-style white background. Concept of market analysis and trends. 3D Rendering
Free with trial The image depicts a stark reality for many businesses today: a period of economic downturn. An empty office desk, alongside a laptop, a coffee cup, and a graph illustrating a significant market decline, symbolizes the challenges faced during a business slump. The scene highlights not just the present struggles, but also the need for proactive strategies to confront the situation. This period of. Decrease statistics illustrations Navigating a Business Slump Empty Desk Declining Chart and the Road Ahead. The image depicts a stark reality for many businesses today: a period of economic downturn. An empty office desk, alongside a laptop, a coffee cup, and a graph illustrating a significant market decline, symbolizes the challenges faced during a business slump. The scene highlights not just the present struggles, but also the need for proactive strategies to confront the situation. This period of
Free with trial A bar chart with five teal bars of decreasing height and a red arrow pointing downward. Decrease statistics illustrations A bar chart with a downward trend. a bar chart with five teal bars of decreasing height and a red arrow pointing downward
Free with trial This flat vector illustration depicts a rectangular screen displaying a red line graph with a downward pointing arrow. The design uses a clean, minimalist aesthetic with soft pastel background tones and bold outlines. It represents concepts of financial decline, market loss, or negative economic performance in a professional business context. Decrease statistics vectors A digital icon showing a red downward trend arrow on a screen. This flat vector illustration depicts a rectangular screen displaying a red line graph with a. This flat vector illustration depicts a rectangular screen displaying a red line graph with a downward pointing arrow. The design uses a clean, minimalist aesthetic with soft pastel background tones and bold outlines. It represents concepts of financial decline, market loss, or negative economic performance in a professional business context
Free with trial Graph phone line icon. Neumorphic, Flat shadow, 3d buttons. Column chart sign. Growth diagram symbol. Line graph phone icon. Social media icons. Vector. Decrease statistics vectors Graph phone line icon. Column chart sign. Neumorphic buttons. Vector. Graph phone line icon. Neumorphic, Flat shadow, 3d buttons. Column chart sign. Growth diagram symbol. Line graph phone icon. Social media icons. Vector
Free with trial Abstract Business Growth Chart with Vintage Texture. Decrease statistics illustrations Abstract Business Growth Chart with Vintage Texture
Free with trial Graph bars shrink steadily from left side toward right.. Bold arrow points down, emphasizing drop.. Monochrome tones highlight sharp decline. Decrease statistics vectors Downward trend bar chart with declining arrow illustration. Graph bars shrink steadily from left side toward right.. Bold arrow points down, emphasizing drop.. Monochrome tones highlight sharp decline
Free with trial A detailed bear figurine stands on a wooden surface, symbolizing a bearish trend in the stock market. The trend graph in the background visually represents market movements and fluctuations. Decrease statistics illustrations Bear Figurine on Wooden Surface with Stock Market Trend Graph in Background. A detailed bear figurine stands on a wooden surface, symbolizing a bearish trend in the stock market. The trend graph in the background visually represents market movements and fluctuations
Free with trial A close-up, shallow depth of field shot of a digital stock market ticker board. The screen displays rows of stock symbols and their corresponding prices in bright red and green LED lights against a dark background. Some numbers are in green, indicating gains, while others are in red, signifying losses or negative trends. The bokeh effect from out-of-focus lights adds a dynamic and professional feel, perfect for illustrating financial concepts. Decrease statistics illustrations Stock Market Ticker Display with Red and Green Numbers. A close-up, shallow depth of field shot of a digital stock market ticker board. The screen displays rows of stock symbols and their corresponding prices in bright red and green LED lights against a dark background. Some numbers are in green, indicating gains, while others are in red, signifying losses or negative trends. The bokeh effect from out-of-focus lights adds a dynamic and professional feel, perfect for illustrating financial concepts.
Free with trial An illustration depicts a sad face atop a credit card and rising green bars with upward arrows in a flat design style. Decrease statistics vectors Financial Burden and Growth: Sad Face with Credit Card and Rising Arrows Concept. An illustration depicts a sad face atop a credit card and rising green bars with upward arrows in a flat design style.
Free with trial A bold red arrow points downwards, positioned next to a light-colored, blank sign with the text 'YOURE YEXT HERE' visible. The scene is set outdoors, with green grass and a paved walkway in the background. This image is ideal for conveying concepts like decline, reduction, downward trend, or as a customizable template for messages and announcements. The clean design and clear visual elements make it versatile for various design and marketing purposes. Decrease statistics illustrations Red Arrow Pointing Down Next to Blank Sign with Text Space. A bold red arrow points downwards, positioned next to a light-colored, blank sign with the text 'YOURE YEXT HERE' visible. The scene is set outdoors, with green grass and a paved walkway in the background. This image is ideal for conveying concepts like decline, reduction, downward trend, or as a customizable template for messages and announcements. The clean design and clear visual elements make it versatile for various design and marketing purposes.
Free with trial A simple yet effective graphic representing a negative trend or declining business chart, perfect for illustrating downward data or economic downturn. Decrease statistics vectors Negative Trend Graph, Decreasing Business Chart, Downward Data Illustration. A simple yet effective graphic representing a negative trend or declining business chart, perfect for illustrating downward data or economic downturn.
Free with trial A visual representation of a steep financial downturn with a red line graph descending sharply, magnified to show a 15% decrease, symbolizing economic decline and losses. Decrease statistics illustrations Stock market crash downturn economic recession loss financial crisis downtrend chart magnifying glass zoom 15 percent. A visual representation of a steep financial downturn with a red line graph descending sharply, magnified to show a 15% decrease, symbolizing economic decline and losses
Free with trial A seamless pattern featuring various business and finance-related doodles, including graphs, charts, currencies, and other financial symbols. The doodles are drawn in a simple line style on a white background. This image can be used as a background or texture for presentations, reports, or websites related to business, finance, and economics. Decrease statistics vectors Business finance doodle pattern. A seamless pattern featuring various business and finance-related doodles, including graphs, charts, currencies, and other financial symbols. The doodles are drawn in a simple line style on a white background. This image can be used as a background or texture for presentations, reports, or websites related to business, finance, and economics.
Free with trial Declining Line Graph icon vector. Suitable for mobile apps, web apps and print media. Decrease statistics vectors Rising Line Graph icon vector. Declining Line Graph icon vector. Suitable for mobile apps, web apps and print media.