Free with trial 3D icon featuring a silver metallic effect in the shape of a negative trend graph. Bars in descending order from left to right are accompanied by a downward-pointing arrow. The icon is framed in a rounded square, all elements sharing a polished, reflective surface that suggests a modern and sleek design. Decrease statistics vectors Negative Trend Graph 3D icon with silver metallic effect. 3D icon featuring a silver metallic effect in the shape of a negative trend graph. Bars in descending order from left to right are accompanied by a downward-pointing arrow. The icon is framed in a rounded square, all elements sharing a polished, reflective surface that suggests a modern and sleek design.
Free with trial Multiple red percent symbols floating in the air against a blue sky. Generative AI. Decrease statistics illustrations Red Percent Symbols Falling from Sky. Multiple red percent symbols floating in the air against a blue sky. Generative AI
Free with trial A striking 3D render features a prominent, glossy red arrow pointing downwards, symbolizing a decline, loss, or negative trend. This arrow is positioned in the foreground, partially obscuring a bright, modern office interior. The office space includes desks, chairs, plants, and overhead lighting, suggesting a corporate or business environment. The image effectively conveys concepts such as economic recession, stock market crash, business failure, or a downward trend in performance. It is ideal for illustrating financial reports, business news, or any content related to negative business outcomes. Decrease statistics illustrations Red Downward Arrow Symbolizing Business Decline in Modern Office. A striking 3D render features a prominent, glossy red arrow pointing downwards, symbolizing a decline, loss, or negative trend. This arrow is positioned in the foreground, partially obscuring a bright, modern office interior. The office space includes desks, chairs, plants, and overhead lighting, suggesting a corporate or business environment. The image effectively conveys concepts such as economic recession, stock market crash, business failure, or a downward trend in performance. It is ideal for illustrating financial reports, business news, or any content related to negative business outcomes.
Free with trial Red Graph Line Under Magnifying Glass on White Paper. Decrease statistics illustrations Red Graph Line Under Magnifying Glass on White Paper
Free with trial A stark black background with a white grid displays a sharp descending line graph, symbolizing a significant financial downturn. Decrease statistics illustrations Sharp downward trend on a dark financial graph indicating market decline and economic recession. A stark black background with a white grid displays a sharp descending line graph, symbolizing a significant financial downturn
Free with trial Colorful bar chart on a red background displaying data ,Generative ai. Decrease statistics illustrations Vibrant colorful bar chart on red background, data visualization and analysis colorful. Colorful bar chart on a red background displaying data ,Generative ai
Free with trial A simple bar chart with alternating blue and green bars illustrates a clear downward trend over time. Decrease statistics illustrations Bar chart showing declining trend. A simple bar chart with alternating blue and green bars illustrates a clear downward trend over time
Free with trial A visual representation of economic downturn and falling interest rates, with stacks of coins decreasing in height and a downward trending arrow indicating a decline in financial value and market performance. Decrease statistics illustrations Decreasing interest rates and economic recession represented by stacked coins and a downward arrow with percentage symbols. A visual representation of economic downturn and falling interest rates, with stacks of coins decreasing in height and a downward trending arrow indicating a decline in financial value and market performance
Free with trial Businessman looking at a stock market chart showing financial crisis and falling profits. Decrease statistics illustrations Businessman thinking about business decline and financial loss. Businessman looking at a stock market chart showing financial crisis and falling profits
Free with trial This minimalist graphic illustration features a bold red line chart indicating a significant decline. The visual composition uses a clean white background to emphasize the downward trajectory of the data points. The aesthetic is professional and modern, suitable for business presentations or financial reports. Decrease statistics vectors A red line graph showing a downward trend on a white background. This minimalist graphic illustration features a bold red line chart indicating a significant decline. The visual composition uses a clean white background to emphasize the downward trajectory of the data points. The aesthetic is professional and modern, suitable for business presentations or financial reports
Free with trial A simple flat icon vector illustration of two hands adjusting a simple chart with a downturn arrow, symbolizing risk mitigation in a business setting. The simple chart with a downturn arrow is orange with dark gray elements, indicating loss control. White background. Minimalist style with sharp edges and no shadows. Orange and Gray color palette. Vector graphics with rounded corners. High. Decrease statistics illustrations Business Downturn Graph Two Hands Hold Downward Trend Chart. A simple flat icon vector illustration of two hands adjusting a simple chart with a downturn arrow, symbolizing risk mitigation in a business setting. The simple chart with a downturn arrow is orange with dark gray elements, indicating loss control. White background. Minimalist style with sharp edges and no shadows. Orange and Gray color palette. Vector graphics with rounded corners. High
Free with trial Illustration shows a man with a red downward arrow symbolizing decline or loss, set against a blue background, conveying concern and reflection. Generative AI. Decrease statistics vectors Man Standing with Red Downward Arrow Representing Decline or Loss Vector Illustration. Illustration shows a man with a red downward arrow symbolizing decline or loss, set against a blue background, conveying concern and reflection. Generative AI
Free with trial A 3D rendered blue arrow forms a jagged downward line, representing a declining trend or graph. The arrow is positioned diagonally, pointing towards the bottom right corner of the frame. The image is set against a clean white background, emphasizing the sharp descent. Decrease statistics illustrations Blue downward trending arrow graph on white background chart. A 3D rendered blue arrow forms a jagged downward line, representing a declining trend or graph. The arrow is positioned diagonally, pointing towards the bottom right corner of the frame. The image is set against a clean white background, emphasizing the sharp descent
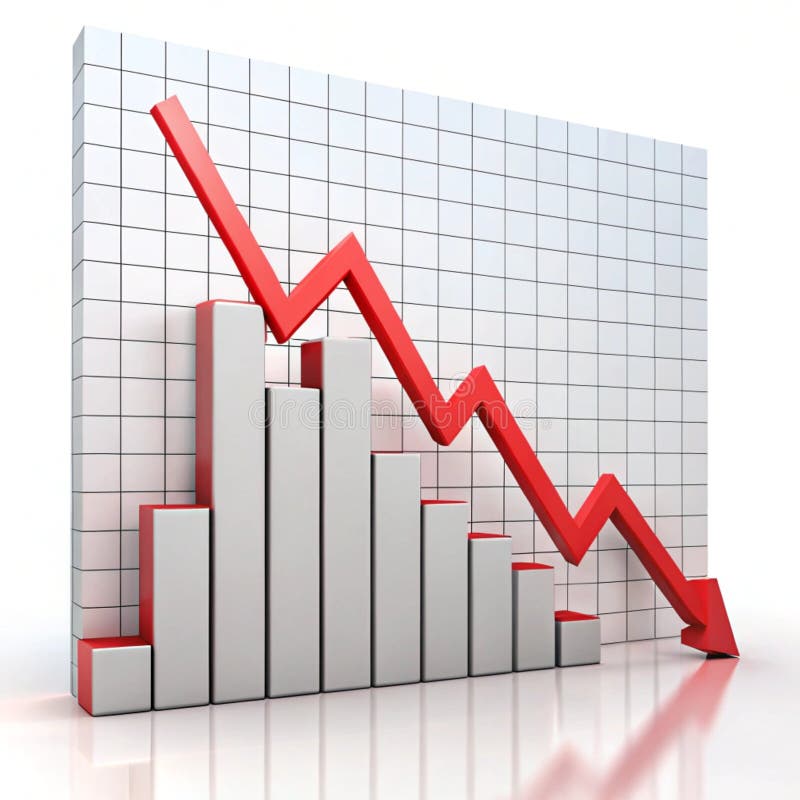
Free with trial A 3D line graph showing a downward trend with a red arrow pointing downwards, indicating a decline in data or financial performance. The graph is set against a grid background with a professional and ultra-detailed quality. Decrease statistics illustrations Downward Trend Graph with Red Arrow. A 3D line graph showing a downward trend with a red arrow pointing downwards, indicating a decline in data or financial performance. The graph is set against a grid background with a professional and ultra-detailed quality.
Free with trial Arrows up and down with human pictogram figures showing business growth versus decline, career promotion concept, minimal paper cut icons on yellow background. Decrease statistics illustrations Arrows up and down with human pictogram figures showing business growth versus decline
Free with trial A bold, three-dimensional yellow percentage sign icon standing alone against a clean background. Perfect for financial, statistical, or promotional graphics. Decrease statistics illustrations Bright yellow percentage sign icon. A bold, three-dimensional yellow percentage sign icon standing alone against a clean background. Perfect for financial. A bold, three-dimensional yellow percentage sign icon standing alone against a clean background. Perfect for financial, statistical, or promotional graphics
Free with trial A grid of black and white icons depicting financial charts with rising and falling trends, magnifying glasses with download arrows, and dollar signs. Decrease statistics vectors Collection of black and white icons representing financial charts and data analysis graph bar chart. A grid of black and white icons depicting financial charts with rising and falling trends, magnifying glasses with download arrows, and dollar signs
Free with trial A digital illustration of a centered document with the word 'Results' clearly written on it, set against a solid dark blue background, where numerous colorful percentage symbols of varying sizes float chaotically around the document, creating a dynamic and cluttered visual effect that conveys confusion, data overload, and the complexity of interpreting statistical outcomes in a modern analytical. Decrease statistics illustrations Document with results text surrounded by colorful percentage symbols on dark background. A digital illustration of a centered document with the word 'Results' clearly written on it, set against a solid dark blue background, where numerous colorful percentage symbols of varying sizes float chaotically around the document, creating a dynamic and cluttered visual effect that conveys confusion, data overload, and the complexity of interpreting statistical outcomes in a modern analytical
Free with trial A flat design illustration of a bar chart with bars decreasing in height, accompanied by a red arrow pointing downwards, symbolizing a negative trend or financial loss. Decrease statistics illustrations Bar chart showing a downward trend. A flat design illustration of a bar chart with bars decreasing in height, accompanied by a red arrow pointing downwards, symbolizing a negative trend or financial loss
Free with trial Colorful wooden blocks arranged in a bar graph formation on a weathered wooden surface , artistic vibe. Decrease statistics illustrations Colorful wooden blocks arranged in a bar graph formation on a weathered wooden surface
Free with trial A comprehensive overview of financial data is presented through various charts and graphs. The scene includes line graphs, bar charts, pie charts, and donut charts, accompanied by stacks of coins. The color palette is muted, featuring shades of beige, brown, and gray, creating a professional and clean aesthetic. This image is suitable for illustrating finance, business, investment, and data analysis concepts. Decrease statistics illustrations Financial Data and Charts Overview. A comprehensive overview of financial data is presented through various charts and graphs. The scene includes line graphs, bar charts, pie charts, and donut charts, accompanied by stacks of coins. The color palette is muted, featuring shades of beige, brown, and gray, creating a professional and clean aesthetic. This image is suitable for illustrating finance, business, investment, and data analysis concepts.
Free with trial A visual representation of business growth and financial data with 3D charts. This image effectively conveys concepts of analytics, progress, and reporting in a modern and engaging way. Decrease statistics illustrations 3d bar chart and pie chart representing financial data and growth on a blueprint isolated on white background. A visual representation of business growth and financial data with 3D charts. This image effectively conveys concepts of analytics, progress, and reporting in a modern and engaging way
Free with trial A stylized, abstract arrow graphic descends diagonally from the upper left to the lower right. The arrow is composed of three distinct, curved layers in vibrant colors: teal, orange, and a lighter shade of orange. The smooth, flowing lines suggest movement and direction. This graphic is ideal for representing concepts like decline, progress, data trends, or simple directional indicators in various design projects. Decrease statistics vectors Abstract Downward Arrow with Layers. A stylized, abstract arrow graphic descends diagonally from the upper left to the lower right. The arrow is composed of three distinct, curved layers in vibrant colors: teal, orange, and a lighter shade of orange. The smooth, flowing lines suggest movement and direction. This graphic is ideal for representing concepts like decline, progress, data trends, or simple directional indicators in various design projects.
Free with trial Tablet computer, situated on a wooden surface, presents business charts and graphs. A small potted plant is in the foreground. Decrease statistics illustrations A tablet computer displaying financial charts and graphs on a wooden surface. Tablet computer, situated on a wooden surface, presents business charts and graphs. A small potted plant is in the foreground
Free with trial A minimalistic 3D bar chart with descending glossy columns in blue and green is displayed on a white background. This image represents decline, analysis, and market trends. Decrease statistics illustrations Minimalistic 3D bar chart with descending glossy columns in blue and green on a white background. A minimalistic 3D bar chart with descending glossy columns in blue and green is displayed on a white background. This image represents decline, analysis, and market trends
Free with trial A visual representation of financial data showing a decline in performance, with red bars and arrows indicating a downward trend in the market. Decrease statistics illustrations Bar chart with downward trend isolated on white background. A visual representation of financial data showing a decline in performance, with red bars and arrows indicating a downward trend in the market
Free with trial This graphic features a stylized bar chart with a descending red arrow, symbolizing a downward trend. The image is presented in a split design, with the left side on a white background and the right side on a red background. This visual metaphor is ideal for representing financial losses, declining performance, economic downturns, or any situation indicating a negative trajectory. Its clean, minimalist style makes it versatile for various business, financial, and analytical contexts. Decrease statistics illustrations Red Downward Trend Graph with Arrow. This graphic features a stylized bar chart with a descending red arrow, symbolizing a downward trend. The image is presented in a split design, with the left side on a white background and the right side on a red background. This visual metaphor is ideal for representing financial losses, declining performance, economic downturns, or any situation indicating a negative trajectory. Its clean, minimalist style makes it versatile for various business, financial, and analytical contexts.
Free with trial Chart icon showing declining business performance with downward trend, dollar symbol, and briefcase loss marker, monochrome finance analytics graphic on white. Decrease statistics vectors Chart icon showing declining business performance with downward trend, dollar symbol, and
Free with trial The image depicts a line graph with a downward trend. The red line starts at a higher point on the y-axis and gradually declines, indicating a decrease over time. The x-axis represents time or another independent variable, while the y-axis represents the dependent variable that is decreasing. Decrease statistics illustrations Graph showing downward trend. The image depicts a line graph with a downward trend. The red line starts at a higher point on the y-axis and gradually declines, indicating a decrease over time. The x-axis represents time or another independent variable, while the y-axis represents the dependent variable that is decreasing
Free with trial Simple line art business icons set featuring a magnifying glass, minus symbol, pie chart, and rising bar graph for financial data analysis. Decrease statistics vectors Simple line art business icons set featuring a magnifying glass, minus symbol, pie chart, and rising bar graph for
Free with trial Business and finance isometric illustrations set. Vector made with AI. Decrease statistics vectors Business and finance isometric illustrations set
Free with trial A clean, minimalist vector illustration of a bar chart featuring three distinct columns. The columns are colored in vibrant orange, teal, and yellow, representing different data points or categories. The chart is set against a white background with a dark blue axis line, making it ideal for presentations, reports, and infographics focused on data visualization, business growth, or financial analysis. Decrease statistics vectors Simple Bar Chart with Three Columns. A clean, minimalist vector illustration of a bar chart featuring three distinct columns. The columns are colored in vibrant orange, teal, and yellow, representing different data points or categories. The chart is set against a white background with a dark blue axis line, making it ideal for presentations, reports, and infographics focused on data visualization, business growth, or financial analysis.
Free with trial A 3D rendered bar chart encased in clear glass, displaying year-end business performance. The chart features three vertical bars in blue, pink, and yellow, representing 61%, 24%, and 35% respectively. The clean, modern design and transparent material create a sophisticated visual suitable for presentations, reports, and data visualization concepts related to business growth, financial analysis, and success metrics. Decrease statistics illustrations Year End Business Performance Chart. A 3D rendered bar chart encased in clear glass, displaying year-end business performance. The chart features three vertical bars in blue, pink, and yellow, representing 61%, 24%, and 35% respectively. The clean, modern design and transparent material create a sophisticated visual suitable for presentations, reports, and data visualization concepts related to business growth, financial analysis, and success metrics.
Free with trial A man in a suit holds a phone and a stylus, interacting with a projected bar graph showing a downward trend in profits and an upward trend in costs. Decrease statistics illustrations Businessman analyzes declining profits and rising costs using digital graph on a dark background. A man in a suit holds a phone and a stylus, interacting with a projected bar graph showing a downward trend in profits and an upward trend in costs
Free with trial A businessman is using wooden blocks to represent financial growth and decline. the image represents business strategy, investment planning and market analysis for online business success now. Decrease statistics illustrations Business growth strategy and financial planning for investment and market analysis success online now. a businessman is using wooden blocks to represent financial growth and decline. the image represents business strategy, investment planning and market analysis for online business success now.
Free with trial Downward trend graph illustrating business decline and financial recession. Chalk drawing on a black chalkboard background features white bars and a prominent yellow downward arrow with ample copy space. Ideal for economic reports, marketing presentations, and educational content. Decrease statistics illustrations Downward Trend Graph Showing Business Decline with Yellow Arrow on Chalkboard Background. Downward trend graph illustrating business decline and financial recession. Chalk drawing on a black chalkboard background features white bars and a prominent yellow downward arrow with ample copy space. Ideal for economic reports, marketing presentations, and educational content.
Free with trial A stark, neon yellow line graph depicts a sharp downward trend on a dark, grid-lined background, symbolizing economic recession. Decrease statistics illustrations Neon yellow downward trending graph illustrating financial decline against a dark grid background. A stark, neon yellow line graph depicts a sharp downward trend on a dark, grid-lined background, symbolizing economic recession
Free with trial A neon orange graph on a black background shows a sharp decline, symbolizing financial loss or a negative trend. Decrease statistics illustrations Neon orange downward trending graph with arrow indicating financial decline on a black background. A neon orange graph on a black background shows a sharp decline, symbolizing financial loss or a negative trend
Free with trial A futuristic digital illustration depicts a world map with a dark background composed of small blue and green dots arranged in a dotted pattern to create depth and dimension, featuring a prominent downward-trending line graph at its center surrounded by a darker green line that represents declining financial data or stock market performance, creating a technological visualization of the global. Decrease statistics illustrations Digital world map with dotted pattern showing global economic downturn on dark background. A futuristic digital illustration depicts a world map with a dark background composed of small blue and green dots arranged in a dotted pattern to create depth and dimension, featuring a prominent downward-trending line graph at its center surrounded by a darker green line that represents declining financial data or stock market performance, creating a technological visualization of the global
Free with trial Bar graph with a downward arrow on a school hallway floor. Concept of declining performance, budget cuts, or failure in education and student outcomes. Decrease statistics illustrations Bar graph with a downward arrow on a school hallway floor. Concept of declining performance, budget cuts, or failure in education
Free with trial Web report line icon. Continuous line with share plane. Column graph sign. Growth diagram symbol. 3d star in speech bubble. Web report single line ribbon. Loop curve pattern. Vector. Decrease statistics vectors Web report line icon. Column graph sign. Continuous line with plane. Vector. Web report line icon. Continuous line with share plane. Column graph sign. Growth diagram symbol. 3d star in speech bubble. Web report single line ribbon. Loop curve pattern. Vector
Free with trial Set of 16 black and white graph icons in a 4x4 grid. Each icon depicts variations of bar charts with upward and downward arrows, suggesting growth or decline. Some include additional elements like magnifying glasses, checkmarks, and data points connected by lines. Icons vary slightly in design, representing different data trends with simple, bold lines on a white background, ideal for business and statistical representation. Decrease statistics vectors Graph icon set. Increase and decrease graph icon. Growth icon. Graph chart icons. Icon set. 16 icons. Set of 16 black and white graph icons in a 4x4 grid. Each icon depicts variations of bar charts with upward and downward arrows, suggesting growth or decline. Some include additional elements like magnifying glasses, checkmarks, and data points connected by lines. Icons vary slightly in design, representing different data trends with simple, bold lines on a white background, ideal for business and statistical representation.
Free with trial A 3D-rendered colorful percentage symbol (%) floats against a neutral backdrop. The symbol features vibrant, multi-colored concentric layers with a metallic sheen, creating a dynamic and modern effect. The colors range across the spectrum, including orange, blue, pink, and yellow, with a glossy, reflective texture. Illuminated from below, the symbol casts a soft, warm glow onto the surface beneath, emphasizing its three-dimensional form and vivid color palette. Decrease statistics illustrations Glowing 3D Percentage Symbol with Iridescent Reflections on Dark Background. A 3D-rendered colorful percentage symbol (%) floats against a neutral backdrop. The symbol features vibrant, multi-colored concentric layers with a metallic sheen, creating a dynamic and modern effect. The colors range across the spectrum, including orange, blue, pink, and yellow, with a glossy, reflective texture. Illuminated from below, the symbol casts a soft, warm glow onto the surface beneath, emphasizing its three-dimensional form and vivid color palette.
Free with trial Colorful 3D Bar Chart Illustration for indicator economic review. Decrease statistics illustrations Colorful 3D Bar Chart Illustration
Free with trial Concept of real estate market fluctuations with miniature houses and rising graph lines. Vibrant tones and a grid layout convey, economic trends. Rising property values concept with red houses layout on rising red line graph on abstract blue background. 3D rendering. Decrease statistics illustrations 3D rendering of miniature red houses on a rising graph, real estate market fluctuations. Concept of real estate market fluctuations with miniature houses and rising graph lines. Vibrant tones and a grid layout convey, economic trends. Rising property values concept with red houses layout on rising red line graph on abstract blue background. 3D rendering
Free with trial Downward graph chart isolated on transparent background. Decrease statistics illustrations Downward graph chart
Free with trial A set of declining bar and line graphs displayed on a grid background. 3D Rendering. Concept of financial decline and analysis. Decrease statistics illustrations Declining Bar and Line Graphs on Grid Background. 3D Rendering. A set of declining bar and line graphs displayed on a grid background. 3D Rendering. Concept of financial decline and analysis
Free with trial Financial chart with golden downward arrow, statistical data, numbers in focus, white background. Concept of economic decline. 3D Rendering. Decrease statistics illustrations Financial chart with downward trend and arrow on light background. 3D Rendering. Financial chart with golden downward arrow, statistical data, numbers in focus, white background. Concept of economic decline. 3D Rendering
Free with trial A graph showing global sales growth trends on a printed document with multiple colored lines. Decrease statistics illustrations Global Sales Growth Chart on Document. A graph showing global sales growth trends on a printed document with multiple colored lines
Free with trial A single ripe yellow banana is positioned on a white surface. A colorful, downward-trending graph with a zigzag pattern is depicted behind and partially over the banana. The graph transitions from gray to green, yellow, orange, and finally a red arrow pointing downwards, symbolizing a negative trend or decline. Decrease statistics illustrations Banana with Downward Trend Graph on White Background fruit food. A single ripe yellow banana is positioned on a white surface. A colorful, downward-trending graph with a zigzag pattern is depicted behind and partially over the banana. The graph transitions from gray to green, yellow, orange, and finally a red arrow pointing downwards, symbolizing a negative trend or decline
Free with trial A modern digital tablet is placed on a sleek marble desk, displaying a prominent graph illustrating a rising inflation rate. The graph features a jagged, upward trend in red and orange hues, indicating economic volatility. Beside the tablet, a stack of white cards, a pen, and a pair of reading glasses suggest a business or analytical setting. A small green potted plant adds a touch of life to the scene. This image is ideal for representing economic analysis, financial planning, market trends, and the challenges of managing inflation. Decrease statistics illustrations Digital Tablet Displaying Inflation Rate Graph on a Marble Desk. A modern digital tablet is placed on a sleek marble desk, displaying a prominent graph illustrating a rising inflation rate. The graph features a jagged, upward trend in red and orange hues, indicating economic volatility. Beside the tablet, a stack of white cards, a pen, and a pair of reading glasses suggest a business or analytical setting. A small green potted plant adds a touch of life to the scene. This image is ideal for representing economic analysis, financial planning, market trends, and the challenges of managing inflation.
Free with trial Colorful Charts and Graphs Data Visualization Infographic. Decrease statistics illustrations Colorful Charts and Graphs Data Visualization Infographic
Free with trial Hand-drawn financial charts and graphs displayed on a transparent glass board, perfect for business presentations. Decrease statistics illustrations Glass Board with Hand-Drawn Financial Charts and Graphs. Hand-drawn financial charts and graphs displayed on a transparent glass board, perfect for business presentations
Free with trial This minimalist vector illustration depicts a human hand holding a pen, actively drawing a downward-trending bar graph. The composition features a clean, flat design style with a neutral white background, emphasizing the red and grey bars. The visual mood is professional and analytical, representing concepts of financial loss, market decline, or negative performance metrics. Decrease statistics vectors A hand uses a pen to draw a declining bar chart on a white background. This minimalist vector illustration depicts a human hand holding a pen, actively drawing a downward-trending bar graph. The composition features a clean, flat design style with a neutral white background, emphasizing the red and grey bars. The visual mood is professional and analytical, representing concepts of financial loss, market decline, or negative performance metrics
Free with trial A chart with a red arrow pointing downward, isolated on a white background, representing financial decline or a negative trend. Decrease statistics illustrations Decreasing chart with red arrow isolated on white background. A chart with a red arrow pointing downward, isolated on a white background, representing financial decline or a negative trend
Free with trial Black zigzag arrow icon pointing downward, indicating a negative trend or decline. Decrease statistics vectors Falling down arrow graph symbol. Black zigzag arrow icon pointing downward, indicating a negative trend or decline
Free with trial This minimalist graphic illustration features a bold red line chart indicating a significant decline in value. The visual includes a currency symbol and bar segments set against a clean background to represent economic loss or market downturn. The sharp downward arrow emphasizes a negative trajectory in fiscal data and business analytics. Decrease statistics vectors A red line graph showing a downward trend in financial performance. This minimalist graphic illustration features a bold red line chart indicating a significant decline in value. The visual includes a currency symbol and bar segments set against a clean background to represent economic loss or market downturn. The sharp downward arrow emphasizes a negative trajectory in fiscal data and business analytics
Free with trial A red line on a chart with a downward trend, indicating a decline or loss in the stock market. Generative AI. Decrease statistics illustrations Red Downward Trend. A red line on a chart with a downward trend, indicating a decline or loss in the stock market. Generative AI
Free with trial This minimalist graphic illustration features a series of vertical green bars arranged in descending order of height. A bold black diagonal arrow points downwards across the top of the bars, symbolizing a decline or negative performance. The clean design uses a flat aesthetic against a plain background, making it ideal for business presentations or financial reports. Decrease statistics vectors A simple green bar chart showing a downward trend with a black arrow. This minimalist graphic illustration features a series of vertical green bars arranged in descending order of height. A bold black diagonal arrow points downwards across the top of the bars, symbolizing a decline or negative performance. The clean design uses a flat aesthetic against a plain background, making it ideal for business presentations or financial reports
Free with trial Flat vector illustration of a chart depicting a negative trend, accompanied by a sad face icon, suggesting business decline or failure. Decrease statistics vectors A chart showing a negative trend with a sad face icon, indicating a decline in business. Flat vector illustration of a chart depicting a negative trend, accompanied by a sad face icon, suggesting business decline or failure.
Free with trial A bar chart shows a decline, coupled with a sad face, conveying negative trends in a flat design style. Decrease statistics vectors Declining bar chart with a sad face symbolizing loss, downturn, or negative trends. A bar chart shows a decline, coupled with a sad face, conveying negative trends in a flat design style.
Free with trial Graph laptop line icon. Continuous line with share plane. Column chart sign. Growth diagram symbol. 3d heart in speech bubble. Graph laptop single line ribbon. Loop curve pattern. Vector. Decrease statistics vectors Graph laptop line icon. Column chart sign. Continuous line with plane. Vector. Graph laptop line icon. Continuous line with share plane. Column chart sign. Growth diagram symbol. 3d heart in speech bubble. Graph laptop single line ribbon. Loop curve pattern. Vector
Free with trial A downward sloping red arrow over a series of green bars decreasing in height, illustrating decline or reduction. Decrease statistics illustrations Declining bar chart with downward arrow. A downward sloping red arrow over a series of green bars decreasing in height, illustrating decline or reduction
Free with trial A conceptual icon representing the rejection or failure of a business strategy. Decrease statistics vectors Discarding Business Growth Concept Icon. A conceptual icon representing the rejection or failure of a business strategy
Free with trial This minimalist vector illustration depicts a financial chart with a bold red arrow pointing downwards, symbolizing a significant decline or loss. The graphic features clean lines and a simple aesthetic, emphasizing the negative movement of the data points. The stark contrast between the red elements and the plain background makes it an effective visual for concepts related to economic downturns,. Decrease statistics vectors A red line graph showing a sharp downward trend on a white background. This minimalist vector illustration depicts a financial chart with a bold red arrow pointing downwards, symbolizing a significant decline or loss. The graphic features clean lines and a simple aesthetic, emphasizing the negative movement of the data points. The stark contrast between the red elements and the plain background makes it an effective visual for concepts related to economic downturns,
Free with trial An illustrative icon representing the exchange of digital information. Decrease statistics vectors Digital Dialogue and Data Download Icon. An illustrative icon representing the exchange of digital information
Free with trial A red arrow shaped like a declining graph illustrates a downward trend. This image can be used to represent financial loss, market crashes, or negative performance in business and economics. Decrease statistics illustrations Downward Trend Graph Red Arrow Decline. A red arrow shaped like a declining graph illustrates a downward trend. This image can be used to represent financial loss, market crashes, or negative performance in business and economics
Free with trial Red arrow pointing down graph shows market crash red arrow economics red AI-generated for unique and creative designs. Decrease statistics illustrations Red arrow pointing down, graph shows market crash , red arrow, economics, red. Red arrow pointing down graph shows market crash red arrow economics red AI-generated for unique and creative designs
Free with trial This minimalist graphic illustration features a bold red line chart indicating a significant decline. The visual composition uses clean lines and a flat design aesthetic to represent negative growth or financial loss. The stark contrast between the vibrant red color and the neutral background emphasizes the downward trajectory of the data points. Decrease statistics vectors A red line graph showing a downward trend on a plain white background. This minimalist graphic illustration features a bold red line chart indicating a significant decline. The visual composition uses clean lines and a flat design aesthetic to represent negative growth or financial loss. The stark contrast between the vibrant red color and the neutral background emphasizes the downward trajectory of the data points
Free with trial This graphic illustration depicts a declining financial trend using a bar chart and a line graph. The visual features red bars decreasing in height alongside a red line pointing downward, symbolizing economic loss or market contraction. Various currency symbols are positioned near arrows to emphasize the negative movement against a dark background. Decrease statistics vectors A financial chart showing a downward trend with red bars and arrows. This graphic illustration depicts a declining financial trend using a bar chart and a line graph. The visual features red bars decreasing in height alongside a red line pointing downward, symbolizing economic loss or market contraction. Various currency symbols are positioned near arrows to emphasize the negative movement against a dark background
Free with trial This minimalist vector illustration depicts a financial chart with a prominent red arrow pointing downwards, symbolizing a significant decline in value or performance. The graphic features clean lines and a simple color palette, emphasizing the negative trend against a neutral backdrop. Below the chart, numerical data points are displayed in a rectangular box, highlighting the extent of the loss. Decrease statistics vectors A red line graph showing a sharp downward trend on a white background. This minimalist vector illustration depicts a financial chart with a prominent red arrow pointing downwards, symbolizing a significant decline in value or performance. The graphic features clean lines and a simple color palette, emphasizing the negative trend against a neutral backdrop. Below the chart, numerical data points are displayed in a rectangular box, highlighting the extent of the loss.
Free with trial Simple 3D bar graph with colored bars on a white background, representing data comparison. Decrease statistics illustrations Colorful Bar Graph Illustration on White. Simple 3D bar graph with colored bars on a white background, representing data comparison
Free with trial A simple line graph showing a downward trend. The graph features a single black line that starts high on the left and ends low on the right, with a jagged pattern in between. The line ends with a large arrow pointing downwards, emphasizing the decline. The graph is set against a white background with a black border, making it a clear and concise visual representation of a decreasing trend. Decrease statistics vectors Downward Trend Graph. A simple line graph showing a downward trend. The graph features a single black line that starts high on the left and ends low on the right, with a jagged pattern in between. The line ends with a large arrow pointing downwards, emphasizing the decline. The graph is set against a white background with a black border, making it a clear and concise visual representation of a decreasing trend.
Free with trial A bold, bright red 3D percentage symbol stands prominently on a clean white background. The symbol has a glossy finish, giving it a solid and impactful appearance. Its clean lines and vibrant color make it a clear and eye-catching representation of percentages and financial concepts. Decrease statistics illustrations Bright Red 3D Percentage Symbol on a White Background image photo. A bold, bright red 3D percentage symbol stands prominently on a clean white background. The symbol has a glossy finish, giving it a solid and impactful appearance. Its clean lines and vibrant color make it a clear and eye-catching representation of percentages and financial concepts
Free with trial A bold red and blue percent sign symbol on a white background, representing discounts or percentages. Decrease statistics illustrations Vibrant red and blue percent sign symbol. A bold red and blue percent sign symbol on a white background, representing discounts or percentages
Free with trial A simple line graph showing a downward trend. The graph features a single black line that starts high on the left and descends to the right, ending in a downward-pointing arrow. The background is white, providing a clean and neutral contrast to the black line. Decrease statistics vectors Downward Trend Graph. A simple line graph showing a downward trend. The graph features a single black line that starts high on the left and descends to the right, ending in a downward-pointing arrow. The background is white, providing a clean and neutral contrast to the black line.
Free with trial Red declining stock market graph over a world map on a white background. Concept of global financial crisis. 3D Rendering. Decrease statistics illustrations Red declining stock market graph on white background. 3D Rendering. Red declining stock market graph over a world map on a white background. Concept of global financial crisis. 3D Rendering
Free with trial 3D Illustration of Abstract Bar Graph finance. Decrease statistics illustrations 3D Illustration of Abstract Bar Graph