Free with trial Column chart sign. Salaryman, gender equality and alert bell outline icons. Diagram graph line icon. Market analytics symbol. Spy or profile placeholder icon. Vector. Decrease statistics vectors Diagram graph line icon. Column chart sign. Salaryman, gender equality and alert bell. Vector. Column chart sign. Salaryman, gender equality and alert bell outline icons. Diagram graph line icon. Market analytics symbol. Diagram graph line sign. Spy or profile placeholder icon. Vector
Free with trial Cameroon flag with a declining bar chart and down arrows, symbolizing decline in data, performance, or various national indicators. Decrease statistics illustrations Flag with a declining bar chart and down arrows, symbolizing decline in data, performance, or various national indicators in the
Free with trial Flag with a declining bar chart and down arrows, symbolizing decline in data, performance, or various national indicators in the. Decrease statistics illustrations Flag with a declining bar chart and down arrows, symbolizing decline in data, performance, or various national indicators in the
Free with trial Uptrend or downtrend set on a dark grey to black minimalist studio background, represented by an upward scrolling white columnar bar chart. 3D render visualizing market trend or challenging business. Decrease statistics illustrations Uptrend or downtrend set on a dark grey to black minimalist studio background, represented by an upward scrolling white columnar
Free with trial Stock market chart shows fluctuating data with traders in the background. Growing intensity in the economic environment. no focus. Decrease statistics illustrations Stock market chart shows fluctuating data with traders in the background. Growing intensity in the economic environment. no focus
Free with trial Vibrant 12-slice pie chart with distinct colored segments labeled with numbers in black cursive font. Gray wall background highlights rich colors and bold numbers. Decrease statistics illustrations Vibrant 12-slice pie chart with distinct colored segments, labeled with numbers in black cursive font. Gray wall background. Vibrant 12-slice pie chart with distinct colored segments labeled with numbers in black cursive font. Gray wall background highlights rich colors and bold numbers.
Free with trial This compelling data visualization showcases a clear downward trend, perfect for illustrating declining performance, market share, or other metrics. The dark background provides a striking contrast to the graph's lines, emphasizing the trend's trajectory. The visual clarity makes it an excellent tool for conveying complex information effectively, whether for internal reports, presentations to. Decrease statistics illustrations Visualizing Declining Trends A Dark Night Graph Depicts a Downward Trajectory in Data Ideal for Reports Presentations. This compelling data visualization showcases a clear downward trend, perfect for illustrating declining performance, market share, or other metrics. The dark background provides a striking contrast to the graph's lines, emphasizing the trend's trajectory. The visual clarity makes it an excellent tool for conveying complex information effectively, whether for internal reports, presentations to
Free with trial Data analytics icons collection is a vector illustration with editable stroke. Decrease statistics vectors Data analytics icons collection is a vector illustration with editable stroke.
Free with trial Abstract red background, black graph line, decline, instability, financial crisis. Symbolizes risk, uncertainty, downward trend. Can be used for display or montage your products. Generative AI. Decrease statistics illustrations Red Market Trend Abstract red background black graph line decline instability financial crisis Symbolizes risk uncertainty. Abstract red background, black graph line, decline, instability, financial crisis. Symbolizes risk, uncertainty, downward trend. Can be used for display or montage your products. Generative AI
Free with trial White robot kneeling and examining a stack of plates forming a descending graph on a green background, representing economic decline or market analysis in a futuristic and conceptual way. Decrease statistics illustrations Robotic figure analyzing stacked plates forming descending graph pattern, symbolizing economic downturn against green. White robot kneeling and examining a stack of plates forming a descending graph on a green background, representing economic decline or market analysis in a futuristic and conceptual way
Free with trial Line Graph Chart Icon. Data Analysis, Business Growth, And Statistical Trends Outline Symbol. Financial Performance Tracking. Editable Stroke. Isolated Vector Illustration. Decrease statistics vectors Line Graph Chart Icon. Data Analysis, Business Growth, And Statistical Trends Outline Symbol. Financial Performance
Free with trial Data funnel filtering process showing percentage drop in prices or conversion rate on isolated black and white design. Decrease statistics vectors Data funnel filtering process showing percentage drop in prices or conversion rate on isolated black and white design
Free with trial Bar graph showing GDP growth and decline, with flag icons representing countries. Generative Ai. Decrease statistics illustrations Bar graph showing GDP growth and decline, with flag icons representing countries
Free with trial Bar Chart With Downward Arrow Solid Icon. Financial Decline, Economic Downturn, And Business Loss Silhouette Symbol. Market Analysis And Trend Observation. Isolated Vector Illustration. Decrease statistics vectors Bar Chart With Downward Arrow Solid Icon. Financial Decline, Economic Downturn, And Business Loss Silhouette Symbol
Free with trial Bar graph illustrates GDP growth and decline, marked by country flags for comparison. Generative Ai. Decrease statistics illustrations Bar graph illustrates GDP growth and decline, marked by country flags for comparison
Free with trial The image captures a close-up view of someone examining financial charts on a screen, possibly for making trading or investment decisions, emphasizing the data-driven nature of finance. Decrease statistics illustrations A person analyzing financial market charts on a screen, possibly for investment or trading decisions. Data-driven finance concept. The image captures a close-up view of someone examining financial charts on a screen, possibly for making trading or investment decisions, emphasizing the data-driven nature of finance
Free with trial Abstract 3D blue graph representing market data fluctuations over time, showing peaks and valleys on a financial report, detailed background Generative AI. Decrease statistics illustrations Abstract 3D blue graph representing market data fluctuations over time, showing peaks and valleys on a financial report
Free with trial 3D Illustration Business Graph Chart Growth Success Analysis Finance Investment Strategy Data Market Stock Economy Trading Financial Progress Report. Decrease statistics illustrations 3D Illustration Business Graph Chart Growth Success Analysis Finance Investment Strategy Data Market Stock Economy Trading
Free with trial This impactful image displays the American flag beneath cutouts of a factory, a house, and a downward trend graph, all surrounded by wooden blocks, symbolizing economic challenges. Decrease statistics illustrations Economic indicators show a factory, house, and downward trend on an American flag. This impactful image displays the American flag beneath cutouts of a factory, a house, and a downward trend graph, all surrounded by wooden blocks, symbolizing economic challenges.
Free with trial Bar Chart With Downward Arrow Solid Icon. Financial Decline, Economic Downturn, And Business Loss Silhouette Symbol. Market Analysis And Trend Evaluation. Isolated Vector Illustration. Decrease statistics vectors Bar Chart With Downward Arrow Solid Icon. Financial Decline, Economic Downturn, And Business Loss Silhouette Symbol
Free with trial Pink and green graph. Motion. Cartoon animation with graphs with a white dot moving to the left. High quality 4k footage. Decrease statistics illustrations Pink and green graph. Motion.Cartoon animation with graphs with a white dot moving to the left.
Free with trial A 3D representation of a document displaying a bar chart and a dotted line graph, indicating data trends and analysis. A small, rounded icon featuring a landscape with mountains and a sun is placed ab. Decrease statistics illustrations 3d infographic showing a document with a bar chart and line graph, alongside a small image icon, isolated on white background. A 3D representation of a document displaying a bar chart and a dotted line graph, indicating data trends and analysis. A small, rounded icon featuring a landscape with mountains and a sun is placed ab
Free with trial Pink and green graph. Motion. Cartoon animation with graphs with a white dot moving to the left. High quality 4k footage. Decrease statistics illustrations Pink and green graph. Motion.Cartoon animation with graphs with a white dot moving to the left.
Free with trial Pink and green graph. Motion. Cartoon animation with graphs with a white dot moving to the left. High quality 4k footage. Decrease statistics illustrations Pink and green graph. Motion.Cartoon animation with graphs with a white dot moving to the left.
Free with trial A golden arrow pierces a coin, emphasizing a decline in value against increasing stacks of coins in a soft-focus background highlighting economic instability. Decrease statistics illustrations Golden arrow striking a stack of coins represents a downward trend in the monetary market, reflecting economic challenges and. A golden arrow pierces a coin, emphasizing a decline in value against increasing stacks of coins in a soft-focus background highlighting economic instability
Free with trial Closeup view of a pen resting on graph, suggesting data analysis or business planning ,Generative AI. Decrease statistics illustrations Detailed view of a pen placed on graph, depicting financial analysis, business planning, and data interpretation for strategic. Closeup view of a pen resting on graph, suggesting data analysis or business planning ,Generative AI
Free with trial Hand-Drawn Graph Chart Illustrating Decline, with Arrow Signifying Downturn, Shows Negative Growth and Falling Market Trends. Decrease statistics vectors Hand-Drawn Graph Chart Illustrating Decline, with Arrow Signifying Downturn, Shows Negative Growth and Falling Market Trends
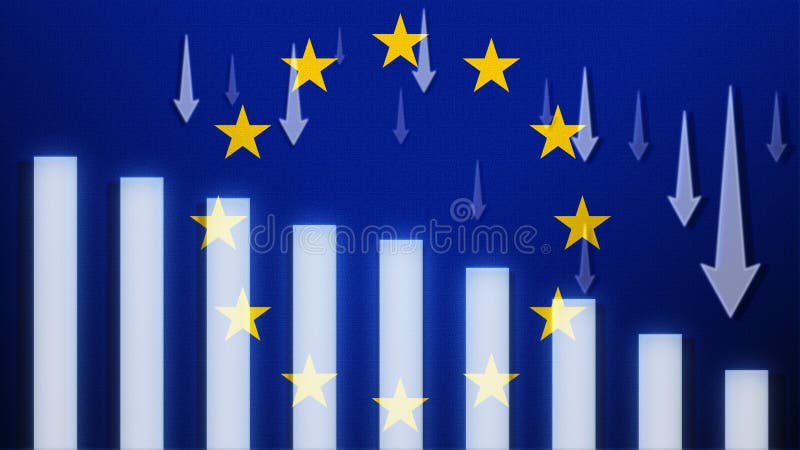
Free with trial EU flag with a declining bar chart and down arrows, symbolizing decline in data, performance, or various indicators. Decrease statistics illustrations Flag with a declining bar chart and down arrows, symbolizing decline in data, performance, or various indicators in the country. EU flag with a declining bar chart and down arrows, symbolizing decline in data, performance, or various indicators
Free with trial Graph with arrow down outline icon, symbolizing a downward trend or decrease in data. Perfect for financial reports, stock market analysis, and performance tracking. Decrease statistics vectors Professional Graph with Downward Arrow Vector Illustration for Business Presentations. Graph with arrow down outline icon, symbolizing a downward trend or decrease in data. Perfect for financial reports, stock market analysis, and performance tracking.
Free with trial Graph with arrow down outline icon, symbolizing a downward trend or decrease in data. Perfect for financial reports, stock market analysis, and performance tracking. Decrease statistics vectors Professional Graph with Downward Arrow Vector Illustration for Business Presentations. Graph with arrow down outline icon, symbolizing a downward trend or decrease in data. Perfect for financial reports, stock market analysis, and performance tracking.
Free with trial Graph with arrow down outline icon, symbolizing a downward trend or decrease in data. Perfect for financial reports, stock market analysis, and performance tracking. Decrease statistics vectors Professional Graph with Downward Arrow Vector Illustration for Business Presentations. Graph with arrow down outline icon, symbolizing a downward trend or decrease in data. Perfect for financial reports, stock market analysis, and performance tracking.
Free with trial Graph with arrow down outline icon, symbolizing a downward trend or decrease in data. Perfect for financial reports, stock market analysis, and performance tracking. Decrease statistics vectors Professional Graph with Downward Arrow Vector Illustration for Business Presentations. Graph with arrow down outline icon, symbolizing a downward trend or decrease in data. Perfect for financial reports, stock market analysis, and performance tracking.
Free with trial Hand drawn cartoon bar graph illustration with downward pointing arrow suggesting economic decline or market crash and loss. Decrease statistics vectors Hand drawn cartoon bar graph illustration with downward pointing arrow suggesting economic decline or market crash and loss
Free with trial Purple and gray light graph. Motion. A point moving along a graph line that goes up and down in animation. High quality 4k footage. Decrease statistics illustrations Purple and gray light graph. Motion.A point moving along a graph line that goes up and down in animation.
Free with trial Purple and gray light graph. Motion. A point moving along a graph line that goes up and down in animation. High quality 4k footage. Decrease statistics illustrations Purple and gray light graph. Motion.A point moving along a graph line that goes up and down in animation.
Free with trial Purple and gray light graph. Motion. A point moving along a graph line that goes up and down in animation. High quality 4k footage. Decrease statistics illustrations Purple and gray light graph. Motion.A point moving along a graph line that goes up and down in animation.
Free with trial A creative composition featuring global market decline visualization a bar graph and line chart showing a decreasing trend overlaid on a world map. Generative AI. Decrease statistics illustrations Global market decline visualization a bar graph and line chart showing a decreasing trend overlaid on a world map. Generative AI
Free with trial A wall display of framed blue data charts and graphs showing various financial trends and statistical information. A captivating fusion of imagination and modern design aesthetics. Generative AI. Decrease statistics illustrations A wall display of framed blue data charts and graphs showing various financial trends and statistical information. Generative AI. A wall display of framed blue data charts and graphs showing various financial trends and statistical information. A captivating fusion of imagination and modern design aesthetics. Generative AI
Free with trial Business financial decline chart showing significant loss. Hand draws a downward orange arrow on a dark blue chalkboard with ample copy space. Ideal for economic analysis, corporate presentations, and marketing materials. Decrease statistics illustrations Business Financial Decline Chart. Hand drawing bar graph with downward orange arrow on blue chalkboard background, copy space. Business financial decline chart showing significant loss. Hand draws a downward orange arrow on a dark blue chalkboard with ample copy space. Ideal for economic analysis, corporate presentations, and marketing materials.
Free with trial Followers icons High-Quality Vector Icons Collection with Editable Stroke. Ideal for Professional and Creative Projects. Decrease statistics vectors Followers icons High-Quality Vector Icons Collection with Editable Stroke. Ideal for Professional and Creative Projects.
Free with trial Abstract digital graph with orange and blue lines. Concept represents finance marketing business chart growth financial trading, data analysis tech currency statistic index trend. Decrease statistics illustrations Abstract digital graph with orange and blue lines. Concept represents finance marketing business chart growth financial trading
Free with trial Cost reduction chart displayed on a mobile device held by a hand shows a declining trend representing financial analysis business strategy and investment planning indicating potential market downturn. Decrease statistics illustrations Cost reduction chart financial analysis business strategy investment planning market trend economic forecast data. Cost reduction chart displayed on a mobile device held by a hand shows a declining trend representing financial analysis business strategy and investment planning indicating potential market downturn
Free with trial Description: This abstract image represents the concept of a financial crisis in the stock market, with a gold arrow pointing downwards on a blue background. The downtrend symbolizes a decline in stock prices and economic instability. The contrasting colors of gold and blue create a visually striking and impactful representation of the unpredictable nature of financial markets. This image conveys themes of uncertainty, risk, and the interconnectedness of global economies. Decrease statistics illustrations Abstract financial stock market trading chart with gold arrow downtrend on blue background. Description: This abstract image represents the concept of a financial crisis in the stock market, with a gold arrow pointing downwards on a blue background. The downtrend symbolizes a decline in stock prices and economic instability. The contrasting colors of gold and blue create a visually striking and impactful representation of the unpredictable nature of financial markets. This image conveys themes of uncertainty, risk, and the interconnectedness of global economies.
Free with trial A vibrant depiction of the American flag overlaid with financial graphs, conveying economic activity and market fluctuations. The colors are bold and dynamic, reflecting financial markets' volatile nature and patriotic symbolism. Decrease statistics illustrations American flag merged with fluctuating financial graph, symbolizing economic trends and stock market dynamics. A vibrant depiction of the American flag overlaid with financial graphs, conveying economic activity and market fluctuations. The colors are bold and dynamic, reflecting financial markets' volatile nature and patriotic symbolism.
Free with trial Flat Design Illustration of NPL Risk Analysis with Declining Bar Chart, Highlighting Financial Trends and Risks. Ideal. Decrease statistics illustrations Flat Design Illustration of NPL Risk Analysis with Declining Bar Chart, Highlighting Financial Trends and Risks. Ideal
Free with trial A graph showing a downward trend of two values over time from 1990 to 2023 with a world map background. Decrease statistics illustrations Global Trend Analysis Graph. A graph showing a downward trend of two values over time from 1990 to 2023 with a world map background. A graph showing a downward trend of two values over time from 1990 to 2023 with a world map background.
Free with trial Flag with a declining bar chart and down arrows, symbolizing decline in data, performance, or various national indicators in the. Decrease statistics illustrations Flag with a declining bar chart and down arrows, symbolizing decline in data, performance, or various national indicators in the
Free with trial Gambia flag with a declining bar chart and down arrows, symbolizing decline in data, performance, or various national indicators. Decrease statistics illustrations Flag with a declining bar chart and down arrows, symbolizing decline in data, performance, or various national indicators in the
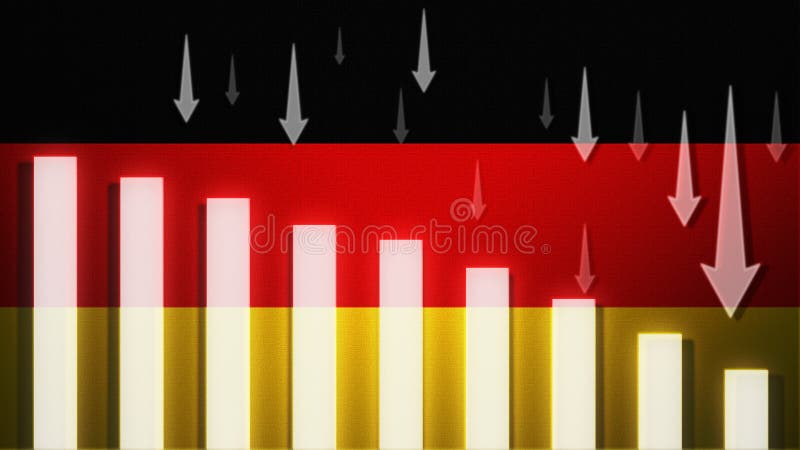
Free with trial Germany flag with a declining bar chart and down arrows, symbolizing decline in data, performance, or various national indicators. Decrease statistics illustrations Flag with a declining bar chart and down arrows, symbolizing decline in data, performance, or various national indicators in the
Free with trial Estonia flag with a declining bar chart and down arrows, symbolizing decline in data, performance, or various national indicators. Decrease statistics illustrations Flag with a declining bar chart and down arrows, symbolizing decline in data, performance, or various national indicators in the
Free with trial Azerbaijan flag with a declining bar chart and down arrows, symbolizing decline in data, performance, or various national indicators. Decrease statistics illustrations Flag with a declining bar chart and down arrows, symbolizing decline in data, performance, or various national indicators in the
Free with trial Burkina Faso flag with a declining bar chart and down arrows, symbolizing decline in data, performance, or various national indicators. Decrease statistics illustrations Flag with a declining bar chart and down arrows, symbolizing decline in data, performance, or various national indicators in the
Free with trial Bangladesh flag with a declining bar chart and down arrows, symbolizing decline in data, performance, or various national indicators. Decrease statistics illustrations Flag with a declining bar chart and down arrows, symbolizing decline in data, performance, or various national indicators in the
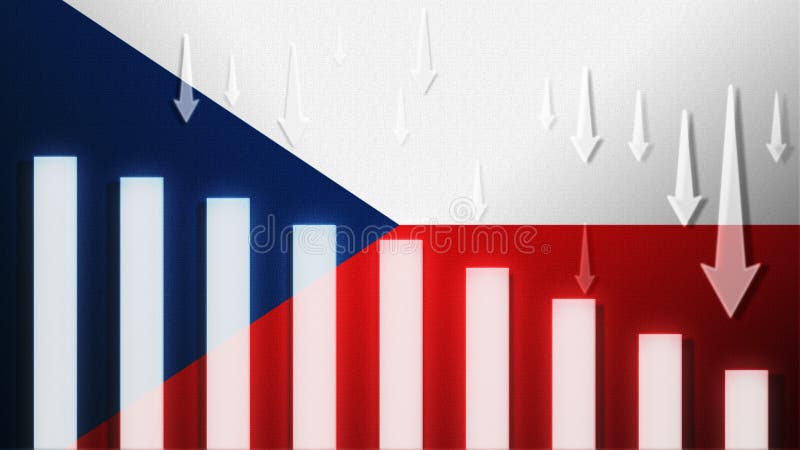
Free with trial Czech Republic flag with a declining bar chart and down arrows, symbolizing decline in data, performance, or various national indicators. Decrease statistics illustrations Flag with a declining bar chart and down arrows, symbolizing decline in data, performance, or various national indicators in the. Czech Republic flag with a declining bar chart and down arrows, symbolizing decline in data, performance, or various national indicators
Free with trial Botswana flag with a declining bar chart and down arrows, symbolizing decline in data, performance, or various national indicators. Decrease statistics illustrations Flag with a declining bar chart and down arrows, symbolizing decline in data, performance, or various national indicators in the
Free with trial Finland flag with a declining bar chart and down arrows, symbolizing decline in data, performance, or various national indicators. Decrease statistics illustrations Flag with a declining bar chart and down arrows, symbolizing decline in data, performance, or various national indicators in the
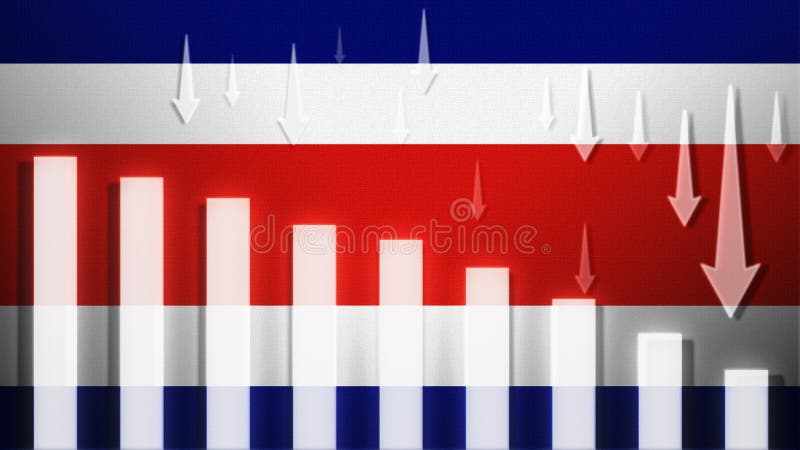
Free with trial Costa Rica flag with a declining bar chart and down arrows, symbolizing decline in data, performance, or various national indicators. Decrease statistics illustrations Flag with a declining bar chart and down arrows, symbolizing decline in data, performance, or various national indicators in the
Free with trial Cyprus flag with a declining bar chart and down arrows, symbolizing decline in data, performance, or various national indicators. Decrease statistics illustrations Flag with a declining bar chart and down arrows, symbolizing decline in data, performance, or various national indicators in the
Free with trial Flag with a declining bar chart and down arrows, symbolizing decline in data, performance, or various national indicators in the. Decrease statistics illustrations Flag with a declining bar chart and down arrows, symbolizing decline in data, performance, or various national indicators in the
Free with trial Bahamas flag with a declining bar chart and down arrows, symbolizing decline in data, performance, or various national indicators. Decrease statistics illustrations Flag with a declining bar chart and down arrows, symbolizing decline in data, performance, or various national indicators in the
Free with trial Belgium flag with a declining bar chart and down arrows, symbolizing decline in data, performance, or various national indicators. Decrease statistics illustrations Flag with a declining bar chart and down arrows, symbolizing decline in data, performance, or various national indicators in the
Free with trial Denmark flag with a declining bar chart and down arrows, symbolizing decline in data, performance, or various national indicators. Decrease statistics illustrations Flag with a declining bar chart and down arrows, symbolizing decline in data, performance, or various national indicators in the
Free with trial Bulgaria flag with a declining bar chart and down arrows, symbolizing decline in data, performance, or various national indicators. Decrease statistics illustrations Flag with a declining bar chart and down arrows, symbolizing decline in data, performance, or various national indicators in the
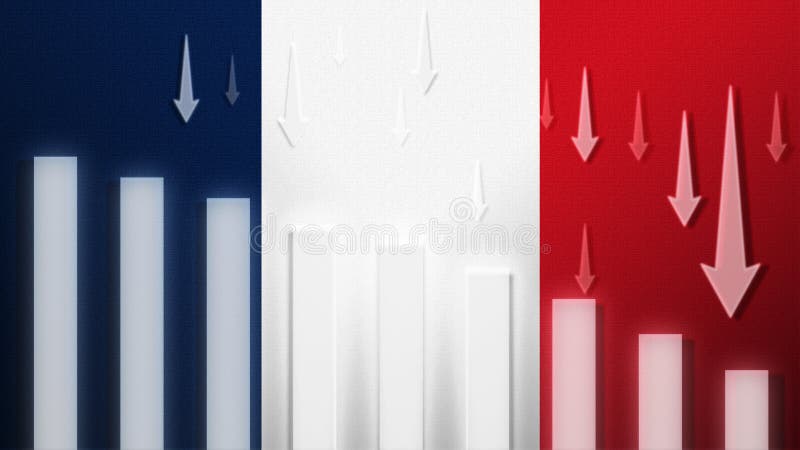
Free with trial France flag with a declining bar chart and down arrows, symbolizing decline in data, performance, or various national indicators. Decrease statistics illustrations Flag with a declining bar chart and down arrows, symbolizing decline in data, performance, or various national indicators in the
Free with trial Canada flag with a declining bar chart and down arrows, symbolizing decline in data, performance, or various national indicators. Decrease statistics illustrations Flag with a declining bar chart and down arrows, symbolizing decline in data, performance, or various national indicators in the
Free with trial Colombia flag with a declining bar chart and down arrows, symbolizing decline in data, performance, or various national indicators. Decrease statistics illustrations Flag with a declining bar chart and down arrows, symbolizing decline in data, performance, or various national indicators in the
Free with trial Algeria flag with a declining bar chart and down arrows, symbolizing decline in data, performance, or various national indicators. Decrease statistics illustrations Flag with a declining bar chart and down arrows, symbolizing decline in data, performance, or various national indicators in the
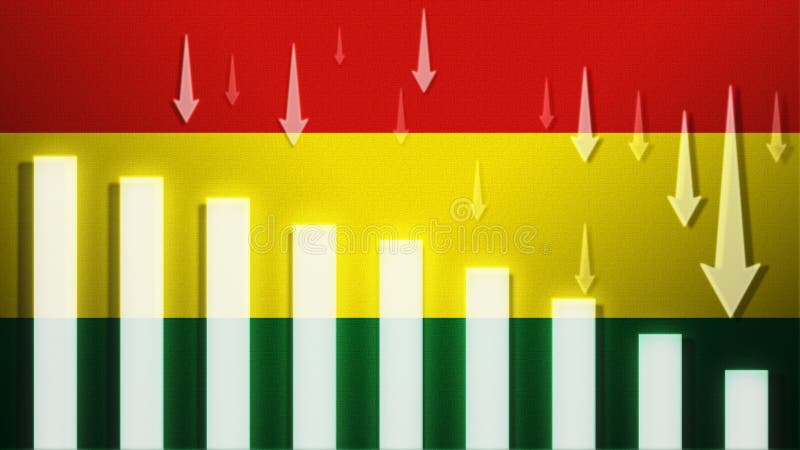
Free with trial Bolivia flag with a declining bar chart and down arrows, symbolizing decline in data, performance, or various national indicators. Decrease statistics illustrations Flag with a declining bar chart and down arrows, symbolizing decline in data, performance, or various national indicators in the
Free with trial Bahrain flag with a declining bar chart and down arrows, symbolizing decline in data, performance, or various national indicators. Decrease statistics illustrations Flag with a declining bar chart and down arrows, symbolizing decline in data, performance, or various national indicators in the
Free with trial Flag with a declining bar chart and down arrows, symbolizing decline in data, performance, or various national indicators in the. Decrease statistics illustrations Flag with a declining bar chart and down arrows, symbolizing decline in data, performance, or various national indicators in the
Free with trial Albania flag with a declining bar chart and down arrows, symbolizing decline in data, performance, or various national indicators. Decrease statistics illustrations Flag with a declining bar chart and down arrows, symbolizing decline in data, performance, or various national indicators in the
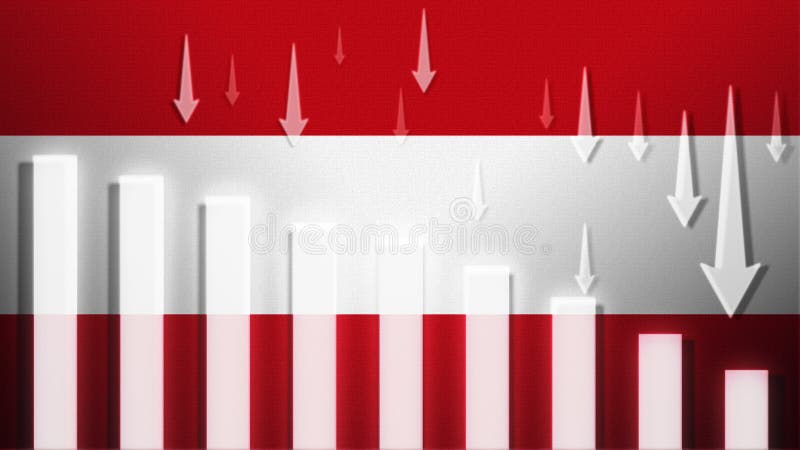
Free with trial Austria flag with a declining bar chart and down arrows, symbolizing decline in data, performance, or various national indicators. Decrease statistics illustrations Flag with a declining bar chart and down arrows, symbolizing decline in data, performance, or various national indicators in the
Free with trial Argentina flag with a declining bar chart and down arrows, symbolizing decline in data, performance, or various national indicators. Decrease statistics illustrations Flag with a declining bar chart and down arrows, symbolizing decline in data, performance, or various national indicators in the
Free with trial Black background. Motion. Blurry pixel graphics that sway slowly in different directions in abstraction. High quality 4k footage. Decrease statistics illustrations Black background. Motion.Blurry pixel graphics that sway slowly in different directions in abstraction.
Free with trial Clean red line graph shows a steep decline against white, emphasizing negative space. Decrease statistics illustrations Minimalist red line graph showing sharp decline on white background, clean lines, negative space. Clean red line graph shows a steep decline against white, emphasizing negative space.
Free with trial Clean red line graph shows a steep decline against white, emphasizing negative space. Decrease statistics illustrations Minimalist red line graph showing sharp decline on white background, clean lines, negative space. Clean red line graph shows a steep decline against white, emphasizing negative space.
Free with trial Clean red line graph shows a steep decline against white, emphasizing negative space. Decrease statistics illustrations Minimalist red line graph showing sharp decline on white background, clean lines, negative space. Clean red line graph shows a steep decline against white, emphasizing negative space.
Free with trial Realistic financial graphs index number analysis business investment market economy and trading concept. Generative AI glowing lines and diagram on digital screen charts crypto data blur light line. Decrease statistics illustrations Trading market financial graphs and glowing lines diagram on digital neural network AI generated art. Realistic financial graphs index number analysis business investment market economy and trading concept. Generative AI glowing lines and diagram on digital screen charts crypto data blur light line
Free with trial Realistic financial graphs index number analysis business investment market economy and trading concept. Generative AI glowing lines and diagram on digital screen charts crypto data blur light line. Decrease statistics illustrations Trading market financial graphs and glowing lines diagram on digital neural network AI generated art. Realistic financial graphs index number analysis business investment market economy and trading concept. Generative AI glowing lines and diagram on digital screen charts crypto data blur light line
Free with trial Realistic financial graphs index number analysis business investment market economy and trading concept. Generative AI glowing lines and diagram on digital screen charts crypto data blur light line. Decrease statistics illustrations Trading market financial graphs and glowing lines diagram on digital neural network AI generated art. Realistic financial graphs index number analysis business investment market economy and trading concept. Generative AI glowing lines and diagram on digital screen charts crypto data blur light line