Free with trial Hand drawn bar chart with a downward red arrow and sale tag illustrating a business recession or price drop. Decrease statistics vectors Hand drawn bar chart with a downward red arrow and sale tag illustrating a business recession or price drop
Free with trial A dynamic image showcasing digital financial data and fluctuating stock market graphs. the red lines suggest market volatility, providing a powerful visual for economic analysis, investment strategies, or financial presentations. Generative AI. Decrease statistics illustrations Stock Market Volatility Concept with Digital Financial Data and Graph Displays for Economic Analysis Generative AI. A dynamic image showcasing digital financial data and fluctuating stock market graphs. the red lines suggest market volatility, providing a powerful visual for economic analysis, investment strategies, or financial presentations. Generative AI
Free with trial Slovenia flag with a declining bar chart and down arrows, symbolizing decline in data, performance, or various national indicators in the country. Decrease statistics illustrations Flag with a declining bar chart and down arrows
Free with trial Market crash analysis, businessman analyst using magnifying glass to look at red arrow on crash chart. Decrease statistics vectors Market crash analysis, businessman analyst using magnifying glass to look at red arrow on crash chart
Free with trial Three light-blue cylindrical shapes, vertically arranged, forming a bar graph, against a pale teal background. Decrease statistics illustrations Three light-blue cylindrical shapes, vertically arranged, forming a bar graph, against a pale teal background
Free with trial Line Graph Chart Solid Icon. Data Analysis, Trend Visualization, And Statistical Representation Silhouette Symbol. Business And Financial Insights. Isolated Vector Illustration. Decrease statistics vectors Line Graph Chart Solid Icon. Data Analysis, Trend Visualization, And Statistical Representation Silhouette Symbol
Free with trial Abstract bar graph chart background representing stock market trade growth and financial investment success ideal for business analysis economic data visualization and corporate finance concept designs. Decrease statistics illustrations Abstract bar graph chart stock market trade background showing upward growth financial investment concept. Abstract bar graph chart background representing stock market trade growth and financial investment success ideal for business analysis economic data visualization and corporate finance concept designs
Free with trial Column chart sign. Salaryman, gender equality and alert bell outline icons. Decreasing graph line icon. Crisis diagram symbol. Spy or profile placeholder icon. Vector. Decrease statistics vectors Decreasing graph line icon. Crisis chart sign. Salaryman, gender equality and alert bell. Vector. Column chart sign. Salaryman, gender equality and alert bell outline icons. Decreasing graph line icon. Crisis diagram symbol. Decreasing graph line sign. Spy or profile placeholder icon. Vector
Free with trial Column chart sign. Salaryman, gender equality and alert bell outline icons. Decreasing graph line icon. Crisis diagram symbol. Spy or profile placeholder icon. Vector. Decrease statistics illustrations Decreasing graph line icon. Crisis chart sign. Salaryman, gender equality and alert bell. Vector. Column chart sign. Salaryman, gender equality and alert bell outline icons. Decreasing graph line icon. Crisis diagram symbol. Decreasing graph line sign. Spy or profile placeholder icon. Vector
Free with trial Colorful 3D bar graph illustrating contrasting trends: growth and decline. Symbolizes business fluctuations, market volatility, economic change, opposing forces, and progress. Ideal for promoting your services or creating eye-catching visuals. Open area for featuring your products, copy space, banner, advertisement. . Generative AI. Decrease statistics illustrations Rising and Falling Bar Graph Colorful 3D bar graph illustrating contrasting trends growth and decline Symbolizes business. Colorful 3D bar graph illustrating contrasting trends: growth and decline. Symbolizes business fluctuations, market volatility, economic change, opposing forces, and progress. Ideal for promoting your services or creating eye-catching visuals. Open area for featuring your products, copy space, banner, advertisement. . Generative AI
Free with trial A grid of 28 simple black line art icons on a white background depicting various financial charts graphs and business related symbols including bar charts pie charts computers and money. Decrease statistics vectors Collection of 28 minimalist line art icons representing financial data charts and business concepts graph. A grid of 28 simple black line art icons on a white background depicting various financial charts graphs and business related symbols including bar charts pie charts computers and money
Free with trial Visualizing cost reduction strategies in business, a hand places an arrow indicating decreasing costs on a graph, highlighting financial management and efficiency. 200 chars. Decrease statistics illustrations Reduce costs strategy business finance management budget planning investment savings efficiency 100 chars. visualizing cost reduction strategies in business, a hand places an arrow indicating decreasing costs on a graph, highlighting financial management and efficiency. 200 chars
Free with trial Hand drawn declining bar graph with a downward arrow illustrating a financial recession and business failure. Decrease statistics vectors Hand drawn declining bar graph with a downward arrow illustrating a financial recession and business failure
Free with trial This captivating visual depicts the fluctuating nature of online social validation. Witness a dynamic representation of falling likes and thumbs-up across various social media platforms, focusing on content related to food, live streams, and interactive notifications. The 3D animated counter visually illustrates the ebb and flow of engagement, highlighting the ephemeral nature of online. Decrease statistics illustrations Visualizing the Vanishing Social Validation Tracking Declining Likes and Engagement on Food Live Streams and 3D. This captivating visual depicts the fluctuating nature of online social validation. Witness a dynamic representation of falling likes and thumbs-up across various social media platforms, focusing on content related to food, live streams, and interactive notifications. The 3D animated counter visually illustrates the ebb and flow of engagement, highlighting the ephemeral nature of online
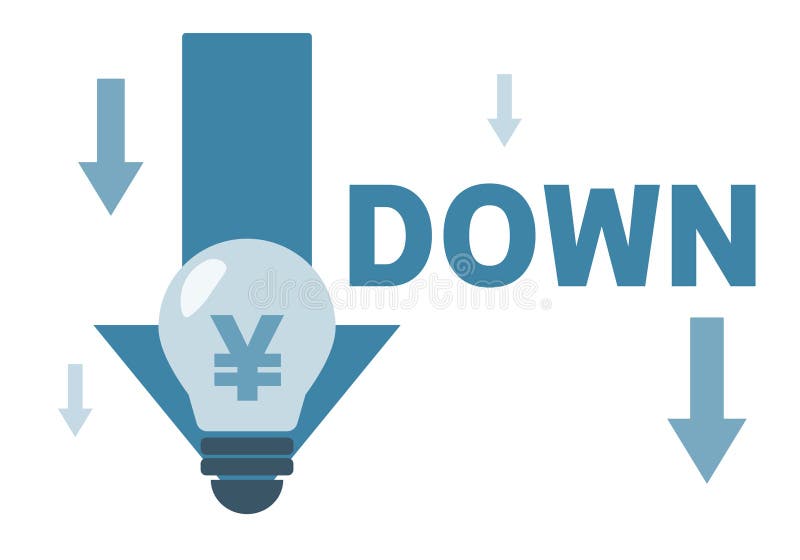
Free with trial Light bulb illustration regarding electricity bill increase decreaseImage of electricity bill. Decrease statistics vectors Light bulb illustration regarding electricity bill increase decrease
Free with trial Light bulb illustration regarding electricity bill increase decreaseImage of electricity bill. Decrease statistics vectors Light bulb illustration regarding electricity bill increase decrease
Free with trial Bar Chart With Downward Trend Line Icon. Financial Decline, Economic Recession, And Market Analysis Outline Symbol. Business Performance Tracking. Editable Stroke. Isolated Vector Illustration. Decrease statistics vectors Bar Chart With Downward Trend Line Icon. Financial Decline, Economic Recession, And Market Analysis Outline Symbol
Free with trial A visual representation of financial decline, this graphic features a bar chart with decreasing heights, topped by a sharp red arrow pointing downwards, symbolizing economic downturn. Decrease statistics illustrations Business bar chart graph shows downward trend with red arrow indicating loss isolated on white background. A visual representation of financial decline, this graphic features a bar chart with decreasing heights, topped by a sharp red arrow pointing downwards, symbolizing economic downturn
Free with trial Vector illustration of a decreasing bar chart with a downward trend arrow showing financial loss or recession. Decrease statistics vectors Vector illustration of a decreasing bar chart with a downward trend arrow showing financial loss or recession
Free with trial Hand interacting with a projected bar chart on a wall, exploring data visualization ,Generative ai. Decrease statistics illustrations Data visualization, hand engages with interactive bar chart projected on wall, exploring trends and insights. Hand interacting with a projected bar chart on a wall, exploring data visualization ,Generative ai
Free with trial Bar Chart With Arrows Line And Solid Icon Set. Data Analysis, Trend Indication, Business Performance Tracking Symbols. Visual Representation Of Growth And Decline. Isolated Vector Illustration. Decrease statistics vectors Bar Chart With Arrows Line And Solid Icon Set. Data Analysis, Trend Indication, Business Performance Tracking Symbols
Free with trial Bar Chart With Downward Trend Line Solid Icon. Financial Decline, Economic Downturn, And Market Analysis Silhouette Symbol. Business Performance Tracking. Isolated Vector Illustration. Decrease statistics vectors Bar Chart With Downward Trend Line Solid Icon. Financial Decline, Economic Downturn, And Market Analysis Silhouette
Free with trial Glowing orange graph showing a downward market trend breaks through a dark surface, symbolizing decline and loss. Generated with an AI. Decrease statistics illustrations Glowing orange graph showing a downward market trend breaks through a dark surface, symbolizing decline and loss
Free with trial A 3D rendering of a percentage symbol on a yellow flag, symbolizing special offers or rates. Decrease statistics illustrations 3d rendering of a percentage symbol on a vibrant yellow waving flag, concept of discount or sale. A 3D rendering of a percentage symbol on a yellow flag, symbolizing special offers or rates
Free with trial Descending Graph Depicts a Clear Downward Trend in Business Financial Analysis and Loss Indicating Recession. Decrease statistics vectors Descending Graph Depicts a Clear Downward Trend in Business Financial Analysis and Loss Indicating Recession
Free with trial Vibrant bar chart visualization with dark background displaying data trends ,Generative ai. Decrease statistics illustrations Colorful bar chart on dark background, data visualization for business performance analysis and trend insights. Vibrant bar chart visualization with dark background displaying data trends ,Generative ai
Free with trial Digital tablet displaying a downward trending bar chart and arrow icon symbolizing financial loss or decline. Decrease statistics vectors Digital tablet displaying a downward trending bar chart and arrow icon symbolizing financial loss or decline
Free with trial A hand with a pen analyzes financial charts on a digital screen, highlighting investment trends, market analysis, and economic growth using visual representation of performance. Decrease statistics illustrations Analyzing financial data with pen on digital screen, showing investment trends and growth. Chart displays performance. A hand with a pen analyzes financial charts on a digital screen, highlighting investment trends, market analysis, and economic growth using visual representation of performance
Free with trial A visual representation of a financial downturn, showcasing a red graph and arrow indicating a stock market crash, economic recession, or business failure. The image conveys a sense of risk and loss. Decrease statistics illustrations Stock market crash financial crisis recession economic downturn red chart graph business failure trend down. A visual representation of a financial downturn, showcasing a red graph and arrow indicating a stock market crash, economic recession, or business failure. The image conveys a sense of risk and loss.
Free with trial A futuristic robotic hand reaches towards interactive financial charts, showcasing cutting-edge technology in data analysis and stock market trends with vivid color accents. Scalp. Decrease statistics illustrations Advanced robotic hand interacting with dynamic financial charts and graphs, artificial intelligence analysis, stock. A futuristic robotic hand reaches towards interactive financial charts, showcasing cutting-edge technology in data analysis and stock market trends with vivid color accents. Scalp
Free with trial Generative ai, The image shows a red bar graph and a red arrow pointing down on a red grid background, illustrating a significant downward trend. Decrease statistics illustrations The image shows a red and white arrow pointing down in front of a red grid background with a series of 3D red bars depicting. generative ai, The image shows a red bar graph and a red arrow pointing down on a red grid background, illustrating a significant downward trend
Free with trial A 3D render of a business chart illustrating a financial decline with a visual representation of falling data, presented on an artist's easel. Concept for economic downturn. Decrease statistics vectors 3d business graph showing a downward trend with bar chart and line on an easel stand transparent background. A 3D render of a business chart illustrating a financial decline with a visual representation of falling data, presented on an artist's easel. Concept for economic downturn
Free with trial 3D render of red and white candlestick chart with percentage symbols, symbolizing financial market analysis, stock trading, cryptocurrency, and investment trends in a modern style. Decrease statistics illustrations 3D render of red and white candlestick chart with percentage symbols, symbolizing financial market analysis, stock trading
Free with trial Hand drawn bar graph showing a downward trend with a sale tag for discounts price reductions and market decline. Decrease statistics vectors Hand drawn bar graph showing a downward trend with a sale tag for discounts price reductions and market decline
Free with trial Financial downturn concept. Three stacks of gold coins illustrating decreasing wealth with red arrow pointing downwards symbolizing crisis and falling profits. Economic decline and budget reduction. Decrease statistics illustrations Three stacks of gold coins with red arrow pointing downwards depicting financial decline and economic crisis. Financial downturn concept. Three stacks of gold coins illustrating decreasing wealth with red arrow pointing downwards symbolizing crisis and falling profits. Economic decline and budget reduction
Free with trial A green flag waving above pink descending bar chart symbolizing decline or loss in data visualization. Generative AI. Decrease statistics illustrations Green flag waving above pink descending bar chart symbolizing decline or loss in data visualization. A green flag waving above pink descending bar chart. A green flag waving above pink descending bar chart symbolizing decline or loss in data visualization. Generative AI
Free with trial Generative ai, The image shows a bar chart with a red arrow pointing down, indicating a downward trend in a financial market. The glowing blue bars represent rising values, while the red arrow signifies a drop in value,. Decrease statistics illustrations The image shows a blue and red graph with a red arrow pointing downwards, illustrating a decline in a company stock price. generative ai, The image shows a bar chart with a red arrow pointing down, indicating a downward trend in a financial market. The glowing blue bars represent rising values, while the red arrow signifies a drop in value,
Free with trial A dynamic stock market chart against a blurred city skyline, symbolizing financial growth and investment opportunities. it represents the intersection of urban finance and economic trends, showcasing potential. Decrease statistics illustrations Stock market analysis chart with city skyline background for financial investment growth concept. a dynamic stock market chart against a blurred city skyline, symbolizing financial growth and investment opportunities. it represents the intersection of urban finance and economic trends, showcasing potential.
Free with trial Hand Drawn Graphic Chart Showing Initial Growth then Downward Trend to Final State Illustrating Business Cycle. Decrease statistics vectors Hand Drawn Graphic Chart Showing Initial Growth then Downward Trend to Final State Illustrating Business Cycle
Free with trial This infographic illustrates a crucial aspect of data analysis: recognizing and interpreting downward trends. The chart clearly displays a decreasing arrow, highlighting a negative slope and a reduction in value over time. Understanding these downward trends is critical in various fields, from finance and business to investment and market analysis. The visual representation aids in quickly. Decrease statistics illustrations Analyzing Downward Trends in Data A Comprehensive Guide to Understanding Decreasing Charts and Graphs in Business. This infographic illustrates a crucial aspect of data analysis: recognizing and interpreting downward trends. The chart clearly displays a decreasing arrow, highlighting a negative slope and a reduction in value over time. Understanding these downward trends is critical in various fields, from finance and business to investment and market analysis. The visual representation aids in quickly
Free with trial Bar Chart With Downward Arrow Line Icon. Business Decline, Financial Loss, And Market Downturn Outline Symbol. Economic Analysis And Trend Tracking. Editable Stroke. Isolated Vector Illustration. Decrease statistics vectors Bar Chart With Downward Arrow Line Icon. Business Decline, Financial Loss, And Market Downturn Outline Symbol. Economic
Free with trial Slovenia Country Flag hand drawing illustration vector-based drawing. Decrease statistics vectors Slovenia Country Flag hand drawing illustration vector based drawing
Free with trial A gleaming gold coin with a ridged edge is depicted against a clean white background. The coin's face features a black circular inset containing a golden bar chart with bars decreasing in height from left to right, accompanied by a downward-pointing arrow. This visual represents financial decline or economic loss. Decrease statistics illustrations Gold Coin with Black Circle Featuring a Downward Trending Bar Chart and Arrow Keywords: coin, gold, money, finance, business. A gleaming gold coin with a ridged edge is depicted against a clean white background. The coin's face features a black circular inset containing a golden bar chart with bars decreasing in height from left to right, accompanied by a downward-pointing arrow. This visual represents financial decline or economic loss
Free with trial Colorful data visualization with various charts and graphs. Visual representation of growth and performance metrics, breathtaking wallpaper background Generative AI. Decrease statistics illustrations Colorful data visualization with various charts and graphs. Visual representation of growth and performance metrics
Free with trial A bar chart with a downward-pointing red arrow and decreasing black bars symbolizing loss and failure. Finance, business, and economics concept. Decrease statistics illustrations A bar chart with a downward-pointing red arrow and decreasing black bars symbolizing loss and failure. Finance, business, and
Free with trial Financial Loss, Economic Downturn, And Business Decline Symbol Collection. Declining Bar Chart With Downward Arrow Line And Solid Icon Set. Market Analysis. Isolated Vector Illustration. Decrease statistics vectors Financial Loss, Economic Downturn, And Business Decline Symbol Collection. Declining Bar Chart With Downward Arrow Line
Free with trial Analyzing the Decline: Understanding the Downward Trend in Graph Data and Its Implications. Decrease statistics illustrations Analyzing the Decline Understanding the Downward Trend in Graph Data and Its Implications
Free with trial Analyzing the Decline: Understanding the Downward Trend in Graph Data and Its Implications. Decrease statistics illustrations Analyzing the Decline Understanding the Downward Trend in Graph Data and Its Implications
Free with trial Analyzing the Decline: Understanding the Downward Trend in Graph Data and Its Implications. Decrease statistics illustrations Analyzing the Decline: Understanding the Downward Trend in Graph Data and Its Implications
Free with trial Generative ai, The image is a red stock market chart with a large red arrow pointing down. The chart is on a red and black grid. It shows a sharp decline in a stock price. This suggests that there is a recession or downturn in the economy. Decrease statistics illustrations The image is a red graph with a large red arrow pointing downwards, signifying a decline in an economic or market trend, on a red. generative ai, The image is a red stock market chart with a large red arrow pointing down. The chart is on a red and black grid. It shows a sharp decline in a stock price. This suggests that there is a recession or downturn in the economy
Free with trial Abstract red line chart graphic shows market decline. Digital data screen displays, finance failure. Economy drops down. Background bokeh lights. Decrease statistics illustrations Abstract red line chart graphic shows market decline. Digital data screen displays finance failure. Economy drops down. Abstract red line chart graphic shows market decline. Digital data screen displays, finance failure. Economy drops down. Background bokeh lights.
Free with trial Upward and downward arrows with a percentage symbol. An illustration of arrows pointing up and down, often used to represent changes, fluctuations, or progress, along with a percentage symbol. Decrease statistics vectors Upward and Downward Arrows with Percentage, Financial Growth and Decline Concept. Upward and downward arrows with a percentage symbol. An illustration of arrows pointing up and down, often used to represent changes, fluctuations, or progress, along with a percentage symbol.
Free with trial Crumbling bar graph made of earth-colored material, symbolizing decline or instability, stands among broken debris on a plain background. Decrease statistics illustrations A collapsed bar graph made of earth-colored material, symbolizing decline or instability, is set amid broken debris. crumbling bar graph made of earth-colored material, symbolizing decline or instability, stands among broken debris on a plain background.
Free with trial Red stock market chart decreasing. Financial trading background, investment risk concept. Economic crisis, market crash, index fall. Bear market trend with digital data volatility on. Decrease statistics illustrations Red stock market chart decreasing. Financial trading background, investment risk concept. Economic crisis, market crash, index
Free with trial Visualizes the economic downturn in india with a declining chart and arrow. Illustrates financial crisis, market crash, and investment losses. Represents a business downfall and trade decline. Decrease statistics illustrations India economy recession chart financial crisis stock market crash business downfall investment loss trade decline. visualizes the economic downturn in india with a declining chart and arrow. Illustrates financial crisis, market crash, and investment losses. Represents a business downfall and trade decline.
Free with trial Digital tablet icon displaying a bar chart with a downward trend arrow and percentage sign, indicating decline or loss. Decrease statistics vectors Digital tablet icon displaying a bar chart with a downward trend arrow and percentage sign, indicating decline or loss
Free with trial Thailand flag with a declining bar chart and down arrows, symbolizing decline in data, performance, or various national indicators in the country. Decrease statistics illustrations Flag with a declining bar chart and down arrows
Free with trial Tunisia flag with a declining bar chart and down arrows, symbolizing decline in data, performance, or various national indicators in the country. Decrease statistics illustrations Flag with a declining bar chart and down arrows
Free with trial Sudan flag with a declining bar chart and down arrows, symbolizing decline in data, performance, or various national indicators in the country. Decrease statistics illustrations Flag with a declining bar chart and down arrows
Free with trial Turkmenistan flag with a declining bar chart and down arrows, symbolizing decline in data, performance, or various national indicators in the country. Decrease statistics illustrations Flag with a declining bar chart and down arrows
Free with trial Sri Lanka flag with a declining bar chart and down arrows, symbolizing decline in data, performance, or various national indicators in the country. Decrease statistics illustrations Flag with a declining bar chart and down arrows
Free with trial Singapore flag with a declining bar chart and down arrows, symbolizing decline in data, performance, or various national indicators in the country. Decrease statistics illustrations Flag with a declining bar chart and down arrows
Free with trial Sweden flag with a declining bar chart and down arrows, symbolizing decline in data, performance, or various national indicators in the country. Decrease statistics illustrations Flag with a declining bar chart and down arrows
Free with trial Tajikistan flag with a declining bar chart and down arrows, symbolizing decline in data, performance, or various national indicators in the country. Decrease statistics illustrations Flag with a declining bar chart and down arrows
Free with trial Trinidad and Tobago flag with a declining bar chart and down arrows, symbolizing decline in data, performance, or various national indicators in the country. Decrease statistics illustrations Flag with a declining bar chart and down arrows
Free with trial Slovakia flag with a declining bar chart and down arrows, symbolizing decline in data, performance, or various national indicators in the country. Decrease statistics illustrations Flag with a declining bar chart and down arrows
Free with trial Suriname flag with a declining bar chart and down arrows, symbolizing decline in data, performance, or various national indicators in the country. Decrease statistics illustrations Flag with a declining bar chart and down arrows
Free with trial Spain flag with a declining bar chart and down arrows, symbolizing decline in data, performance, or various national indicators in the country. Decrease statistics illustrations Flag with a declining bar chart and down arrows
Free with trial Somalia flag with a declining bar chart and down arrows, symbolizing decline in data, performance, or various national indicators in the country. Decrease statistics illustrations Flag with a declining bar chart and down arrows
Free with trial Tanzania flag with a declining bar chart and down arrows, symbolizing decline in data, performance, or various national indicators in the country. Decrease statistics illustrations Flag with a declining bar chart and down arrows
Free with trial Serbia flag with a declining bar chart and down arrows, symbolizing decline in data, performance, or various national indicators in the country. Decrease statistics illustrations Flag with a declining bar chart and down arrows
Free with trial South Africa flag with a declining bar chart and down arrows, symbolizing decline in data, performance, or various national indicators in the country. Decrease statistics illustrations Flag with a declining bar chart and down arrows
Free with trial Rwanda flag with a declining bar chart and down arrows, symbolizing decline in data, performance, or various national indicators in the country. Decrease statistics illustrations Flag with a declining bar chart and down arrows
Free with trial Republic of the Congo flag with a declining bar chart and down arrows, symbolizing decline in data, performance, or various national indicators in the country. Decrease statistics illustrations Flag with a declining bar chart and down arrows
Free with trial Senegal flag with a declining bar chart and down arrows, symbolizing decline in data, performance, or various national indicators in the country. Decrease statistics illustrations Flag with a declining bar chart and down arrows
Free with trial A vibrant infographic visualizes global consumption trends using circular graphs and colorful gradients This modern data visualization effectively presents worldwide consumption patterns, highlighting key insights for business analysis, market research, and economic reporting Ideal for presentations and publications, its design ensures easy data comprehension AI Generative. Decrease statistics illustrations Abstract Infographic Global Consumption Trends Visualization with Circular Graphs and Colorful Gradients Modern Data Visualization. A vibrant infographic visualizes global consumption trends using circular graphs and colorful gradients This modern data visualization effectively presents worldwide consumption patterns, highlighting key insights for business analysis, market research, and economic reporting Ideal for presentations and publications, its design ensures easy data comprehension AI Generative
Free with trial An interest rate percentage sign with a downward trend arrow in the sky. illustrating the effects on the economy, Generated AI. Decrease statistics illustrations An interest rate percentage sign with a downward trend arrow in the sky, illustrating the effects on the economy, Generated AI
Free with trial Wooden blocks show opposing directional arrows, contrasting trends choices. One block features red up arrow, black down arrow, representing progress decline. Symbols convey concepts of. Decrease statistics illustrations Wooden blocks show opposing directional arrows, contrasting trends choices. One block features red up arrow, black down arrow
Free with trial Infographic world map with charts, graphs, and data visualizations for business reports, presentations, and website content, vibrant background Generative AI. Decrease statistics illustrations Infographic world map with charts, graphs, and data visualizations for business reports, presentations, and website content
Free with trial Visual representation of a declining real estate market using a bar chart with houses perched atop each descending bar suggesting a downward trend in property values or sales. Decrease statistics illustrations Real estate market decline represented by descending bars with miniature houses conceptualizing financial downturn. Visual representation of a declining real estate market using a bar chart with houses perched atop each descending bar suggesting a downward trend in property values or sales