Free with trial A man in a blue suit holds a glowing blue bar graph showing increasing quality and decreasing cost with arrows and text. Decrease statistics illustrations Businessman holding glowing bar graph showing cost reduction and quality increase. A man in a blue suit holds a glowing blue bar graph showing increasing quality and decreasing cost with arrows and text
Free with trial A circular icon with a thick gold border contains a golden DNA helix symbol on a black background. To the right of the DNA helix, two jagged arrows point downwards, indicating a downward trend or decline. The overall design is sleek and symbolic, suggesting concepts related to genetic research, health trends, or scientific data analysis. Decrease statistics illustrations Golden DNA Helix Icon with Downward Trend Arrows on Black Circle with Gold Border genetics. A circular icon with a thick gold border contains a golden DNA helix symbol on a black background. To the right of the DNA helix, two jagged arrows point downwards, indicating a downward trend or decline. The overall design is sleek and symbolic, suggesting concepts related to genetic research, health trends, or scientific data analysis
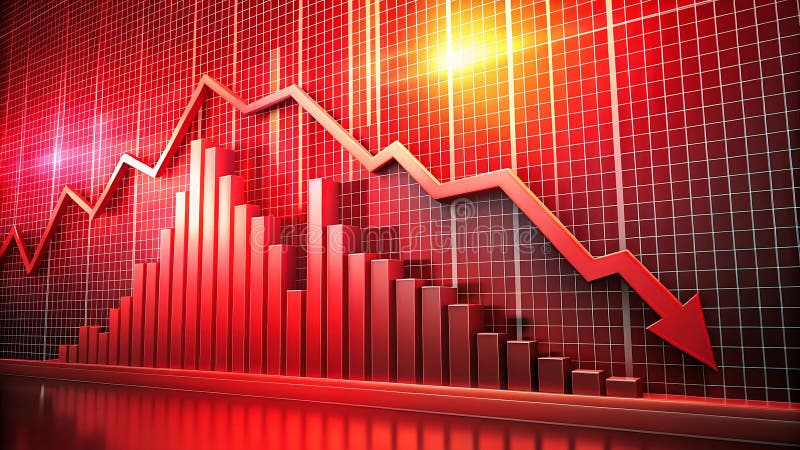
Free with trial Stock market chart featuring a red downtrend line against a black background, fluctuations in financial data. perfect for illustrating concepts in finance, investment analysis, and economic downturns. Generative AI. Decrease statistics illustrations Dynamic Stock Market Analysis with Red Downtrend Line on Black Background Generative AI. Stock market chart featuring a red downtrend line against a black background, fluctuations in financial data. perfect for illustrating concepts in finance, investment analysis, and economic downturns. Generative AI
Free with trial A digital stock market chart showing a downward trend arrow against a blue and black background, illustrating an economic downturn concept. Decrease statistics illustrations A digital stock market chart showing a downward trend arrow against a blue and black background, illustrating an economic downturn
Free with trial Falling economy. Vector illustration. A comprehensive approach is needed to address root causes economic decline The falling economy serves as reminder importance prudent financial management. Decrease statistics vectors Falling economy. Government intervention becomes necessary to address challenges posed by falling economy. Falling economy. Vector illustration. A comprehensive approach is needed to address root causes economic decline The falling economy serves as reminder importance prudent financial management
Free with trial A Red bar graph representing data growth on wooden surface, showcasing trends and analysis, Generative AI. Decrease statistics illustrations Red bar graph representing data growth on wooden surface, showcasing trends and analysis
Free with trial Visualize decreasing business performance with this striking image. A pink 3D bar chart graphically represents a decline in financial data, highlighting loss and reduction. The falling graph is juxtaposed with a healthy green plant in a pot, emphasizing the contrast between success and setbacks. Ideal for illustrating economic concepts, investment challenges, or business performance issues, Created AI. Decrease statistics illustrations Decreasing business performance represented by pink graphic and potted green plant. Visualize decreasing business performance with this striking image. A pink 3D bar chart graphically represents a decline in financial data, highlighting loss and reduction. The falling graph is juxtaposed with a healthy green plant in a pot, emphasizing the contrast between success and setbacks. Ideal for illustrating economic concepts, investment challenges, or business performance issues, Created AI
Free with trial A 3D graphic shows a gold Bitcoin coin next to a blue bar graph with a red downward arrow indicating a trend. Decrease statistics illustrations 3 D Bitcoin coin with blue bar graph and red downward arrow cryptocurrency finance. A 3D graphic shows a gold Bitcoin coin next to a blue bar graph with a red downward arrow indicating a trend
Free with trial Downward trending graph with red and black bars on a whiteboard mounted on an easel. Decrease statistics illustrations Whiteboard displaying a downward trending graph with red and black bars chart data. Downward trending graph with red and black bars on a whiteboard mounted on an easel
Free with trial A downward trending bar graph in sand symbolizes economic downturn. A dead branch emphasizes decline and crisis. Financial instability concept. Decrease statistics illustrations Declining Business Graph Sand Desert Branch Stock Visual: Financial Crisis Metaphor. A downward trending bar graph in sand symbolizes economic downturn. A dead branch emphasizes decline and crisis. Financial instability concept
Free with trial Steep downward trending red line graph with an arrow on a whiteboard mounted on an easel. Decrease statistics illustrations Whiteboard showing a steep downward trending red line graph on an easel chart data. Steep downward trending red line graph with an arrow on a whiteboard mounted on an easel
Free with trial High-detail image showing a dynamic orange graph line representing financial data trends and market fluctuations. Ideal for finance and business themes. Decrease statistics illustrations Dynamic Orange Graph Line Representing Financial Data Trends and Market Fluctuations
Free with trial Modern line icon of a percentage symbol inside a circular gauge for financial concepts. Decrease statistics vectors Modern line icon of a percentage symbol inside a circular gauge for financial concepts
Free with trial Doodle style illustration of a decreasing bar graph with a downward arrow, economy icon. Decrease statistics vectors Doodle style illustration of a decreasing bar graph with a downward arrow, economy icon
Free with trial This 3D rendering showcases a vibrant bar chart illustrating business growth and financial performance. The colorful cylinders represent data points, rising to show increasing success. A line graph adds additional information about trends over time. Decrease statistics illustrations Colorful 3D Bar Chart with Growth Graph Showing Business Success and Financial Data. This 3D rendering showcases a vibrant bar chart illustrating business growth and financial performance. The colorful cylinders represent data points, rising to show increasing success. A line graph adds additional information about trends over time.
Free with trial Blue arrow pointing downward on financial graph. Business chart showing descending trend. Digital stock market data visualization for decline analysis. Decrease statistics illustrations Blue arrow pointing downward on financial graph. Business chart showing descending trend
Free with trial This image captures the concept of business growth and the importance of cost reduction The image features a person working on a laptop and a tablet with digital arrows indicating profit increasing and cost decreasing It emphasizes the need to balance both factors to achieve overall success in business. Decrease statistics illustrations Business growth and cost reduction concept with technology application illustration. This image captures the concept of business growth and the importance of cost reduction The image features a person working on a laptop and a tablet with digital arrows indicating profit increasing and cost decreasing It emphasizes the need to balance both factors to achieve overall success in business
Free with trial Meta tags with sample numbers for stock market. Decrease statistics illustrations Meta tags with sample numbers for stock market
Free with trial Meta tags with sample numbers for stock market. Decrease statistics illustrations Meta tags with sample numbers for stock market
Free with trial Meta tags with sample numbers for stock market. Decrease statistics illustrations Meta tags with sample numbers for stock market
Free with trial Meta tags with sample numbers for stock market. Decrease statistics illustrations Meta tags with sample numbers for stock market
Free with trial Analytics graph line icon. Continuous one line with curl. Column chart sign. Growth diagram symbol. Analytics graph single outline ribbon. Loop curve pattern. Vector. Decrease statistics illustrations Analytics graph line icon. Column chart sign. Continuous line with curl. Vector. Analytics graph line icon. Continuous one line with curl. Column chart sign. Growth diagram symbol. Analytics graph single outline ribbon. Loop curve pattern. Vector
Free with trial Close-up of a modern computer screen displaying stock market data and financial charts. Decrease statistics illustrations Analyzing live stock market data on a computer screen, offering insights into trends. Close-up of a modern computer screen displaying stock market data and financial charts.
Free with trial A red arrow crashes through a stock market graph, symbolizing financial crisis. the image depicts a market crash with a falling trend, representing economic downturn and potential investment loss. Decrease statistics illustrations Red arrow crashing through stock market graph representing financial crisis and market crash. a red arrow crashes through a stock market graph, symbolizing financial crisis. the image depicts a market crash with a falling trend, representing economic downturn and potential investment loss.
Free with trial Hand drawn graph chart with arrow pointing downward showing financial decline or loss. Decrease statistics vectors Hand drawn graph chart with arrow pointing downward showing financial decline or loss
Free with trial This vibrant image showcases a 3D rendering of colorful cylinders arranged on a pink platform, overlaid with a rising line graph symbolizing upward trends and positive growth. Perfect for illustrating business success, financial progress, or marketing presentations. Decrease statistics illustrations Colorful 3D Cylinders and Rising Line Graph on Pink Platform: Business Growth Concept. This vibrant image showcases a 3D rendering of colorful cylinders arranged on a pink platform, overlaid with a rising line graph symbolizing upward trends and positive growth. Perfect for illustrating business success, financial progress, or marketing presentations.
Free with trial A digital illustration depicting a financial chart with blue and red bars and lines. Neon glows accentuate the data points. The style is abstract and modern. Decrease statistics illustrations Abstract Blue Red Financial Data Chart Graph Digital Illustration Neon Glow business. A digital illustration depicting a financial chart with blue and red bars and lines. Neon glows accentuate the data points. The style is abstract and modern
Free with trial A 3D illustration of a bar graph with a blue downward arrow, symbolizing financial decline or loss, isolated on white. Decrease statistics illustrations Bar Graph with Blue Arrow Pointing Down 3D Illustration Isolated on White Background. A 3D illustration of a bar graph with a blue downward arrow, symbolizing financial decline or loss, isolated on white.
Free with trial Simple Blue Analytics Diagram Bar Chart Showing Variable Data Trends on White Background � Simple Abstract Business and Analytics Infographic Illustration. Decrease statistics illustrations Simple Blue Analytics Diagram Bar Chart Showing Variable Data Trends on White Background
Free with trial Displaying 3D bar columns on analytics dashboard, with overlaid line graph and numeric labels. Data, visualization, dashboard, analytics, infographic, 3d, abstract. Decrease statistics illustrations Displaying 3D bar columns on analytics dashboard, with overlaid line graph and numeric labels
Free with trial This image features a bar graph representing an economic recession, highlighted by a red downward arrow indicating a decline. The visualization illustrates the negative trend in financial performance and the risks associated with an economic downturn. The background is transparent, making it suitable for various presentations. This image has been created using AI. Decrease statistics vectors Economic Recession Concept Bar Graph With Red Downward Arrow On Transparent Background. This image features a bar graph representing an economic recession, highlighted by a red downward arrow indicating a decline. The visualization illustrates the negative trend in financial performance and the risks associated with an economic downturn. The background is transparent, making it suitable for various presentations. This image has been created using AI.
Free with trial Graph line icon. Neumorphic, Flat shadow, 3d buttons. Column chart sign. Growth diagram symbol. Line graph chart icon. Social media icons. Vector. Decrease statistics vectors Graph line icon. Column chart sign. Neumorphic buttons. Vector. Graph line icon. Neumorphic, Flat shadow, 3d buttons. Column chart sign. Growth diagram symbol. Line graph chart icon. Social media icons. Vector
Free with trial Graph line icon. Neumorphic, Flat shadow, 3d buttons. Column chart sign. Ab test diagram symbol. Line graph chart icon. Social media icons. Vector. Decrease statistics vectors Graph line icon. Column chart sign. Neumorphic buttons. Vector. Graph line icon. Neumorphic, Flat shadow, 3d buttons. Column chart sign. Ab test diagram symbol. Line graph chart icon. Social media icons. Vector
Free with trial Report, 3D Chart, Block diagram and Dot Plot graph linear icons. Design shape elements. Charts and Diagrams line icons. Trend, Pyramid and Pie chart report symbols. Vector. Decrease statistics vectors Charts and Diagrams line icons. Set of 3D Chart, Block diagram and Dot Plot graph icons. Design elements. Vector. Report, 3D Chart, Block diagram and Dot Plot graph linear icons. Design shape elements. Charts and Diagrams line icons. Trend, Pyramid and Pie chart report symbols. Vector
Free with trial A 3D rendered pink bar graph stands on a white background, with three bars of decreasing height from left to right. A curved pink arrow, also trending downwards, originates from the top of the tallest bar and points towards the right, visually representing a decline or negative trend. Decrease statistics illustrations Pink bar graph with a downward trending arrow indicating decline on a white background. A 3D rendered pink bar graph stands on a white background, with three bars of decreasing height from left to right. A curved pink arrow, also trending downwards, originates from the top of the tallest bar and points towards the right, visually representing a decline or negative trend
Free with trial A detailed gold coin is shown against a white background. The face of the coin features a black circular inset displaying a golden bar chart with five bars of decreasing height, indicating a downward trend. A golden arrow points downwards along the trend line, reinforcing the concept of decline or loss. The coin has a ribbed edge, typical of real currency. This image represents financial decline,. Decrease statistics illustrations Gold Coin with Black Circle Displaying Downward Bar Chart and Arrow currency finance. A detailed gold coin is shown against a white background. The face of the coin features a black circular inset displaying a golden bar chart with five bars of decreasing height, indicating a downward trend. A golden arrow points downwards along the trend line, reinforcing the concept of decline or loss. The coin has a ribbed edge, typical of real currency. This image represents financial decline,
Free with trial A 3D illustration depicting financial concepts. A purple rectangular bar shows a sharp red downward trending arrow. Below it, another purple bar displays a candlestick chart with red and blue bars. To the right, a magnifying glass with an orange handle and turquoise lens hovers, suggesting analysis. A small, colorful pie chart with red, yellow, and blue segments is positioned to the left. The. Decrease statistics illustrations 3D Financial Downward Trend Chart with Magnifying Glass and Pie Chart finance stock market. A 3D illustration depicting financial concepts. A purple rectangular bar shows a sharp red downward trending arrow. Below it, another purple bar displays a candlestick chart with red and blue bars. To the right, a magnifying glass with an orange handle and turquoise lens hovers, suggesting analysis. A small, colorful pie chart with red, yellow, and blue segments is positioned to the left. The
Free with trial Arrow trend-down icon vector set on white background. EPS 10. Decrease statistics vectors Arrow trend-down icon isolated on white background. Arrow trend-down icon vector set on white background. EPS 10
Free with trial A 3D bar chart displays four bars in descending order of height: green, purple, blue, and pink, set against a white background. Clear details and vibrant colors enhance visual appeal. Decrease statistics illustrations 3D Bar Chart With Green Purple Blue And Pink Bars In Descending Order graph decrease. A 3D bar chart displays four bars in descending order of height: green, purple, blue, and pink, set against a white background. Clear details and vibrant colors enhance visual appeal
Free with trial Happy and sad businessman from rising and falling chart. Business success and failure infographic. Man sitting at computer table. Office manager. Startup project growth. Stock exchange. Vector concept. Decrease statistics vectors Happy and sad businessman from rising and falling chart. Business success and failure infographic. Man sitting at computer table
Free with trial Arrow trend-down icon vector set on white background. EPS 10. Decrease statistics vectors Arrow trend-down icon isolated on white background. Arrow trend-down icon vector set on white background. EPS 10
Free with trial Arrow trend-down icon vector set on white background. EPS 10. Decrease statistics vectors Arrow trend-down icon isolated on white background. Arrow trend-down icon vector set on white background. EPS 10
Free with trial Arrow trend-down icon vector set on white background. EPS 10. Decrease statistics vectors Arrow trend-down icon isolated on white background. Arrow trend-down icon vector set on white background. EPS 10
Free with trial Arrow trend-down icon vector set on white background. EPS 10. Decrease statistics vectors Arrow trend-down icon isolated on white background. Arrow trend-down icon vector set on white background. EPS 10
Free with trial Arrow trend-down icon vector set on white background. EPS 10. Decrease statistics vectors Arrow trend-down icon isolated on white background. Arrow trend-down icon vector set on white background. EPS 10
Free with trial Declining graph showing a financial or business downturn, with bar chart and arrow down. Decrease statistics vectors Declining graph showing a financial or business downturn, with bar chart and arrow down
Free with trial Falling Sales: Declining Chart with Tag, Downward Trend Arrow and Business Graph Concept. Decrease statistics vectors Falling Sales: Declining Chart with Tag, Downward Trend Arrow and Business Graph Concept
Free with trial Bar Graph Illustration Showing Downward Trend Represented by Candles with Dripping Wax. Decrease statistics vectors Bar Graph Illustration Showing Downward Trend Represented by Candles with Dripping Wax
Free with trial Rising thick red arrow filling grid lines in design studio, with blue pink charts, dotted bars. Financial, analytics, data, visualization, digital, technology, infographic. Decrease statistics illustrations Rising thick red arrow filling grid lines in design studio, with blue pink charts, dotted bars
Free with trial 3D Pie chart icon. Circle divided into parts statistical diagram vector illustration. 3D render. Decrease statistics vectors 3D Pie chart icon circle divided into parts statistical diagram vector illustration. 3D render.
Free with trial Elevate your marketing efforts with this eye-catching 10% discount sale banner. Perfect for online and offline promotions, this left-aligned design boasts a clean, modern aesthetic. Vibrant colors and impactful typography create a visually engaging experience, grabbing attention and encouraging immediate action. The generous copy space allows for easy customization with your unique brand. Decrease statistics illustrations Drive Sales with a Modern 10 Discount Sale Banner Minimalist Design for Maximum Impact. Elevate your marketing efforts with this eye-catching 10% discount sale banner. Perfect for online and offline promotions, this left-aligned design boasts a clean, modern aesthetic. Vibrant colors and impactful typography create a visually engaging experience, grabbing attention and encouraging immediate action. The generous copy space allows for easy customization with your unique brand
Free with trial 3D infographics analyze trade deficits? impact on imports, exports, and economy. Decrease statistics illustrations Analyzing economic effects of trade deficits with 3D infographics on imports and exports. 3D infographics analyze trade deficits? impact on imports, exports, and economy
Free with trial A red stock market decline is shown with a bar chart against a dark background. The image conveys a sense of financial crisis and economic downturn, visually representing negative trends. Decrease statistics illustrations Red Stock Market Decline Graphic Bar Chart Financial Crisis Concept on Dark Background. A red stock market decline is shown with a bar chart against a dark background. The image conveys a sense of financial crisis and economic downturn, visually representing negative trends
Free with trial US GDP decline with American flag and down arrow. 3D rendering isolated on white background. Decrease statistics illustrations US GDP decline with American flag and down arrow. 3D rendering. Isolated on white background
Free with trial This 3D rendered image shows three stacks of gold coins of varying heights arranged from left to right. A thick red arrow, forming a downward trend line, is positioned diagonally from the top left to the bottom right, pointing towards the smallest stack of coins. The background is a solid, soft pink color. Decrease statistics illustrations 3D Rendering of Falling Red Arrow Over Stacks of Gold Coins on a Pink Background finance. This 3D rendered image shows three stacks of gold coins of varying heights arranged from left to right. A thick red arrow, forming a downward trend line, is positioned diagonally from the top left to the bottom right, pointing towards the smallest stack of coins. The background is a solid, soft pink color
Free with trial A 3D pie chart with three colored segments (pink, blue, and teal) is shown against a solid purple background. A yellow circle with a white upward arrow is positioned to the left of the chart, and a pink circle with a white downward arrow is to the right. Decrease statistics illustrations 3D Pie Chart With Up and Down Arrows Indicating Growth and Decline on a Purple Background. A 3D pie chart with three colored segments (pink, blue, and teal) is shown against a solid purple background. A yellow circle with a white upward arrow is positioned to the left of the chart, and a pink circle with a white downward arrow is to the right
Free with trial Red bar graph showing a negative trend with a downward arrow against a red wall. Artistic render. Generative AI. Decrease statistics illustrations Red bar graph showing a negative trend with a downward arrow against a red wall. Generative AI. Red bar graph showing a negative trend with a downward arrow against a red wall. Artistic render. Generative AI
Free with trial Diagram chart line icon. Neumorphic, Flat shadow, 3d buttons. Presentation graph sign. Market analytics symbol. Line diagram chart icon. Social media icons. Vector. Decrease statistics vectors Diagram chart line icon. Presentation graph sign. Neumorphic buttons. Vector. Diagram chart line icon. Neumorphic, Flat shadow, 3d buttons. Presentation graph sign. Market analytics symbol. Line diagram chart icon. Social media icons. Vector
Free with trial Bar chart graph. Colorful falling arrow. Financial data analysis. Vector business symbol. EPS 10. Decrease statistics vectors Bar chart graph. Colorful falling arrow. Financial data analysis. Vector business symbol.
Free with trial Hand drawn bar chart with declining arrow showing economic recession and financial loss. Decrease statistics vectors Hand drawn bar chart with declining arrow showing economic recession and financial loss
Free with trial Close-up view of a computer monitor displaying a vibrant bar chart, indicating data analysis and progress tracking ,Generative ai. Decrease statistics illustrations Computer monitor displaying a colorful bar chart for data analysis and progress tracking. Close-up view of a computer monitor displaying a vibrant bar chart, indicating data analysis and progress tracking ,Generative ai
Free with trial A striking visual representation of two contrasting trends, one rising and the other falling, depicted through elegant gradient colors in sharp focus. Decrease statistics illustrations Dynamic Contrast of Trends Illustrated Through a Gradient Wave in a Vibrant Display of Colors. A striking visual representation of two contrasting trends, one rising and the other falling, depicted through elegant gradient colors in sharp focus
Free with trial Coins down or money dropping with Business decline downward arrow trend isolated object on white background with Clipping path, The concept of the trend of financial bankruptcy, 3D rendering. Decrease statistics illustrations The concept of the trend of financial bankruptcy with Coins down or money dropping on isolated object on white background. Coins down or money dropping with Business decline downward arrow trend isolated object on white background with Clipping path, The concept of the trend of financial bankruptcy, 3D rendering
Free with trial A 3D illustration depicting financial growth. A line graph with blue and red data points ascends across a light blue background. Interspersed are green and red candlestick bars, representing market fluctuations. Stacks of gold coins and individual coins with dollar signs are arranged at the base of the chart, symbolizing wealth and investment. Decrease statistics illustrations 3D Financial Growth Chart with Stacks of Gold Coins and Candlestick Bars finance graph. A 3D illustration depicting financial growth. A line graph with blue and red data points ascends across a light blue background. Interspersed are green and red candlestick bars, representing market fluctuations. Stacks of gold coins and individual coins with dollar signs are arranged at the base of the chart, symbolizing wealth and investment
Free with trial Pie chart line icon. Halftone dotted pattern. Gradient icon with grain shadow. Presentation graph sign. Market analytics symbol. Line pie chart icon. Various designs. Vector. Decrease statistics vectors Pie chart line icon. Presentation graph sign. Halftone dotted pattern. Vector. Pie chart line icon. Halftone dotted pattern. Gradient icon with grain shadow. Presentation graph sign. Market analytics symbol. Line pie chart icon. Various designs. Vector
Free with trial Graph line icon. Continuous one line with curl. Column chart sign. Growth diagram symbol. Graph chart single outline ribbon. Loop curve pattern. Vector. Decrease statistics vectors Graph line icon. Column chart sign. Continuous line with curl. Vector. Graph line icon. Continuous one line with curl. Column chart sign. Growth diagram symbol. Graph chart single outline ribbon. Loop curve pattern. Vector
Free with trial Graph icon indicating growth and data analysis, perfect for business presentations and financial reports. visual representation of progress ,Generative ai. Decrease statistics illustrations Graph icon, a comprehensive symbol of data analysis, growth, and business trends for effective presentations. Graph icon indicating growth and data analysis, perfect for business presentations and financial reports. visual representation of progress ,Generative ai
Free with trial Graph line icon. Continuous one line with curl. Column chart sign. Growth diagram symbol. Graph chart single outline ribbon. Loop curve pattern. Vector. Decrease statistics vectors Graph line icon. Column chart sign. Continuous line with curl. Vector. Graph line icon. Continuous one line with curl. Column chart sign. Growth diagram symbol. Graph chart single outline ribbon. Loop curve pattern. Vector
Free with trial A close-up view of a hand holding a magnifying glass over a business graph, emphasizing the analysis of data trends and performance insights. Decrease statistics illustrations Analysis of Data Trends with Magnifying Glass on Business Graph for Detailed Observation. A close-up view of a hand holding a magnifying glass over a business graph, emphasizing the analysis of data trends and performance insights
Free with trial Vibrant Digital Financial Analysis With Colorful Graphs And Data Visualization On Screen. Generative AI. Decrease statistics illustrations Vibrant Digital Financial Analysis With Colorful Graphs And Data Visualization On Screen
Free with trial Red bar chart displays performance metrics on a table ,Generative ai. Decrease statistics illustrations Red bar chart illustrating performance metrics on a table, data analysis and visualization. Red bar chart displays performance metrics on a table ,Generative ai
Free with trial A red arrow crashes through a stock market graph displayed on a tablet screen. the scene is set against a dark blue background, symbolizing financial crisis and economic downturn. it represents loss and risk. Decrease statistics illustrations Red arrow crashing through stock market graph on tablet screen in a dark blue background. a red arrow crashes through a stock market graph displayed on a tablet screen. the scene is set against a dark blue background, symbolizing financial crisis and economic downturn. it represents loss and risk.
Free with trial Colorful growth chart with red and teal bars showing upward and downward arrows on a light background representing data trends progress decline business performance and financial analytics visual. Decrease statistics illustrations Colorful growth chart with red and teal bars and upward and downward arrows on light background. colorful growth chart with red and teal bars showing upward and downward arrows on a light background representing data trends progress decline business performance and financial analytics visual
Free with trial Hand interacting with a red downward trend line against a blue bar graph background image. Generative AI. Decrease statistics illustrations Hand interacting with a red downward trend line against a blue bar graph background image
Free with trial Generative ai, The image is of a red bar graph and a red line graph. The line graph is going down, and the bar graph is going down. The image is set against a red background. The image is most likely representing a financial decline. It is a striki. Decrease statistics illustrations A red bar graph and line graph displays a downward trend, with the bar graph decreasing in height and the line graph going down. generative ai, The image is of a red bar graph and a red line graph. The line graph is going down, and the bar graph is going down. The image is set against a red background. The image is most likely representing a financial decline. It is a striki
Free with trial Square Format Infographic Poster Bold Typography Charts 1 Upscaled 4X clean composition. Featuring square, format, infographic. Neutral, commercial-friendly, with room for copy. Decrease statistics illustrations Square Format Infographic Poster Bold Typography Charts 1 Upscaled 4X clean composition
Free with trial A minimalist 3D render displays three rounded rectangular bars representing a bar graph. The tallest bar is a soft blue, followed by a medium green bar, and the shortest is a light pink bar. They are arranged in descending order of height and stand on a plain white background, suggesting data visualization or progress. Decrease statistics illustrations Three colorful 3D bar graph elements in blue green and pink on a white background chart. A minimalist 3D render displays three rounded rectangular bars representing a bar graph. The tallest bar is a soft blue, followed by a medium green bar, and the shortest is a light pink bar. They are arranged in descending order of height and stand on a plain white background, suggesting data visualization or progress
Free with trial Graph line icon. Continuous line with share plane. Column chart sign. Growth diagram symbol. 3d heart in speech bubble. Graph chart single line ribbon. Loop curve pattern. Vector. Decrease statistics illustrations Graph line icon. Column chart sign. Continuous line with plane. Vector. Graph line icon. Continuous line with share plane. Column chart sign. Growth diagram symbol. 3d heart in speech bubble. Graph chart single line ribbon. Loop curve pattern. Vector
Free with trial Declining chart icon. Downward trend symbol. Falling graph illustration. Simple vector design. EPS 10. Decrease statistics vectors Declining chart icon. Downward trend symbol. Falling graph illustration. Simple vector design.
Free with trial This vibrant image showcases a collection of colorful 3D charts and graphs, including bar graphs, pie charts, and a line graph, all illustrating positive growth. A calculator and pencil are included, emphasizing the analytical and planning aspects of business success. Perfect for illustrating finan. Decrease statistics illustrations Colorful 3D Financial Charts and Graphs with Calculator for Business Growth Presentation. This vibrant image showcases a collection of colorful 3D charts and graphs, including bar graphs, pie charts, and a line graph, all illustrating positive growth. A calculator and pencil are included, emphasizing the analytical and planning aspects of business success. Perfect for illustrating finan