Free with trial Five concentric, hand-drawn hearts are depicted, each outlined in bright red on a transparent background. The hearts decrease in size from the outermost to the innermost, centered perfectly within one another. The outlines are smooth and bold, creating a visually appealing, symmetrical design that focuses on the theme of love and affection. The transparent background allows for versatile use in various digital or printed contexts. Decrease illustrations Red hand-drawn heart illustration isolated on transparent background. Five concentric, hand-drawn hearts are depicted, each outlined in bright red on a transparent background. The hearts decrease in size from the outermost to the innermost, centered perfectly within one another. The outlines are smooth and bold, creating a visually appealing, symmetrical design that focuses on the theme of love and affection. The transparent background allows for versatile use in various digital or printed contexts.
Free with trial A 3D rendered bar chart illustrating a significant downward trend. Three blue, rounded bars are displayed on a clean white background with subtle grid lines. A prominent, bold red arrow sharply descends across the bars, clearly indicating a decline, decrease, or negative progression. This graphic is ideal for representing financial losses, market downturns, business challenges, economic recession, or any statistical data showing a negative trend. It conveys concepts of risk, failure, and reduction in a clear, impactful visual manner for presentations, reports, and analytical content. Decrease vectors Downward Trend Bar Chart with Red Arrow. A 3D rendered bar chart illustrating a significant downward trend. Three blue, rounded bars are displayed on a clean white background with subtle grid lines. A prominent, bold red arrow sharply descends across the bars, clearly indicating a decline, decrease, or negative progression. This graphic is ideal for representing financial losses, market downturns, business challenges, economic recession, or any statistical data showing a negative trend. It conveys concepts of risk, failure, and reduction in a clear, impactful visual manner for presentations, reports, and analytical content.
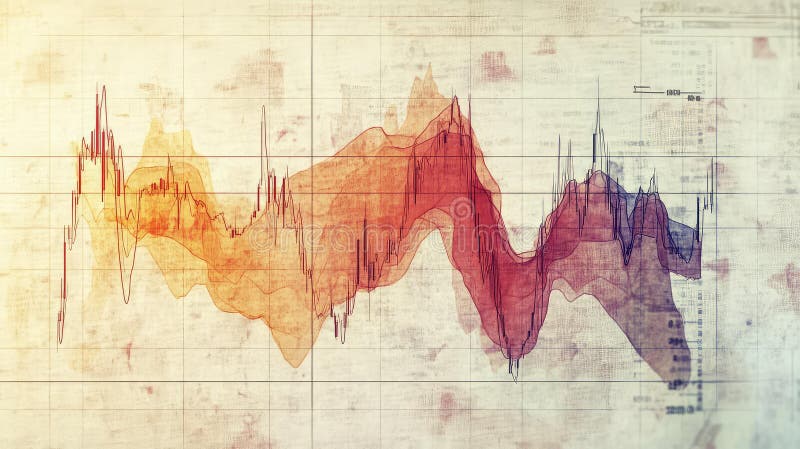
Free with trial Financial difficulties, decrease in value of business or company shares, stock market crash, economic crisis, business failure, loss of cash, lose investments, businessman running across the word crisis. Decrease vectors Financial difficulties
Free with trial The dots vary in size, creating a dynamic, gradient-like effect where they appear larger in one corner and gradually decrease in size towards the opposite corner. The repetition and color contrast give the image a vibrant and eye-catching appearance. This design might be used in pop art or graphic design for its bold visual impact. Decrease illustrations Bright red background with a pattern of evenly spaced yellow dots. The dots vary in size, creating a dynamic, gradient-like effect where they appear larger in one corner and gradually decrease in size towards the opposite corner. The repetition and color contrast give the image a vibrant and eye-catching appearance. This design might be used in pop art or graphic design for its bold visual impact.
Free with trial Hand-drawn heart illustration featuring four concentric hearts in varying shades of pink, placed against a transparent background. The hearts decrease in size towards the center, creating a layered effect. The design has a playful and whimsical doodle style, often used in crafts and decorative art. The use of bold, vivid pink tones enhances the heart's visual appeal, making it ideal for themes of love and affection. Decrease vectors Pink hand-drawn heart illustration isolated on transparent background. Hand-drawn heart illustration featuring four concentric hearts in varying shades of pink, placed against a transparent background. The hearts decrease in size towards the center, creating a layered effect. The design has a playful and whimsical doodle style, often used in crafts and decorative art. The use of bold, vivid pink tones enhances the heart's visual appeal, making it ideal for themes of love and affection.
Free with trial Vector illustration featuring three stylized Christmas trees isolated on a white background. Each tree is composed of stacked conical shapes, resembling cones. The trees are displayed in three different colors: blue, yellow, and green. They are arranged in a horizontal line, each with a smooth, shiny texture, suggesting a modern, simplified design. The conical segments decrease in size as they ascend, creating a layered appearance typical of Christmas tree shapes. Decrease vectors Vector set of realistic christmas tree isolated on white background. Vector illustration featuring three stylized Christmas trees isolated on a white background. Each tree is composed of stacked conical shapes, resembling cones. The trees are displayed in three different colors: blue, yellow, and green. They are arranged in a horizontal line, each with a smooth, shiny texture, suggesting a modern, simplified design. The conical segments decrease in size as they ascend, creating a layered appearance typical of Christmas tree shapes.
Free with trial A clear, minimalist illustration featuring two distinct arrows on a clean white background. On the left, a blue arrow points downwards, symbolizing concepts like decrease, decline, or negative trends. On the right, a vibrant green arrow points upwards, representing increase, growth, improvement, or positive movement. Rendered in a modern flat design style, this versatile graphic is ideal for conveying directional changes, comparisons, data trends, or navigation in user interfaces, presentations, infographics, and educational content. Decrease illustrations Green Up and Blue Down Arrows. A clear, minimalist illustration featuring two distinct arrows on a clean white background. On the left, a blue arrow points downwards, symbolizing concepts like decrease, decline, or negative trends. On the right, a vibrant green arrow points upwards, representing increase, growth, improvement, or positive movement. Rendered in a modern flat design style, this versatile graphic is ideal for conveying directional changes, comparisons, data trends, or navigation in user interfaces, presentations, infographics, and educational content.
Free with trial Radiating yellow sunburst pattern set against a lighter yellow background. The central point is a bright yellow circle, with numerous linear rays extending outward in a uniform manner, suggesting light or energy emanating from a central source. The rays decrease in intensity towards the edges, creating a gradient effect. The overall composition gives an impression of warmth and illumination. Decrease illustrations Radiating yellow sunburst pattern set against a lighter yellow background
Free with trial The image features a bold, red arrow that descends in a jagged, zigzag pattern, symbolizing a decline or decrease in a measurable quantity. Decrease illustrations A red downward pointing arrow with a jagged path indicating decline. The image features a bold, red arrow that descends in a jagged, zigzag pattern, symbolizing a decline or decrease in a measurable quantity
Free with trial The image features two arrows, one pointing upwards and the other pointing downwards. The upward-pointing arrow has a euro symbol (€) on it, indicating an increase or appreciation in the value of the euro. The downward-pointing arrow has a dollar symbol ($) on it, indicating a decrease or depreciation in the value of the dollar. Decrease illustrations Currency exchange indicators. The image features two arrows, one pointing upwards and the other pointing downwards. The upward-pointing arrow has a euro symbol (€) on it, indicating an increase or appreciation in the value of the euro. The downward-pointing arrow has a dollar symbol ($) on it, indicating a decrease or depreciation in the value of the dollar
Free with trial Hand adjusting speaker volume. The image depicts a hand adjusting the volume dial on a green speaker. The speaker is prominently featured in the center, with the hand turning the knob to increase or decrease the volume. The background includes various geometric shapes and patterns in shades of green, orange, and white, adding a dynamic and artistic touch to the overall composition. Decrease illustrations Hand adjusting speaker volume
Free with trial One continuous line of a minus sign. Minimalist line art drawing of a mathematical subtraction symbol or a dash in one line art style. Vector illustration symbolizing negative value, decrease, or removal with a black stroke. Decrease vectors One continuous line of a minus sign. Minimalist line art drawing of a mathematical symbol. One continuous line of a minus sign. Minimalist line art drawing of a mathematical subtraction symbol or a dash in one line art style. Vector illustration symbolizing negative value, decrease, or removal with a black stroke.
Free with trial A light beige background with a gradient of horizontal orange stripes. The stripes are evenly spaced and gradually decrease in opacity, creating a subtle, smooth transition effect across the image. The overall design is simple and abstract, emphasizing the contrast between the two warm colors. Decrease illustrations A light beige background with a gradient of horizontal orange stripes.
Free with trial The image depicts two arrows representing the exchange rates of the Euro (€) and the US Dollar ($). The Euro is shown with an upward arrow, indicating an increase in value, while the US Dollar is shown with a downward arrow, indicating a decrease in value. This visual representation highlights the contrasting movements in the currency exchange rates between the two major currencies. Decrease illustrations Currency exchange fluctuations. The image depicts two arrows representing the exchange rates of the Euro (€) and the US Dollar ($). The Euro is shown with an upward arrow, indicating an increase in value, while the US Dollar is shown with a downward arrow, indicating a decrease in value. This visual representation highlights the contrasting movements in the currency exchange rates between the two major currencies
Free with trial The graph displays two lines, one green and one red. The green line is ascending, indicating growth or progress, while the red line is descending, suggesting a decline or decrease. Decrease illustrations A graph with a green line and a red line. The graph displays two lines, one green and one red. The green line is ascending, indicating growth or progress, while the red line is descending, suggesting a decline or decrease
Free with trial The image shows a hand adjusting a wooden block with a percentage symbol on top and a downward arrow on the bottom block. This visual metaphor likely represents a decrease in percentage or a reduction in some metric. Decrease illustrations Hand adjusting percentage block. The image shows a hand adjusting a wooden block with a percentage symbol on top and a downward arrow on the bottom block. This visual metaphor likely represents a decrease in percentage or a reduction in some metric
Free with trial A simple line art icon illustration showing a decreasing bar chart with an arrow pointing downward. This minimalist design is suitable for presentations, websites, and other visuals related to financial loss, economic downturn, or market decline. Decrease vectors Simple Line Art Decrease Chart Icon Illustration for Financial Report. A simple line art icon illustration showing a decreasing bar chart with an arrow pointing downward. This minimalist design is suitable for presentations, websites, and other visuals related to financial loss, economic downturn, or market decline.
Free with trial Financial graph with green and red pointers, Business strategy, Business concept, Price increase, Price decrease. Decrease vectors Financial graph with green and red pointers, Business strategy, Business concept
Free with trial Financial graph with green and red pointers, Business strategy, Business concept, Price increase, Price decrease. Decrease vectors Financial graph with green and red pointers, Business strategy, Business concept
Free with trial Financial graph with green and red pointers, Business strategy, Business concept, Price increase, Price decrease. Decrease vectors Financial graph with green and red pointers, Business strategy, Business concept
Free with trial Business people interacting with large yellow percentage sign and downward arrow, symbolizing economic inflation decrease, tax reduction, and financial improvement, isolated vector illustration. Decrease vectors People Lowering Percentage Symbol for Tax Relief. Business people interacting with large yellow percentage sign and downward arrow, symbolizing economic inflation decrease, tax reduction, and financial improvement, isolated vector illustration
Free with trial A bar graph with a downward trend highlighted in neon colors, illustrating a decrease in values over time. Decrease illustrations Graph showing a downward trend over time. A bar graph with a downward trend highlighted in neon colors, illustrating a decrease in values over time
Free with trial Yellow sad emoticon and green pants next to stylized line graph with nodes. Ideal for fashion industry, sales decrease, trends, dissatisfaction, analysis, loss, economics. Simple flat metaphor. Decrease illustrations Sad face with pants and graph chart symbolizing loss or decline in trends or fashion demand. Yellow sad emoticon and green pants next to stylized line graph with nodes. Ideal for fashion industry, sales decrease, trends, dissatisfaction, analysis, loss, economics. Simple flat metaphor
Free with trial The image depicts a bar graph with a downward trend. The bars, which start at a higher value on the left, progressively decrease in height towards the right. A large red arrow, pointing downwards, emphasizes the declining trend. This visual representation suggests a continuous decrease in performance, sales, or another measured metric over a specified period. Decrease illustrations Decline in performance over time. The image depicts a bar graph with a downward trend. The bars, which start at a higher value on the left, progressively decrease in height towards the right. A large red arrow, pointing downwards, emphasizes the declining trend. This visual representation suggests a continuous decrease in performance, sales, or another measured metric over a specified period
Free with trial This bar and line graph illustrates a declining trend in data values over a period of months. The x-axis represents time in months from January to December, while the y-axis shows the values ranging from 0 to 800. The red bars indicate the monthly data values, and the red line represents the overall trend. The trend shows a consistent decrease in values from January to December. Decrease illustrations Decline in monthly data over time. This bar and line graph illustrates a declining trend in data values over a period of months. The x-axis represents time in months from January to December, while the y-axis shows the values ranging from 0 to 800. The red bars indicate the monthly data values, and the red line represents the overall trend. The trend shows a consistent decrease in values from January to December
Free with trial A bold, three-dimensional red arrow illustrates a sharp downward trend, resembling a stock market graph or financial chart. The arrow's segmented, zigzagging path signifies decline, loss, or negative performance. Isolated on a transparent background, this graphic is versatile for representing economic downturns, business failures, or any concept of decrease and regression. Decrease illustrations Red Arrow Graph Showing Downward Trend. A bold, three-dimensional red arrow illustrates a sharp downward trend, resembling a stock market graph or financial chart. The arrow's segmented, zigzagging path signifies decline, loss, or negative performance. Isolated on a transparent background, this graphic is versatile for representing economic downturns, business failures, or any concept of decrease and regression.
Free with trial The image depicts a downward trending arrow over a triangular base, symbolizing a decline or decrease. The arrow starts at a higher point and descends, indicating a negative trend or downward movement. This could represent various concepts such as a drop in stock prices, a decline in sales, or a reduction in any measurable metric. Decrease vectors Downward trend indicating decline. The image depicts a downward trending arrow over a triangular base, symbolizing a decline or decrease. The arrow starts at a higher point and descends, indicating a negative trend or downward movement. This could represent various concepts such as a drop in stock prices, a decline in sales, or a reduction in any measurable metric
Free with trial The image depicts a bar graph with a downward trend. The bars, colored in turquoise, start at a higher value and gradually decrease in height, indicating a decline. A large red arrow, pointing downwards, further emphasizes the downward trend. Decrease illustrations Decreasing bar graph. The image depicts a bar graph with a downward trend. The bars, colored in turquoise, start at a higher value and gradually decrease in height, indicating a decline. A large red arrow, pointing downwards, further emphasizes the downward trend
Free with trial The image features a bold red zigzag arrow that is pointing downward. The arrow is composed of a series of sharp, angular lines that create a dynamic and attention-grabbing visual effect. The simplicity of the design and the use of a single color make the arrow stand out prominently against the plain white background. This type of arrow is often used to indicate a decrease, decline, or downward. Decrease illustrations Red zigzag arrow pointing downward. The image features a bold red zigzag arrow that is pointing downward. The arrow is composed of a series of sharp, angular lines that create a dynamic and attention-grabbing visual effect. The simplicity of the design and the use of a single color make the arrow stand out prominently against the plain white background. This type of arrow is often used to indicate a decrease, decline, or downward
Free with trial A vibrant pink 3D bar chart illustrates financial data with a prominent downward-trending arrow superimposed. The bars decrease in height from left to right, signifying a decline. An upward-pointing arrow is positioned at the top left, indicating a contrasting upward trend. The graphic is isolated on a white background, making it suitable for presentations on financial performance, market trends,. Decrease illustrations 3D Pink Bar Chart with Downward Trend Arrow and Upward Trend Arrow graph statistics. A vibrant pink 3D bar chart illustrates financial data with a prominent downward-trending arrow superimposed. The bars decrease in height from left to right, signifying a decline. An upward-pointing arrow is positioned at the top left, indicating a contrasting upward trend. The graphic is isolated on a white background, making it suitable for presentations on financial performance, market trends,
Free with trial The image features three stacks of gold coins arranged in a row. A large red downward-pointing arrow is positioned above the stacks, suggesting a decrease or decline. The coins are neatly stacked, and the arrow is prominent, indicating a significant drop or reduction. Decrease illustrations Stacks of coins with downward arrow. The image features three stacks of gold coins arranged in a row. A large red downward-pointing arrow is positioned above the stacks, suggesting a decrease or decline. The coins are neatly stacked, and the arrow is prominent, indicating a significant drop or reduction
Free with trial Dec collapsing line graph illustration decrease drop, fall dip, plummet slide dec collapsing line graph. Decrease illustrations Dec collapsing line graph
Free with trial 3D red gradient lightning bolt with downward arrow shape symbolizing energy drop or power decrease. Isolated on transparent background. Decrease illustrations 3D Red Lightning Bolt Down Arrow Icon. 3D red gradient lightning bolt with downward arrow shape symbolizing energy drop or power decrease. Isolated on transparent background
Free with trial The image features a percentage symbol (%), with the number zero inside it, accompanied by a red downward arrow. The objects are placed on a flat surface with a blurred green background, possibly trees or foliage. The overall scene suggests a concept of decrease or reduction. Decrease illustrations Percentage symbol with downward arrow. The image features a percentage symbol (%), with the number zero inside it, accompanied by a red downward arrow. The objects are placed on a flat surface with a blurred green background, possibly trees or foliage. The overall scene suggests a concept of decrease or reduction
Free with trial The image features a 3D-rendered purple money bag adorned with a golden dollar sign emblem. Three downward-pointing arrows are positioned above the bag, suggesting a decrease or outflow of money. The bag is sealed with a golden band, giving it a secure and official appearance. Decrease illustrations Purple money bag with downward arrows. The image features a 3D-rendered purple money bag adorned with a golden dollar sign emblem. Three downward-pointing arrows are positioned above the bag, suggesting a decrease or outflow of money. The bag is sealed with a golden band, giving it a secure and official appearance
Free with trial Monochrome Graphic Illustrating a Financial Decline or Discount. Decrease vectors Percentage Rate Decrease Symbolized by a Downward Arrow Icon. Monochrome Graphic Illustrating a Financial Decline or Discount.
Free with trial A simple illustration of a declining blue bar graph against a black background. Represents loss or decrease. Decrease vectors Declining bar graph demonstrating financial loss and recession illustration. A simple illustration of a declining blue bar graph against a black background. Represents loss or decrease.
Free with trial The image depicts symbols of currency exchange and economic growth. It features a dollar sign ($) and a euro symbol (€) with an upward arrow indicating growth. Next to the dollar sign, there is a green bar with a plus 2. 5% sign, suggesting an increase in value. Beside the euro symbol, there is a red bar with a minus 0. 5% sign, indicating a decrease in value. The overall concept highlights the. Decrease illustrations Currency exchange and economic growth
Free with trial The image depicts a 3D red arrow pointing downward, symbolizing a decline or decrease. The arrow has a gradient shading, giving it a three-dimensional appearance. This type of graphic is commonly used to represent negative trends, losses, or a downward movement in data. Decrease illustrations Red downward arrow graph. The image depicts a 3D red arrow pointing downward, symbolizing a decline or decrease. The arrow has a gradient shading, giving it a three-dimensional appearance. This type of graphic is commonly used to represent negative trends, losses, or a downward movement in data
Free with trial This image depicts sound waves emanating from a central point and spreading outwards in a symmetrical pattern. The waves are represented by concentric circles that gradually decrease in size as they move away from the source, illustrating the propagation of sound through a medium. Decrease illustrations Sound waves propagating through space. This image depicts sound waves emanating from a central point and spreading outwards in a symmetrical pattern. The waves are represented by concentric circles that gradually decrease in size as they move away from the source, illustrating the propagation of sound through a medium
Free with trial A versatile collection of colorful down arrow icons, presented in a modern flat design style. This set features a variety of arrow shapes and styles in vibrant shades of blue, green, yellow, and red, all pointing downwards on a light background. These clean, vector graphic elements are perfect for user interface (UI) design, web buttons, download symbols, infographics showing a decrease or negative trend, and navigation indicators in apps or presentations. An essential toolkit for any graphic designer's collection. Decrease vectors Colorful Flat Design Down Arrow Icon Set. A versatile collection of colorful down arrow icons, presented in a modern flat design style. This set features a variety of arrow shapes and styles in vibrant shades of blue, green, yellow, and red, all pointing downwards on a light background. These clean, vector graphic elements are perfect for user interface (UI) design, web buttons, download symbols, infographics showing a decrease or negative trend, and navigation indicators in apps or presentations. An essential toolkit for any graphic designer's collection.
Free with trial Gradient red 3D triple downward arrows, representing multiple downloads, drop, or decrease. Decrease illustrations Gradient red 3D triple downward arrows
Free with trial Gradient red 3D double downward curved arrows, symbolizing fall, decrease, or drop. Decrease illustrations Gradient red 3D Double Down Arrow Icon. gradient red 3D double downward curved arrows, symbolizing fall, decrease, or drop
Free with trial Flat graphic showing a dollar coin with arrows illustrating market fluctuation and volatility, styled as flat cartoon icon. Decrease vectors Investment Fluctuation Illustration Showing Increase and Decrease of Capital. Flat graphic showing a dollar coin with arrows illustrating market fluctuation and volatility, styled as flat cartoon icon.
Free with trial This image depicts a downward trending zigzag line in red, indicating a decline or decrease. Decrease illustrations A downward trending zigzag line in red
Free with trial Unexpected financial loss doodle line illustration concept. Sales decrease. Market downturn. Crying businessman beside declining bar graph 2D outline character isolated. Hand drawn metaphor monochrome. Decrease vectors Unexpected financial loss doodle line illustration concept
Free with trial The image depicts a Bitcoin symbol flanked by a green upward arrow and a red downward arrow. This visual representation suggests the volatility and fluctuations in the value of Bitcoin, a popular cryptocurrency. The green arrow indicates an increase in value, while the red arrow signifies a decrease. Decrease vectors Bitcoin value fluctuation. The image depicts a Bitcoin symbol flanked by a green upward arrow and a red downward arrow. This visual representation suggests the volatility and fluctuations in the value of Bitcoin, a popular cryptocurrency. The green arrow indicates an increase in value, while the red arrow signifies a decrease
Free with trial The image features a large, red downward-pointing arrow with the symbol '%' and the number '0' inside it. The arrow is set against a plain white background, creating a stark contrast. The design is simple and minimalistic, emphasizing the downward trend or decrease. Decrease illustrations Downward arrow with zero percent symbol. The image features a large, red downward-pointing arrow with the symbol '%' and the number '0' inside it. The arrow is set against a plain white background, creating a stark contrast. The design is simple and minimalistic, emphasizing the downward trend or decrease
Free with trial Arrow 3d chart graph pointer, vector illustration. Up and down forward arrow, motion and navigation symbol, financial growth concept. Web design elements crease of decrease sign. Decrease vectors Arrow navigation pointer, chart graph. Arrow 3d chart graph pointer, vector illustration. Up and down forward arrow, motion and navigation symbol, financial growth concept. Web design elements crease of decrease sign
Free with trial A bold, three-dimensional red percentage symbol (%) is depicted against a clean white background. The symbol is stylized with a downward-pointing arrow integrated into its design, suggesting a decrease or reduction. This graphic is ideal for illustrating concepts related to discounts, sales, negative growth, financial losses, or declining trends in various business and economic contexts. Decrease vectors Red Percentage Symbol with Downward Arrow. A bold, three-dimensional red percentage symbol (%) is depicted against a clean white background. The symbol is stylized with a downward-pointing arrow integrated into its design, suggesting a decrease or reduction. This graphic is ideal for illustrating concepts related to discounts, sales, negative growth, financial losses, or declining trends in various business and economic contexts.
Free with trial Four hands hold a square paper with a green cloud graphic labeled "CO? " above three downward green arroThe image depicts four hands, each belonging to a person dressed in business attire, pointing towards a white card. The card features a green cloud with the text 'CO2' inside it. Below the cloud, there are three downward-pointing green arrows, symbolizing the reduction or decrease of CO2. The overall concept conveys the idea of teamwork and collaboration in reducing carbon dioxide emissions, likely in the context of environmental sustainability or corporate responsibility. ws. The collaborative effort is symbolized by business attire, emphasizing teamwork. The image visually represents reducing carbon dioxide emissions, a critical component in addressing climate change. The white background and simple design highlight the message's clarity and importance. Decrease illustrations Team effort in reducing carbon emissions. Four hands hold a square paper with a green cloud graphic labeled "CO?" above three downward green arroThe image depicts four hands, each belonging to a person dressed in business attire, pointing towards a white card. The card features a green cloud with the text 'CO2' inside it. Below the cloud, there are three downward-pointing green arrows, symbolizing the reduction or decrease of CO2. The overall concept conveys the idea of teamwork and collaboration in reducing carbon dioxide emissions, likely in the context of environmental sustainability or corporate responsibility.ws. The collaborative effort is symbolized by business attire, emphasizing teamwork. The image visually represents reducing carbon dioxide emissions, a critical component in addressing climate change. The white background and simple design highlight the message's clarity and importance.
Free with trial Diagonal down left arrow symbol set in outline and solid styles suitable for navigation controls, trend decrease indicators, return actions, directional guidance, and interface elements. Decrease vectors Arrow Diagonal Down Left Icon Collection in Line and Solid Style for Direction. Diagonal down left arrow symbol set in outline and solid styles suitable for navigation controls, trend decrease indicators, return actions, directional guidance, and interface elements
Free with trial A bold red 3D curved arrow pointing downwards. This symbolizes a decrease in profits, economic recession, stock market crash, and negative financial trends in a business context. Decrease vectors Red 3D Curved Arrow Pointing Down Representing Market Crash and Financial Loss. A bold red 3D curved arrow pointing downwards. This symbolizes a decrease in profits, economic recession, stock market crash, and negative financial trends in a business context.
Free with trial Tiredness line icon of anemia symptom and physical disease, vector hematology. Tired or exhausted man with low energy battery outline sign of anaemia blood disorder, hemoglobin lack, oxygen decrease. Decrease illustrations Tiredness icon of anemia symptom, physical disease. Tiredness line icon of anemia symptom and physical disease, vector hematology. Tired or exhausted man with low energy battery outline sign of anaemia blood disorder, hemoglobin lack, oxygen decrease
Free with trial Consumer behavior, sustainability, e-commerce, recycling awareness, monetary trends, sales decrease. Blue arrow pointing down, recycling sign on a shopping bag and dollar coin. Consumer behavior. Decrease vectors Arrow Pointing Downward with Shopping Bag and Dollar Symbol - E-Commerce and Sustainability Concepts. Consumer behavior, sustainability, e-commerce, recycling. Consumer behavior, sustainability, e-commerce, recycling awareness, monetary trends, sales decrease. Blue arrow pointing down, recycling sign on a shopping bag and dollar coin. Consumer behavior
Free with trial Two speaker icons illustrate the volume control feature on a digital interface, with one icon indicating an increase and the other a decrease in sound levels. Decrease vectors Adjusting volume settings with plus and minus speakers displayed on a digital interface. Two speaker icons illustrate the volume control feature on a digital interface, with one icon indicating an increase and the other a decrease in sound levels.
Free with trial Economic crisis icon of price low down or stock market depreciation, vector line symbol. Global economy and business downturn with financial crisis and prices decrease or percent down low. Decrease illustrations Economic crisis icon, price low down, stock market. Economic crisis icon of price low down or stock market depreciation, vector line symbol. Global economy and business downturn with financial crisis and prices decrease or percent down low
Free with trial A visual representation of an energy efficiency rating system is displayed on a white background. It consists of seven horizontal arrows, each labeled with a letter from A (green) at the top to G (red) at the bottom. The arrows decrease in size as they go down the scale, with intermediate colors like yellow and orange representing intermediate ratings. Decrease illustrations Energy Efficiency Rating Chart with Colored Arrows from A to G graph. A visual representation of an energy efficiency rating system is displayed on a white background. It consists of seven horizontal arrows, each labeled with a letter from A (green) at the top to G (red) at the bottom. The arrows decrease in size as they go down the scale, with intermediate colors like yellow and orange representing intermediate ratings