Free with trial Set Server, Data analysis, Financial growth decrease, Pie chart infographic, and icon. Vector. Diagram financial growth decrease vectors Set Server, Data analysis, Financial growth decrease, Pie chart infographic, and icon. Vector
Free with trial Set line Pie chart infographic Sales funnel with Cloud computing lock Server Financial growth decrease Binary code and Search globe icon. Vector. Diagram financial growth decrease vectors Set line Pie chart infographic, Sales funnel with, Cloud computing lock, Server, Financial growth decrease, Binary code. Set line Pie chart infographic Sales funnel with Cloud computing lock Server Financial growth decrease Binary code and Search globe icon. Vector.
Free with trial Set line Pie chart infographic Sales funnel with Cloud computing lock Server Financial growth decrease Binary code and Search globe icon. Vector. Diagram financial growth decrease illustrations Set line Pie chart infographic, Sales funnel with, Cloud computing lock, Server, Financial growth decrease, Binary code. Set line Pie chart infographic Sales funnel with Cloud computing lock Server Financial growth decrease Binary code and Search globe icon. Vector.
Free with trial Set line Binary code Server Financial growth decrease Pie chart infographic Data analysis Network cloud connection and Search data icon. Vector. Diagram financial growth decrease vectors Set line Binary code, Server, Financial growth decrease, Pie chart infographic, Data analysis, Network cloud connection. Set line Binary code Server Financial growth decrease Pie chart infographic Data analysis Network cloud connection and Search data icon. Vector.
Free with trial Set line Binary code Server Financial growth decrease Pie chart infographic Data analysis Network cloud connection and Search data icon. Vector. Diagram financial growth decrease illustrations Set line Binary code, Server, Financial growth decrease, Pie chart infographic, Data analysis, Network cloud connection. Set line Binary code Server Financial growth decrease Pie chart infographic Data analysis Network cloud connection and Search data icon. Vector.
Free with trial Set line Financial growth Browser with exclamation mark Sales funnel chart and decrease. Business infographic template. Vector. Diagram financial growth decrease vectors Set line Financial growth, Browser with exclamation mark, Sales funnel chart and decrease. Business infographic template
Free with trial Set line Financial growth Browser with exclamation mark Sales funnel chart and decrease. Business infographic template. Vector. Diagram financial growth decrease illustrations Set line Financial growth, Browser with exclamation mark, Sales funnel chart and decrease. Business infographic template
Free with trial Set Binary code, Pie chart infographic, Data analysis and Financial growth decrease icon. Vector. Diagram financial growth decrease vectors Set Binary code, Pie chart infographic, Data analysis and Financial growth decrease icon. Vector
Free with trial Set Financial growth decrease, Pie chart infographic, Search data analysis, Server, Binary code, Data, and icon. Vector. Diagram financial growth decrease vectors Set Financial growth decrease, Pie chart infographic, Search data analysis, Server, Binary code, Data, and icon. Vector
Free with trial Set line Financial growth decrease Search data analysis Server Pie chart infographic Binary code Network cloud connection and Data icon. Vector. Diagram financial growth decrease vectors Set line Financial growth decrease, Search data analysis, Server, Pie chart infographic, Binary code, Network cloud. Set line Financial growth decrease Search data analysis Server Pie chart infographic Binary code Network cloud connection and Data icon. Vector.
Free with trial Set line Pie chart infographic Financial growth decrease Network cloud connection Binary code Data analysis and icon. Vector. Diagram financial growth decrease vectors Set line Pie chart infographic, Financial growth decrease, Network cloud connection, Binary code, Data analysis, and
Free with trial Set line Financial growth decrease Pie chart infographic Data analysis and Search data. Business infographic template. Vector. Diagram financial growth decrease illustrations Set line Financial growth decrease, Pie chart infographic, Data analysis and Search data. Business infographic template
Free with trial Set line Financial growth decrease Pie chart infographic Data analysis and Search data. Business infographic template. Vector. Diagram financial growth decrease vectors Set line Financial growth decrease, Pie chart infographic, Data analysis and Search data. Business infographic template
Free with trial Set Percent up arrow Factory Financial growth increase Mountains with flag Pie chart infographic Many ways directional decrease and Graph chart diagram icon. Vector. Diagram financial growth decrease illustrations Set Percent up arrow, Factory, Financial growth increase, Mountains with flag, Pie chart infographic, Many ways. Set Percent up arrow Factory Financial growth increase Mountains with flag Pie chart infographic Many ways directional decrease and Graph chart diagram icon. Vector.
Free with trial Set Many ways directional arrow Graph chart diagram Financial growth increase Arrow Wrench and gear and icon. Vector. Diagram financial growth decrease vectors Set Many ways directional arrow, Graph, chart, diagram, Financial growth, increase, Arrow, Wrench and gear and icon
Free with trial Set line Flag Project team base Mountains with flag Pie chart infographic Arrow Financial growth decrease Wrench and gear and Pyramid infographics icon. Vector. Diagram financial growth decrease illustrations Set line Flag, Project team base, Mountains with flag, Pie chart infographic, Arrow, Financial growth decrease, Wrench. Set line Flag Project team base Mountains with flag Pie chart infographic Arrow Financial growth decrease Wrench and gear and Pyramid infographics icon. Vector.
Free with trial Set line Arrow Many ways directional arrow Flag Pie chart infographic Financial growth Clock and decrease icon. Vector. Diagram financial growth decrease vectors Set line Arrow, Many ways directional arrow, Flag, Pie chart infographic, Financial growth, Clock and decrease icon
Free with trial Set Digital speed meter Pie chart infographic Pyramid infographics Financial growth decrease Mountains with flag and Arrow icon. Vector. Diagram financial growth decrease vectors Set Digital speed meter, Pie chart infographic, Pyramid infographics, Financial growth decrease, Mountains with flag. Set Digital speed meter Pie chart infographic Pyramid infographics Financial growth decrease Mountains with flag and Arrow icon. Vector.
Free with trial Set Dollar symbol Infographic element Financial growth decrease Flag Arrow Project team base and Hierarchy organogram chart icon. Vector. Diagram financial growth decrease vectors Set Dollar symbol, Infographic element, Financial growth decrease, Flag, Arrow, Project team base, and Hierarchy. Set Dollar symbol Infographic element Financial growth decrease Flag Arrow Project team base and Hierarchy organogram chart icon. Vector.
Free with trial Set line Pie chart infographic Many ways directional arrow Financial growth decrease Mountains with flag Arrow and Old hourglass sand icon. Vector. Diagram financial growth decrease vectors Set line Pie chart infographic, Many ways directional arrow, Financial growth decrease, Mountains with flag, Arrow, and. Set line Pie chart infographic Many ways directional arrow Financial growth decrease Mountains with flag Arrow and Old hourglass sand icon. Vector.
Free with trial Set Arrow Old hourglass with sand Financial growth decrease Layers Many ways directional arrow Light bulb and Flag icon. Vector. Diagram financial growth decrease vectors Set Arrow, Old hourglass with sand, Financial growth decrease, Layers, Many ways directional arrow, Light bulb and Flag
Free with trial Set Factory Digital speed meter Arrow Pie chart infographic Flag Financial growth decrease Location and Target icon. Vector. Diagram financial growth decrease vectors Set Factory, Digital speed meter, Arrow, Pie chart infographic, Flag, Financial growth decrease, Location and Target. Set Factory Digital speed meter Arrow Pie chart infographic Flag Financial growth decrease Location and Target icon. Vector.
Free with trial Set line Many ways directional arrow Digital speed meter Shopping bag with Sale Mountains flag Financial growth decrease Graph chart diagram and Arrow icon. Vector. Diagram financial growth decrease vectors Set line Many ways directional arrow, Digital speed meter, Shopping bag with Sale, Mountains flag, Financial growth. Set line Many ways directional arrow Digital speed meter Shopping bag with Sale Mountains flag Financial growth decrease Graph chart diagram and Arrow icon. Vector.
Free with trial Set line Old hourglass with sand Light bulb Layers Financial growth Graph chart diagram Dollar symbol Mountains flag and Arrow icon. Vector. Diagram financial growth decrease vectors Set line Old hourglass with sand, Light bulb, Layers, Financial growth, Graph, chart, diagram, Dollar symbol, Mountains. Set line Old hourglass with sand Light bulb Layers Financial growth Graph chart diagram Dollar symbol Mountains flag and Arrow icon. Vector.
Free with trial Set line Target Financial growth decrease Arrow Unknown search Many ways directional arrow and Pie chart infographic icon. Vector. Diagram financial growth decrease vectors Set line Target, Financial growth decrease, Arrow, Unknown search, Many ways directional arrow, and Pie chart. Set line Target Financial growth decrease Arrow Unknown search Many ways directional arrow and Pie chart infographic icon. Vector.
Free with trial Set line Target Financial growth decrease Arrow Unknown search Many ways directional arrow and Pie chart infographic icon. Vector. Diagram financial growth decrease illustrations Set line Target, Financial growth decrease, Arrow, Unknown search, Many ways directional arrow, and Pie chart. Set line Target Financial growth decrease Arrow Unknown search Many ways directional arrow and Pie chart infographic icon. Vector.
Free with trial Set Flag Arrow Old hourglass with sand Unknown search Financial growth decrease Pie chart infographic and Pyramid infographics icon. Vector. Diagram financial growth decrease illustrations Set Flag, Arrow, Old hourglass with sand, Unknown search, Financial growth decrease, Pie chart infographic and Pyramid. Set Flag Arrow Old hourglass with sand Unknown search Financial growth decrease Pie chart infographic and Pyramid infographics icon. Vector.
Free with trial Set Intersection point Financial growth decrease Shopping bag with Sale Location Percent up arrow Flag Target and Unknown search icon. Vector. Diagram financial growth decrease illustrations Set Intersection point, Financial growth decrease, Shopping bag with Sale, Location, Percent up arrow, Flag, Target and. Set Intersection point Financial growth decrease Shopping bag with Sale Location Percent up arrow Flag Target and Unknown search icon. Vector.
Free with trial Set Mountains with flag Financial growth decrease Dollar symbol Pie chart infographic Intersection point Arrow and icon. Vector. Diagram financial growth decrease illustrations Set Mountains with flag, Financial growth decrease, Dollar symbol, Pie chart infographic, Intersection point, Arrow, and. Set Mountains with flag Financial growth decrease Dollar symbol Pie chart infographic Intersection point Arrow and icon. Vector.
Free with trial Set Pie chart infographic Location Many ways directional arrow Clock Financial growth decrease Mountains with flag and icon. Vector. Diagram financial growth decrease vectors Set Pie chart infographic, Location, Many ways directional arrow, Clock, Financial growth decrease, Mountains with flag. Set Pie chart infographic Location Many ways directional arrow Clock Financial growth decrease Mountains with flag and icon. Vector.
Free with trial Set line Digital speed meter Intersection point Pie chart infographic Arrow Graph chart diagram Percent up arrow and Financial growth decrease icon. Vector. Diagram financial growth decrease vectors Set line Digital speed meter, Intersection point, Pie chart infographic, Arrow, Graph, chart, diagram, Percent up arrow. Set line Digital speed meter Intersection point Pie chart infographic Arrow Graph chart diagram Percent up arrow and Financial growth decrease icon. Vector.
Free with trial Set line Graph chart diagram Many ways directional arrow Pie infographic Arrow Location and Financial growth decrease icon. Vector. Diagram financial growth decrease vectors Set line Graph, chart, diagram, Many ways directional arrow, Pie infographic, Arrow, Location, and Financial growth. Set line Graph chart diagram Many ways directional arrow Pie infographic Arrow Location and Financial growth decrease icon. Vector.
Free with trial Set line Project team base Old hourglass with sand Arrow Delivery tracking Graph chart diagram Shopping bag Sale Clock and Financial growth decrease icon. Vector. Diagram financial growth decrease vectors Set line Project team base, Old hourglass with sand, Arrow, Delivery tracking, Graph, chart, diagram, Shopping bag Sale. Set line Project team base Old hourglass with sand Arrow Delivery tracking Graph chart diagram Shopping bag Sale Clock and Financial growth decrease icon. Vector.
Free with trial Set Target Factory Pie chart infographic Graph chart diagram Intersection point Many ways directional arrow Financial growth decrease and Arrow icon. Vector. Diagram financial growth decrease vectors Set Target, Factory, Pie chart infographic, Graph, chart, diagram, Intersection point, Many ways directional arrow. Set Target Factory Pie chart infographic Graph chart diagram Intersection point Many ways directional arrow Financial growth decrease and Arrow icon. Vector.
Free with trial Declining business arrow on diagram of growth, downward green arrow. vector graph icon. eps10. Diagram financial growth decrease illustrations Declining business arrow on diagram of growth, downward green arrow. vector graph icon. eps10
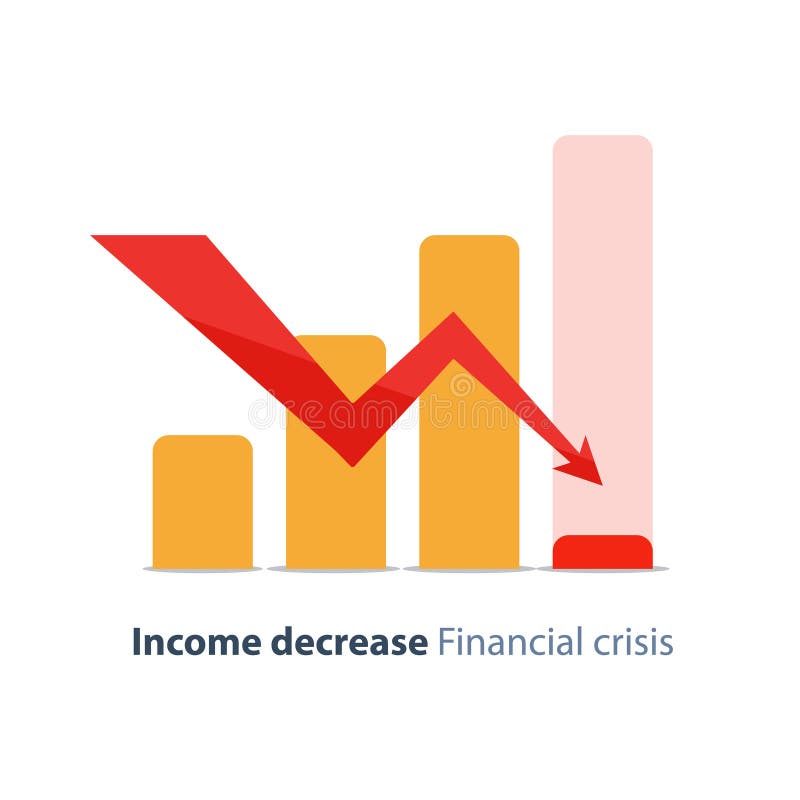
Free with trial Income decrease graph, financial crisis rate, revenue decline chart, economy downturn, investment risk, fund management, budget deficit, vector illustration, flat icon. Diagram financial growth decrease vectors Budget deficit, income decrease, economy decline, financial crisis, investment risk. Income decrease graph, financial crisis rate, revenue decline chart, economy downturn, investment risk, fund management, budget deficit, vector illustration, flat icon
Free with trial Income decrease graph, financial crisis rate, revenue decline chart, economy downturn, investment risk, fund management, budget deficit, vector illustration, flat icon. Diagram financial growth decrease vectors Budget deficit, income decrease, economy decline, financial crisis, investment risk. Income decrease graph, financial crisis rate, revenue decline chart, economy downturn, investment risk, fund management, budget deficit, vector illustration, flat icon
Free with trial Depreciation down graph fail bankruptcy diagram financial business crisis economy vector. Diagram financial growth decrease illustrations Depreciation down graph fail bankruptcy diagram financial business crisis economy
Free with trial A set of currency growth and decline icons featuring stacks of coins and directional arrows, indicating financial increases and decreases. concepts of economic growth, losses and currency fluctuations. Diagram financial growth decrease vectors Money Growth and Decrease Icons with Coins and Up Down Arrows. A set of currency growth and decline icons featuring stacks of coins and directional arrows, indicating financial increases and decreases. concepts of economic growth, losses and currency fluctuations
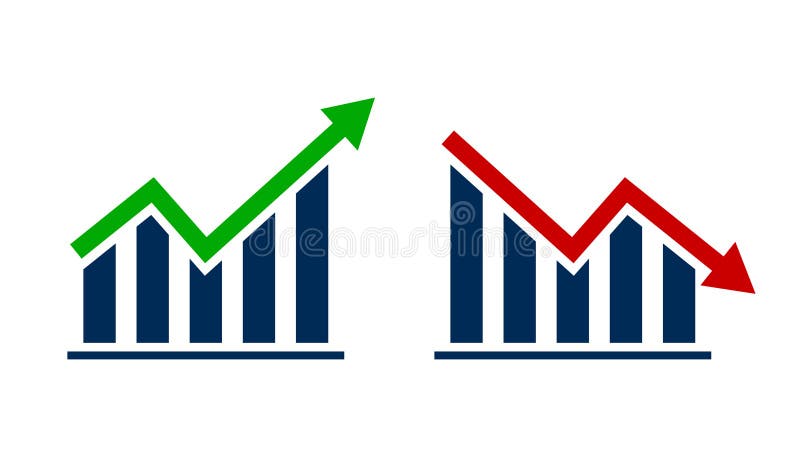
Free with trial Financial bar chart with green up and red down arrow. Economic growth and decline symbol vector. Diagram financial growth decrease vectors Financial bar chart with green up and red down arrow. Economic growth and decline symbol
Free with trial Colorful pie chart is showing positive statistics and business growth, target and financial analysis and marketing report, data with copy space. Diagram financial growth decrease vectors Colorful pie chart is showing positive statistics and business growth, target and financial analysis and marketing
Free with trial Stacks of gold coins are arranged in a triangular formation on a white background. Above them, a large, upward-pointing arrow signifies growth and financial prosperity. The coins and arrow are illustrated in a uniform golden hue, symbolizing wealth and economic advancement. Diagram financial growth decrease vectors Financial Growth Concept with Stacks of Gold Coins and Upward Arrow. Financial Growth Gold Coins. Growth Chart. Stacks of gold coins are arranged in a triangular formation on a white background. Above them, a large, upward-pointing arrow signifies growth and financial prosperity. The coins and arrow are illustrated in a uniform golden hue, symbolizing wealth and economic advancement.
Free with trial Diagram Graph And Financial Charts icons set with white background. Thin Line Style stock vector. Diagram financial growth decrease vectors Diagram Graph And Financial Charts icons set with white background.
Free with trial Dollar Coins with Upward Arrows Representing Financial Growth in Minimalist Flat Style. Diagram financial growth decrease vectors Dollar Coins with Upward Arrows Representing Financial Growth in Minimalist Flat Style
Free with trial Home sits alone on financial papers detailing growth. Diagram financial growth decrease illustrations Home sits alone on financial papers detailing growth
Free with trial A dynamic digital illustration of a financial chart on a dark, high-tech background. The image features two contrasting lines: a vibrant green line trending upwards with an arrow, symbolizing growth, profit, and success, and a blue line moving downwards with an arrow, representing decline, loss, and risk. Glowing data points and a network grid enhance the futuristic feel. This versatile graphic is perfect for concepts related to stock market analysis, business performance, investment volatility, economic forecasting, big data, and financial technology (fintech). Diagram financial growth decrease illustrations Futuristic Financial Graph with Growth and Decline Arrows. A dynamic digital illustration of a financial chart on a dark, high-tech background. The image features two contrasting lines: a vibrant green line trending upwards with an arrow, symbolizing growth, profit, and success, and a blue line moving downwards with an arrow, representing decline, loss, and risk. Glowing data points and a network grid enhance the futuristic feel. This versatile graphic is perfect for concepts related to stock market analysis, business performance, investment volatility, economic forecasting, big data, and financial technology (fintech).
Free with trial Dollar and bitcoin Coins with Upward Arrows Representing Financial Growth in Minimalist Flat Style. Diagram financial growth decrease vectors Dollar and bitcoin Coins with Upward Arrows Representing Financial Growth in Minimalist Flat Style
Free with trial Financial arrows up and down. chart increase, decrease sign with green and red arrows. vector graph with green and red arrows design. Diagram financial growth decrease vectors Financial arrows up and down. chart increase, decrease sign with green and red arrows. vector graph with green and red arrows
Free with trial A 3D render illustrating a concept of financial decline and economic recession. The image features a red bar chart with progressively shorter bars, indicating a downward trend. A bold, red arrow follows this negative trajectory, pointing sharply downwards. Set against a clean, neutral gray background, this graphic powerfully symbolizes concepts like business failure, stock market crash, investment loss, sales decrease, and economic crisis. It's a perfect visual for presentations, reports, and articles discussing financial downturns, poor performance, and negative growth. Diagram financial growth decrease illustrations Financial Decline Graph with Red Arrow Down. A 3D render illustrating a concept of financial decline and economic recession. The image features a red bar chart with progressively shorter bars, indicating a downward trend. A bold, red arrow follows this negative trajectory, pointing sharply downwards. Set against a clean, neutral gray background, this graphic powerfully symbolizes concepts like business failure, stock market crash, investment loss, sales decrease, and economic crisis. It's a perfect visual for presentations, reports, and articles discussing financial downturns, poor performance, and negative growth.
Free with trial Dollar Coins with Upward and Downward Arrows Representing Financial Growth and Decline in Minimalist Flat Style. Diagram financial growth decrease vectors Dollar Coins with Upward and Downward Arrows Representing Financial Growth and Decline in Minimalist Flat Style.
Free with trial A set of simple and clean line art icons representing various financial and business concepts, including growth, decrease, profit, and loss. These icons are suitable for use in presentations, websites, and mobile applications. Diagram financial growth decrease vectors Simple Line Art Financial Chart Symbol Icon Set for Business Concept. A set of simple and clean line art icons representing various financial and business concepts, including growth, decrease, profit, and loss. These icons are suitable for use in presentations, websites, and mobile applications.
Free with trial Depreciation down graph fail bankruptcy diagram financial business crisis economy vector. Diagram financial growth decrease vectors Depreciation down graph fail bankruptcy diagram financial business crisis economy
Free with trial A collage of nine distinct charts and graphs, primarily displaying financial data, growth trends, and economic indicators. The visuals feature line graphs, area charts, and bar charts with various colored lines and shaded areas representing different metrics over time. Accompanying text and labels suggest analysis of business performance, economic growth, and financial markets. This collection is ideal for presentations, reports, and articles related to finance, economics, and business analytics. Diagram financial growth decrease illustrations Collection of Financial and Business Growth Charts. A collage of nine distinct charts and graphs, primarily displaying financial data, growth trends, and economic indicators. The visuals feature line graphs, area charts, and bar charts with various colored lines and shaded areas representing different metrics over time. Accompanying text and labels suggest analysis of business performance, economic growth, and financial markets. This collection is ideal for presentations, reports, and articles related to finance, economics, and business analytics.
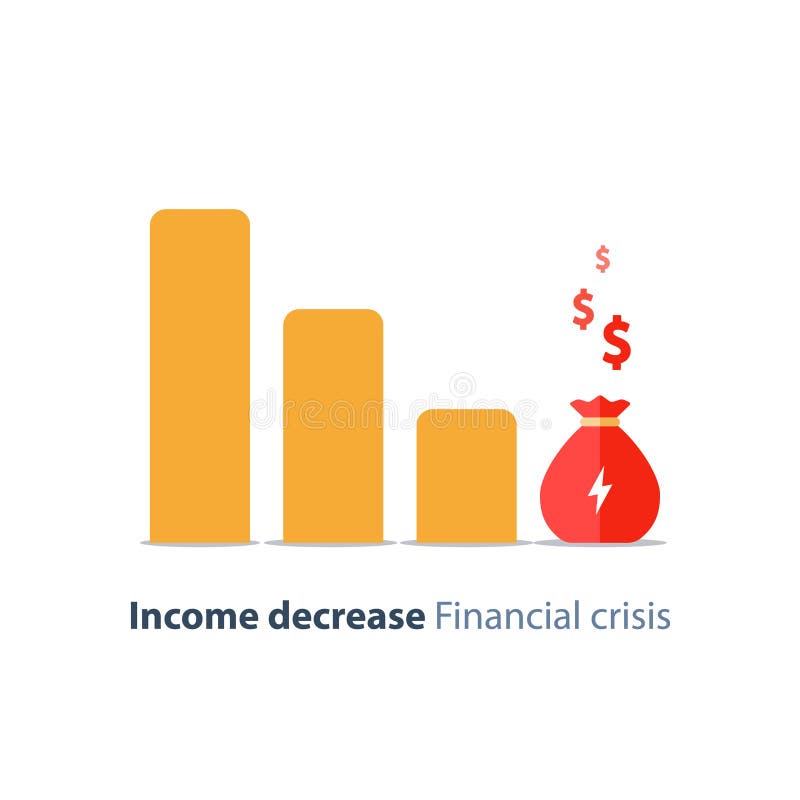
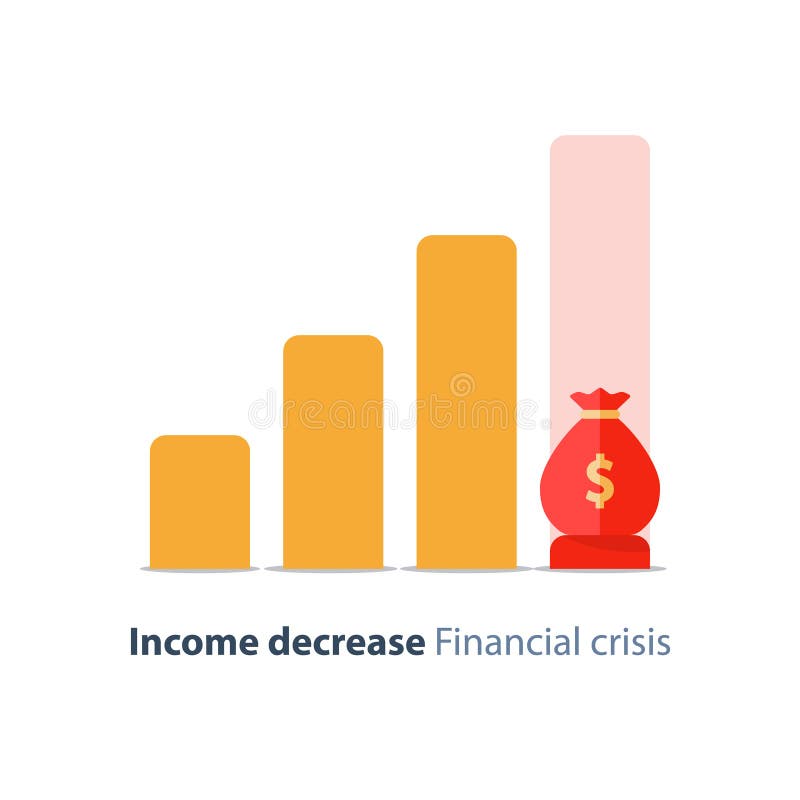
Free with trial Income decrease graph, financial crisis rate, revenue decline chart, economy downturn, investment risk, fund management, budget deficit, vector illustration, flat icon. Diagram financial growth decrease vectors Budget deficit, income decrease, economy decline, financial crisis, investment risk. Income decrease graph, financial crisis rate, revenue decline chart, economy downturn, investment risk, fund management, budget deficit, vector illustration, flat icon
Free with trial Abstract 3D render of a financial growth chart. The image features a series of vertical bars, some in teal and others in orange, representing data points on a graph. The bars increase in height towards the right, suggesting positive growth or progress. The chart is set against a dark background with a subtle grid pattern and a reflective surface, adding depth and visual interest. Suitable for illustrating financial reports, market analysis, or business trends. Diagram financial growth decrease illustrations Abstract Financial Growth Chart. Abstract 3D render of a financial growth chart. The image features a series of vertical bars, some in teal and others in orange, representing data points on a graph. The bars increase in height towards the right, suggesting positive growth or progress. The chart is set against a dark background with a subtle grid pattern and a reflective surface, adding depth and visual interest. Suitable for illustrating financial reports, market analysis, or business trends.
Free with trial Illustration of a smartphone displaying financial charts and a stack of gold coins with dollar signs. Arrows circulate around the phone, suggesting a cycle of investment and growth. The image represents mobile banking, online trading, and the potential for financial success through digital platforms. Diagram financial growth decrease illustrations Mobile Investment and Financial Growth. Illustration of a smartphone displaying financial charts and a stack of gold coins with dollar signs. Arrows circulate around the phone, suggesting a cycle of investment and growth. The image represents mobile banking, online trading, and the potential for financial success through digital platforms.
Free with trial Simple illustration of a bar graph. Financial market and coronavirus crisis. Subsequent recovery and growth of the economy - vector. Diagram financial growth decrease vectors Simple illustration of a bar graph. Financial market and coronavirus crisis. Subsequent recovery and growth of the economy, vector
Free with trial Illustration of a hand holding a magnifying glass over a financial chart showing business growth and success. The image represents data analysis, investment strategy, and market trends in a visually appealing way. Diagram financial growth decrease illustrations Business Growth Analysis Magnifying Glass on Financial Chart. Illustration of a hand holding a magnifying glass over a financial chart showing business growth and success. The image represents data analysis, investment strategy, and market trends in a visually appealing way.
Free with trial Hand loss business graph crisis chart diagram financial economy on down arrow investment market background of digital technology inflation strategy economic stock. Diagram financial growth decrease illustrations Hand loss business graph crisis chart diagram financial economy on down arrow investment market background of digital technology
Free with trial Financial Growth Chart on a Suitcase Business Investment Economy Graphic Illustration. Diagram financial growth decrease vectors Financial Growth Chart on a Suitcase Business Investment Economy Graphic Illustration
Free with trial Business data is visually represented in black and white through various charts and graphs illustrating growth analysis and strategic planning for financial reporting showing a clear picture of market. Diagram financial growth decrease vectors Black and white business data visualization with charts and graphs showing growth and analysis for financial reporting and. Business data is visually represented in black and white through various charts and graphs illustrating growth analysis and strategic planning for financial reporting showing a clear picture of market
Free with trial Financial arrows up and down icon on circle. Growth and decline graph sign symbol illustration. Diagram financial growth decrease vectors Financial arrows up and down icon on circle. Growth and decline graph sign symbol
Free with trial A businessman is using wooden blocks to represent financial growth and decline. the image represents business strategy, investment planning and market analysis for online business success now. Diagram financial growth decrease illustrations Business growth strategy and financial planning for investment and market analysis success online now. a businessman is using wooden blocks to represent financial growth and decline. the image represents business strategy, investment planning and market analysis for online business success now.
Free with trial Coins stacked on wooden blocks with sad and happy faces represent financial growth investment success and the emotional journey of managing money showing the progression from loss to gain and the imp. Diagram financial growth decrease illustrations Coins stacked on wooden blocks with sad and happy faces showing financial growth and investment success. Coins stacked on wooden blocks with sad and happy faces represent financial growth investment success and the emotional journey of managing money showing the progression from loss to gain and the imp
Free with trial Growth and decline graph report icon illustration. Financial chart arrow up and down symbol on black circle. Diagram financial growth decrease vectors Growth and decline graph report icon. Financial chart arrow up and down symbol on black circle
Free with trial Shiny blue bar graph depicts growth then decline, presented on a financial document Useful for showcasing data analysis and reporting. Diagram financial growth decrease illustrations Analyzing Business Graph Illustration Showing Decrease and Growth Statistics Report. Shiny blue bar graph depicts growth then decline, presented on a financial document Useful for showcasing data analysis and reporting
Free with trial Chart icon and graph for statistic line or bar diagram with growth pie and graphic data. Use for analysis trend and pictogram by profit algorithm report. Business infographic title. Vector. Diagram financial growth decrease vectors Chart icon and graph for statistic line or bar diagram with growth pie and graphic data. Use for analysis trend and
Free with trial A diverse set of icons representing financial growth, market trends, and business analytics, including line graphs, bar charts, pie charts, and currency symbols. Diagram financial growth decrease vectors Collection of Financial and Business Growth Icons and Charts. A diverse set of icons representing financial growth, market trends, and business analytics, including line graphs, bar charts, pie charts, and currency symbols
Free with trial 3d colorful bar chart increase decrease sales or purchase diagram. statistic information chart diagrams. Diagram financial growth decrease vectors 3D Vector Colorful Increase Decrease Bar Chart Diagram. 3d colorful bar chart increase decrease sales or purchase diagram . statistic information chart diagrams
Free with trial Financial chart arrow up and down icon isolated on white background. Growth and decline graph sign symbol illustration. Diagram financial growth decrease vectors Financial chart arrow up and down icon isolated on white background. Growth and decline graph sign symbol
Free with trial Income decrease graph, financial crisis rate, revenue decline chart, economy downturn, investment risk, fund management, budget deficit, vector illustration, flat icon. Diagram financial growth decrease vectors Budget deficit, income decrease, economy decline, financial crisis, investment risk. Income decrease graph, financial crisis rate, revenue decline chart, economy downturn, investment risk, fund management, budget deficit, vector illustration, flat icon
Free with trial Financial growth and decline icon set with stacked coins and arrows design. Diagram financial growth decrease illustrations Financial growth and decline icon set with stacked coins and arrows
Free with trial A 3D illustration of a stack of golden coins with an decrease and increase arrow graph, symbolizing financial growth and success. financial freedom, wealth management, economic growth, Financial Growth, Growing Wealth. Diagram financial growth decrease vectors Ggrowing wealth financial success, rising profits investment. A 3D illustration of a stack of golden coins with an decrease and increase arrow graph, symbolizing financial growth and success. financial freedom, wealth management, economic growth, Financial Growth, Growing Wealth
Free with trial Bitcoin coin value rise and fall charts. Financial infographic. Cryptocurrency crisis. Growth arrow. Crypto currency income. Investment BTC prices statistic diagram. Gold cash stacks. Vector concept. Diagram financial growth decrease vectors Bitcoin coin value rise and fall charts. Financial infographic. Cryptocurrency crisis. Crypto currency income. Bitcoin coin value rise and fall charts. Financial infographic. Cryptocurrency crisis. Growth arrow. Crypto currency income. Investment BTC prices statistic diagram. Gold cash stacks. Vector concept
Free with trial Chart growth decrease money financial stock market vector illustration. Diagram financial growth decrease vectors Financial stock market
Free with trial Income decrease graph, financial crisis rate, revenue decline chart, economy downturn, investment risk, fund management, budget deficit, vector illustration, flat icon. Diagram financial growth decrease vectors Budget deficit, income decrease, economy decline, financial crisis, investment risk. Income decrease graph, financial crisis rate, revenue decline chart, economy downturn, investment risk, fund management, budget deficit, vector illustration, flat icon
Free with trial A businessman interacting with a digital interface showing financial growth, time management, and investment strategies. It represents wealth management and business success. Time is money, invest wisely. Diagram financial growth decrease illustrations Business investment strategy time is money financial growth and wealth management concept illustration. a businessman interacting with a digital interface showing financial growth, time management, and investment strategies. It represents wealth management and business success. Time is money, invest wisely.
Free with trial A detailed illustration of a business growth chart with multiple lines, representing profit, trend, and loss, along with various financial indicators and icons. Diagram financial growth decrease vectors Business growth chart with multiple lines and various financial indicators. A detailed illustration of a business growth chart with multiple lines, representing profit, trend, and loss, along with various financial indicators and icons
Free with trial Illustration of financial line graph showing growth. Upward trending arrow, chart, bar chart, income, finance, business, statistics development. Visual representation of success. Diagram financial growth decrease illustrations Illustration of financial line graph showing growth. Upward trending arrow, chart, bar chart, income, finance, business