Free with trial Illustration of financial line graph showing growth. Upward trending arrow, chart, bar chart, income, finance, business, statistics development. Visual representation of success. Diagram financial growth decrease illustrations Illustration of financial line graph showing growth. Upward trending arrow, chart, bar chart, income, finance, business
Free with trial Financial data analysis bar chart icon with upward trend showing business growth. Diagram financial growth decrease vectors Financial data analysis bar chart icon with upward trend showing business growth
Free with trial A vibrant neon bar graph shows financial growth. The data visualization uses blue, green, and purple hues against a dark background. Modern and abstract design. Diagram financial growth decrease illustrations Neon bar graph data visualization financial growth chart illustration generative ai. A vibrant neon bar graph shows financial growth. The data visualization uses blue, green, and purple hues against a dark background. Modern and abstract design
Free with trial Colorful business charts and graphs showing financial growth, data analysis, and stock market trends, ideal for corporate presentations and reports. Diagram financial growth decrease illustrations Business data analysis charts graphs financial growth stock market trend generative ai. colorful business charts and graphs showing financial growth, data analysis, and stock market trends, ideal for corporate presentations and reports.
Free with trial Credit card, Diagram graph and Internet shopping icons simple set. Button with halftone dots. Growth chart sign. Atm payment, Presentation chart, Cart with purchases. Upper arrows. Finance set. Vector. Diagram financial growth decrease vectors Credit card, Diagram graph and Internet shopping icons set. Growth chart sign. Vector. Credit card, Diagram graph and Internet shopping icons simple set. Button with halftone dots. Growth chart sign. Atm payment, Presentation chart, Cart with purchases. Upper arrows. Finance set. Vector
Free with trial Modern graphic business charts set featuring financial growth and decline for data visualization. AI generated. Diagram financial growth decrease vectors Modern graphic business charts set featuring financial growth and decline for data visualization. AI generated
Free with trial Stack of coins with upward arrow, symbolizing growth, savings, investment, and financial success ,Generative ai. Diagram financial growth decrease illustrations Ascending arrow on coin stack, visualizing financial growth, investment, savings, and wealth building. Stack of coins with upward arrow, symbolizing growth, savings, investment, and financial success ,Generative ai
Free with trial Line art business graphs set featuring financial growth and decline with dollar signs for economic performance. Diagram financial growth decrease vectors Line art business graphs set featuring financial growth and decline with dollar signs for economic performance
Free with trial Column growth and decrease charts with arrows isolated vector graphic economy icon. Diagram financial growth decrease vectors Column growth and decrease charts with arrows isolated icon. Column growth and decrease charts with arrows isolated vector graphic economy icon
Free with trial Colorful pie chart is showing positive statistics and business growth, target and financial analysis and marketing report, data with copy space. Diagram financial growth decrease illustrations Colorful pie chart is showing positive statistics and business growth, target and financial analysis and marketing
Free with trial A close-up view of a financial candlestick chart displaying an overall upward trend. The chart features numerous blue and white candlesticks, which represent price movements over specific periods. Blue candlesticks typically indicate a price increase, while white ones suggest a decrease. Overlaying the candlesticks are two smooth lines, one green and one light blue, which are likely moving. Diagram financial growth decrease illustrations Uptrending candlestick chart illustrating financial market growth and stock trading analysis isolated on white background. A close-up view of a financial candlestick chart displaying an overall upward trend. The chart features numerous blue and white candlesticks, which represent price movements over specific periods. Blue candlesticks typically indicate a price increase, while white ones suggest a decrease. Overlaying the candlesticks are two smooth lines, one green and one light blue, which are likely moving
Free with trial Decrease financial condition graphic logo and vector icon. Diagram financial growth decrease illustrations Decrease financial condition graphic logo and icon
Free with trial Column growth and decrease chart isolated vector business graphic concept image. Diagram financial growth decrease vectors Column growth and decrease chart
Free with trial Business and financial growth. Stock market and trading after Coronavirus or covid impact. Vector illustration design. Diagram financial growth decrease vectors Business and financial growth. Stock market and trading after Coronavirus or covid impact. Vector illustration design
Free with trial Financial Icons, showing a decrease in cash. A pile of coins in a pie chart with an arrow tends to zero. Diagram financial growth decrease vectors Financial Icons, showing a decrease in cash. A pile of coins
Free with trial Opposite up and down arrows logo. Financial growth and decline icon. Business development and reduction symbol. Vector illustration. Diagram financial growth decrease vectors Opposite up and down arrows logo. Financial growth and decline icon
Free with trial Business and financial growth. Stock market and trading after Coronavirus or covid impact. Vector illustration design. Diagram financial growth decrease vectors Business and financial growth. Stock market and trading after Coronavirus or covid impact. Vector illustration design
Free with trial Dropping graph decrease decline growth vector illustration. Diagram financial growth decrease vectors Dropping graph decrease decline growth
Free with trial Increase Growth and Decrease Reduction Curve Chart. Business Finance Chart and Graph Infographic Solid Glyph Vector Illustration Icon Set. Diagram financial growth decrease vectors Increase Growth and Decrease Reduction Curve Chart. Business Finance Chart and Graph Infographic Solid Glyph Vector Illustration
Free with trial Increase Growth and Decrease Reduction Curve Chart. Business Finance Chart and Graph Infographic Sticker Vector Illustration Icon Set. Diagram financial growth decrease vectors Increase Growth and Decrease Reduction Curve Chart. Business Finance Chart and Graph Infographic Sticker Vector Illustration Icon
Free with trial A minimal style of a red down graph of the financial crisis, economic downturn, inflation, recession, failure, bankruptcy, and crisis concept. A businesswoman pushes decrease business chart diagram. Diagram financial growth decrease vectors A minimal style of a red down graph of the financial crisis
Free with trial Growth chart, Analytics graph and Diagram chart icons simple set. Button with halftone dots. Salary sign. Upper arrows, Growth report, Presentation graph. Diplomat with money bag. Vector. Diagram financial growth decrease vectors Growth chart, Analytics graph and Diagram chart icons set. Salary sign. Vector. Growth chart, Analytics graph and Diagram chart icons simple set. Button with halftone dots. Salary sign. Upper arrows, Growth report, Presentation graph. Diplomat with money bag. Vector
Free with trial Dropping graph decrease decline growth vector illustration. Diagram financial growth decrease vectors Dropping graph decrease decline growth
Free with trial Growth and decrease icon on white background. Vector illustration. Diagram financial growth decrease illustrations Growth and decrease icon on white background
Free with trial Decrease diagram coin business report illustration. Diagram financial growth decrease illustrations Decrease diagram coin business
Free with trial Decrease diagram gear business report illustration. Diagram financial growth decrease illustrations Decrease diagram gear business
Free with trial Decrease diagram chart business report illustration. Diagram financial growth decrease illustrations Decrease diagram chart business
Free with trial Decrease diagram gold bars business report illustration. Diagram financial growth decrease illustrations Decrease diagram gold bars business
Free with trial Face id, Financial diagram and Chemistry lab line icons set. Augmented reality, Face verified and Pyramid chart signs. Identification system, Candlestick chart, Laboratory. Virtual reality. Vector. Diagram financial growth decrease vectors Face id, Financial diagram and Chemistry lab icons set. Vector. Face id, Financial diagram and Chemistry lab line icons set. Augmented reality, Face verified and Pyramid chart signs. Identification system, Candlestick chart, Laboratory. Virtual reality. Vector
Free with trial Business growth up and down infographics | business graph going down | 3d graph chart decrease infographics - 4k desktop background. Diagram financial growth decrease illustrations Business growth up and down infographics | business graph going down | 3d graph chart decrease infographics. Business growth up and down infographics | business graph going down | 3d graph chart decrease infographics - 4k desktop background
Free with trial Business growth up and down infographics | business graph going down | 3d graph chart decrease infographics - 4k desktop background. Diagram financial growth decrease illustrations Business growth up and down infographics | business graph going down | 3d graph chart decrease infographics. Business growth up and down infographics | business graph going down | 3d graph chart decrease infographics - 4k desktop background
Free with trial Simple decrease diagram vector design, statistical diagram that serves to provide information about a data or so on. Diagram financial growth decrease vectors Simple decrease diagram vector design
Free with trial Decrease diagram chart business report vector illustration. Diagram financial growth decrease vectors Decrease diagram chart business
Free with trial Graph chart, 24 hours and Diagram line icons set. Handshake deal, research and promotion complex icons. Checklist sign. Growth report, Repeat, Growth graph. Survey. Finance set. Vector. Diagram financial growth decrease vectors Graph chart, 24 hours and Diagram icons set. Checklist sign. Growth report, Repeat, Growth graph. Survey. Vector. Graph chart, 24 hours and Diagram line icons set. Handshake deal, research and promotion complex icons. Checklist sign. Growth report, Repeat, Growth graph. Survey. Finance set. Vector
Free with trial Graph chart, 24 hours and Diagram line icons set. Timeline infographic. Checklist sign. Growth report, Repeat, Growth graph. Survey. Finance set. Graph chart icon. Timeline diagram. Vector. Diagram financial growth decrease vectors Graph chart, 24 hours and Diagram icons set. Checklist sign. Growth report, Repeat, Growth graph. Survey. Vector. Graph chart, 24 hours and Diagram line icons set. Timeline infographic. Checklist sign. Growth report, Repeat, Growth graph. Survey. Finance set. Graph chart icon. Timeline diagram. Vector
Free with trial Chart showcasing progress. The last bar stands out as a green arrow, symbolising positive growth. Accompanied by cash, it's a powerful representation of financial success. Diagram financial growth decrease vectors Financial Growth Chart with Positive Momentum. Chart showcasing progress. The last bar stands out as a green arrow, symbolising positive growth. Accompanied by cash, it's a powerful representation of financial success...
Free with trial Graphic design chart and Diagram icons. Business and financial concept. Flat icons collection set. Vector illustration. Diagram financial growth decrease vectors Graphic design chart and Diagram icons. Business and financial concept. Flat icons collection set. Vector illustration
Free with trial Start business, Time change and Graph chart icons simple set. Button with halftone dots. Money diagram sign. Launch idea, Clock, Growth report. Currency diagram. Education set. Vector. Diagram financial growth decrease vectors Start business, Time change and Graph chart icons set. Money diagram sign. Launch idea, Clock, Growth report. Vector. Start business, Time change and Graph chart icons simple set. Button with halftone dots. Money diagram sign. Launch idea, Clock, Growth report. Currency diagram. Education set. Vector
Free with trial Checklist sign. Diploma certificate, save planet chat bubbles. Graph chart, 24 hours and Diagram line icons set. Growth report, Repeat, Growth graph. Survey. Finance set. Outline icons set. Vector. Diagram financial growth decrease vectors Graph chart, 24 hours and Diagram icons set. Checklist sign. Growth report, Repeat, Growth graph. Survey. Vector. Checklist sign. Diploma certificate, save planet chat bubbles. Graph chart, 24 hours and Diagram line icons set. Growth report, Repeat, Growth graph. Survey. Finance set. Outline icons set. Vector
Free with trial This vector icon set features graph diagrams with arrows indicating growth and decline. The icons represent business metrics and financial performance, with arrows pointing upward for growth and downward for decline. These symbols are ideal for visualizing trends, success, and changes in finance reports or business charts. The clean, simple design ensures clarity, making these icons suitable for use in presentations, reports, or dashboards to effectively communicate financial or business performance. Diagram financial growth decrease vectors Growing up and down vector icon set. Graph diagram with arrow. Business growth success chart. Finance report symbol. This vector icon set features graph diagrams with arrows indicating growth and decline. The icons represent business metrics and financial performance, with arrows pointing upward for growth and downward for decline. These symbols are ideal for visualizing trends, success, and changes in finance reports or business charts. The clean, simple design ensures clarity, making these icons suitable for use in presentations, reports, or dashboards to effectively communicate financial or business performance.
Free with trial Set Pie chart infographic Location Many ways directional arrow Arrow Layers Light bulb and Financial growth decrease icon. Vector. Diagram financial growth decrease vectors Set Pie chart infographic, Location, Many ways directional arrow, Arrow, Layers, Light bulb and Financial growth. Set Pie chart infographic Location Many ways directional arrow Arrow Layers Light bulb and Financial growth decrease icon. Vector.
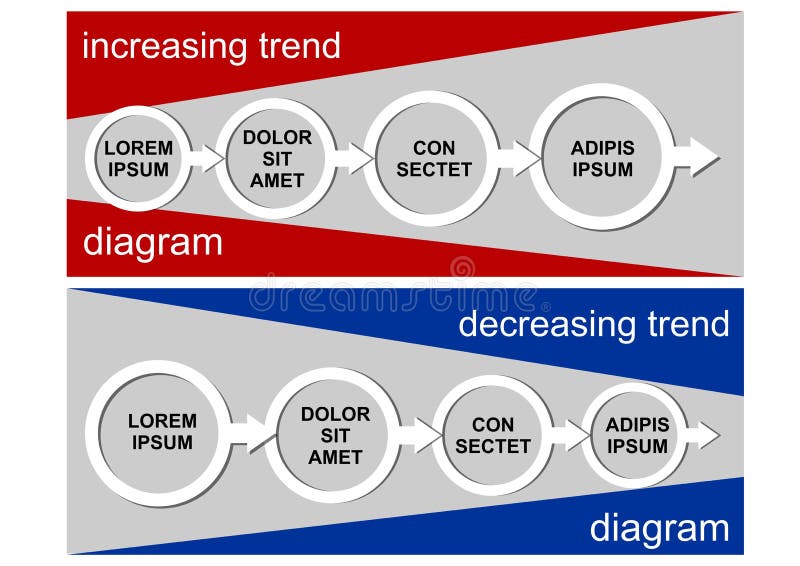
Free with trial Increase diagram and decrease diagram with circles and arrows, infographic template with simple white elements on gray background, red triangles and blue triangles, vector template. Diagram financial growth decrease vectors Increase diagram and decrease diagram with circles and arrows, infographic template with simple white elements on gray
Free with trial A vibrant, modern icon depicting a financial growth chart, representing investment and market analysis. The design features ascending lines and bars, suggesting positive trends. This graphic was generated by AI for illustrative purposes. A representation of financial success. Diagram financial growth decrease illustrations Financial Growth Chart Icon - Business Investment Concept. A vibrant, modern icon depicting a financial growth chart, representing investment and market analysis. The design features ascending lines and bars, suggesting positive trends. This graphic was generated by AI for illustrative purposes. A representation of financial success.
Free with trial Concept Abstract Art, Blue Watercolor, Financial Growth, Chart, Abstract Design Abstract Blue Watercolor Financial Growth Chart. Diagram financial growth decrease illustrations Abstract Blue Watercolor Financial Growth Chart. Concept Abstract Art, Blue Watercolor, Financial. Concept Abstract Art, Blue Watercolor, Financial Growth, Chart, Abstract Design Abstract Blue Watercolor Financial Growth Chart
Free with trial Set Search globe Data analysis Server security with padlock Financial growth Folder and Pie chart infographic Browser stocks market and decrease icon. Vector. Diagram financial growth decrease vectors Set Search globe, Data analysis, Server security with padlock, Financial growth, Folder and, Pie chart infographic. Set Search globe Data analysis Server security with padlock Financial growth Folder and Pie chart infographic Browser stocks market and decrease icon. Vector.
Free with trial Set of Payment click, Graph chart and Creativity icons. Checkbox sign. Financial transfer, Growth report, Design idea. Survey choice. Classic design payment click icon. Flat design. Vector. Diagram financial growth decrease vectors Payment click, Graph chart and Creativity icons. Checkbox sign. Financial transfer, Growth report, Design idea. Vector. Set of Payment click, Graph chart and Creativity icons. Checkbox sign. Financial transfer, Growth report, Design idea. Survey choice. Classic design payment click icon. Flat design. Vector
Free with trial This set of icons shows different aspects of money circulation, investment, financial growth and profit. Diagram financial growth decrease vectors Money circulation, investment, financial growth and profit flat icons set. This set of icons shows different aspects of money circulation, investment, financial growth and profit
Free with trial Augmented reality, Face verified and Pyramid chart signs. Chat bubbles. Face id, Financial diagram and Chemistry lab line icons set. Identification system, Candlestick chart, Laboratory. Vector. Diagram financial growth decrease vectors Face id, Financial diagram and Chemistry lab icons set. Vector. Augmented reality, Face verified and Pyramid chart signs. Chat bubbles. Face id, Financial diagram and Chemistry lab line icons set. Identification system, Candlestick chart, Laboratory. Vector
Free with trial Business growth up and down infographics | business graph going down | 3d graph chart decrease infographics - 4k desktop background. Diagram financial growth decrease illustrations Business growth up and down infographics | business graph going down | 3d graph chart decrease infographics. Business growth up and down infographics | business graph going down | 3d graph chart decrease infographics - 4k desktop background
Free with trial Financial bar chart icon with up and down arrow. Economic growth and decline symbol in black circle. Diagram financial growth decrease vectors Financial bar chart with up and down arrow. Economic growth and decline symbol in black circle
Free with trial A clear flat vector icon representing a bar chart with a downward-pointing red arrow, symbolizing decline, loss, or negative growth. This design is useful for financial reports, risk analysis, or any situation indicating a decrease in performance or value. It communicates challenges, vector design Generative AI. Diagram financial growth decrease vectors Bar Chart Downtrend Icon, Decline, Loss, Negative Growth, Business, vector design Generative AI. A clear flat vector icon representing a bar chart with a downward-pointing red arrow, symbolizing decline, loss, or negative growth. This design is useful for financial reports, risk analysis, or any situation indicating a decrease in performance or value. It communicates challenges, vector design Generative AI
Free with trial Set line Digital speed meter Pie chart infographic Arrow Unknown search Many ways directional arrow Financial growth decrease and icon. Vector. Diagram financial growth decrease illustrations Set line Digital speed meter, Pie chart infographic, Arrow, Unknown search, Many ways directional arrow, Financial. Set line Digital speed meter Pie chart infographic Arrow Unknown search Many ways directional arrow Financial growth decrease and icon. Vector.
Free with trial Decreasing bar chart diagram with down arrow showing negative growth. Diagram financial growth decrease vectors Decreasing bar chart diagram with down arrow showing negative growth
Free with trial Growth and decline graph report icon. Financial chart arrow up and down sign symbol illustration. Diagram financial growth decrease vectors Growth and decline graph report icon. Financial chart arrow up and down sign symbol
Free with trial Face id, Financial diagram and Chemistry lab line icons set. Infographic timeline. Augmented reality, Face verified and Pyramid chart signs. Vector. Diagram financial growth decrease vectors Face id, Financial diagram and Chemistry lab icons set. Vector. Face id, Financial diagram and Chemistry lab line icons set. Infographic timeline. Augmented reality, Face verified and Pyramid chart signs. Vector
Free with trial Financial arrow up and down icon on circle line. Growth and decline graph sign symbol illustration. Diagram financial growth decrease vectors Financial arrow up and down icon on circle line. Growth and decline graph sign symbol
Free with trial Set paper cut Pie chart infographic Search cloud computing Data analysis and Financial growth decrease icon. Paper art style. Vector. Diagram financial growth decrease vectors Set paper cut Pie chart infographic, Search cloud computing, Data analysis and Financial growth decrease icon. Paper art
Free with trial Set line Data analysis Search data Pie chart infographic Financial growth Binary code Mind map Document with and decrease icon. Vector. Diagram financial growth decrease illustrations Set line Data analysis, Search data, Pie chart infographic, Financial growth, Binary code, Mind map, Document with and. Set line Data analysis Search data Pie chart infographic Financial growth Binary code Mind map Document with and decrease icon. Vector.
Free with trial Financial arrows up and down icon in flat design. Growth and decline graph sign symbol illustration. Diagram financial growth decrease vectors Financial arrows up and down icon in flat design. Growth and decline graph sign symbol
Free with trial Business growth up and down infographics | business graph going down | 3d graph chart decrease infographics - 4k desktop background. Diagram financial growth decrease illustrations Business growth up and down infographics | business graph going down | 3d graph chart decrease infographics. Business growth up and down infographics | business graph going down | 3d graph chart decrease infographics - 4k desktop background
Free with trial Line chart illustrating an upward trend, featuring candlestick patterns and glowing dots against a dark background. The arrangement indicates a positive movement in data, reflecting investment and financial growth. Blue and orange tones highlight data points and lines, providing a visual contrast that enhances readability. The abstract style conveys a modern financial theme, emphasizing success and progress in stock markets. Diagram financial growth decrease illustrations Dynamic stock market chart showing upward trend for investment and financial growth success concept. Line chart illustrating an upward trend, featuring candlestick patterns and glowing dots against a dark background. The arrangement indicates a positive movement in data, reflecting investment and financial growth. Blue and orange tones highlight data points and lines, providing a visual contrast that enhances readability. The abstract style conveys a modern financial theme, emphasizing success and progress in stock markets.
Free with trial Report timer, Pay and Money diagram icons simple set. Button with halftone dots. Contactless payment sign. Growth chart, Beggar, Currency diagram. Financial payment. Finance set. Vector. Diagram financial growth decrease vectors Report timer, Pay and Money diagram icons set. Contactless payment sign. Vector. Report timer, Pay and Money diagram icons simple set. Button with halftone dots. Contactless payment sign. Growth chart, Beggar, Currency diagram. Financial payment. Finance set. Vector
Free with trial Report timer, Pay and Money diagram icons simple set. Halftone dots button. Contactless payment sign. Growth chart, Beggar, Currency diagram. Financial payment. Finance set. Vector. Diagram financial growth decrease vectors Report timer, Pay and Money diagram icons set. Contactless payment sign. Vector. Report timer, Pay and Money diagram icons simple set. Halftone dots button. Contactless payment sign. Growth chart, Beggar, Currency diagram. Financial payment. Finance set. Vector
Free with trial Set line Financial growth Pie chart infographic Data analysis Browser with exclamation mark Cloud and shield Search folder and decrease icon. Vector. Diagram financial growth decrease illustrations Set line Financial growth, Pie chart infographic, Data analysis, Browser with exclamation mark, Cloud and shield, Search. Set line Financial growth Pie chart infographic Data analysis Browser with exclamation mark Cloud and shield Search folder and decrease icon. Vector.
Free with trial Vector Set of Education icons related to Electricity, Report statistics and Financial diagram icons. UI phone app screens with people. Documents line symbols. Vector. Diagram financial growth decrease vectors Vector Set of Education icons related to Electricity, Report statistics and Financial diagram. Vector. Vector Set of Education icons related to Electricity, Report statistics and Financial diagram icons. UI phone app screens with people. Documents line symbols. Vector
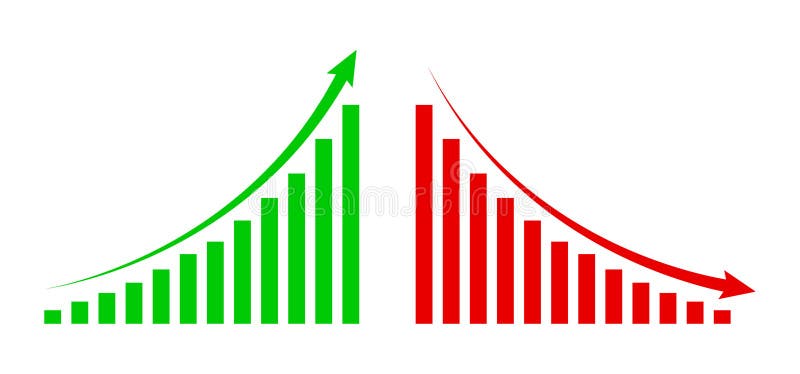
Free with trial Graph going up and down sign financial arrows. chart increase, decrease sign with green and red arrows. vector graph with green and red arrows. Diagram financial growth decrease vectors Graph going up and down sign financial arrows. chart increase, decrease sign with green and red arrows. vector graph
Free with trial Candlestick chart on a dark blue background illustrating stock market trends. Light blue and white candlesticks represent price fluctuations, with wicks indicating high and low values. The chart shows an upward trend, suggesting potential financial growth or investment opportunities. Candlestick charts are commonly used in financial analysis to depict market movements, assisting in forecasting stock behaviors for strategic decision-making. Diagram financial growth decrease illustrations Rising stock market analysis chart for smart investment decisions and financial growth in modern business. Candlestick chart on a dark blue background illustrating stock market trends. Light blue and white candlesticks represent price fluctuations, with wicks indicating high and low values. The chart shows an upward trend, suggesting potential financial growth or investment opportunities. Candlestick charts are commonly used in financial analysis to depict market movements, assisting in forecasting stock behaviors for strategic decision-making.
Free with trial Liquid badges. Set of Alarm bell, Checkbox and Report diagram icons. Web report sign. Time, Survey choice, Financial market. Graph chart. Gradient alarm bell icon. Flyer fluid design. Abstract shapes. Diagram financial growth decrease vectors Alarm bell, Checkbox and Report diagram icons. Web report sign. Time, Survey choice, Financial market. Vector. Liquid badges. Set of Alarm bell, Checkbox and Report diagram icons. Web report sign. Time, Survey choice, Financial market. Graph chart. Gradient alarm bell icon. Flyer fluid design. Abstract shapes
Free with trial Growth chart, Analytics graph and Diagram chart icons simple set. People shapes timeline. Salary sign. Upper arrows, Growth report, Presentation graph. Diplomat with money bag. Education set. Vector. Diagram financial growth decrease vectors Growth chart, Analytics graph and Diagram chart icons set. Salary sign. Vector. Growth chart, Analytics graph and Diagram chart icons simple set. People shapes timeline. Salary sign. Upper arrows, Growth report, Presentation graph. Diplomat with money bag. Education set. Vector
Free with trial Growth chart, Analytics graph and Diagram chart icons simple set. Halftone dots button. Salary sign. Upper arrows, Growth report, Presentation graph. Diplomat with money bag. Education set. Vector. Diagram financial growth decrease vectors Growth chart, Analytics graph and Diagram chart icons set. Salary sign. Vector. Growth chart, Analytics graph and Diagram chart icons simple set. Halftone dots button. Salary sign. Upper arrows, Growth report, Presentation graph. Diplomat with money bag. Education set. Vector
Free with trial Profit rise and fall graph. Infographic with up and down arrow. Increase and decrease in amount money. Banknotes heap. Financial success. Economy crisis and recession. Statistics chart. Vector concept. Diagram financial growth decrease vectors Profit rise and fall graph. Infographic with up and down arrow. Increase and decrease in amount money. Banknotes heap. Financial
Free with trial Set pop art Coal mine trolley, Data analysis, and Financial growth decrease icon. Vector. Diagram financial growth decrease illustrations Set pop art Coal mine trolley, Data analysis, and Financial growth decrease icon. Vector
Free with trial Financial chart arrow up and down icon illustration. Growth and decline graph symbol on black circle. Diagram financial growth decrease vectors Financial chart arrow up and down icon. Growth and decline graph symbol on black circle
Free with trial Face id, Financial diagram and Chemistry lab line icons set. Diploma certificate, save planet, group of people. Augmented reality, Face verified and Pyramid chart signs. Vector. Diagram financial growth decrease vectors Face id, Financial diagram and Chemistry lab icons set. Vector. Face id, Financial diagram and Chemistry lab line icons set. Diploma certificate, save planet, group of people. Augmented reality, Face verified and Pyramid chart signs. Vector
Free with trial Minimal set of Growth chart, Column diagram and Buying accessory line icons. Phone screen, Quote banners. Discounts cart icons. For web development. Vector. Diagram financial growth decrease vectors Minimal set of Growth chart, Column diagram and Buying accessory line icons. For web development. Vector. Minimal set of Growth chart, Column diagram and Buying accessory line icons. Phone screen, Quote banners. Discounts cart icons. For web development. Vector
Free with trial Set of Finance icons, such as Analytics graph, Business growth, Money diagram symbols. Mobile screen app banners. Payment line icons. Chart report, Earnings results, Currency diagram. Finance. Vector. Diagram financial growth decrease vectors Set of Finance icons, such as Analytics graph, Business growth, Money diagram symbols. Payment line icons. Vector. Set of Finance icons, such as Analytics graph, Business growth, Money diagram symbols. Mobile screen app banners. Payment line icons. Chart report, Earnings results, Currency diagram. Finance. Vector
Free with trial Calculator target, Report document and Financial diagram icons simple set. Comparison table. Creative painting sign. Audit, Growth chart, Candlestick chart. Graphic art. Education set. Vector. Diagram financial growth decrease vectors Calculator target, Report document and Financial diagram icons set. Creative painting sign. Vector. Calculator target, Report document and Financial diagram icons simple set. Comparison table. Creative painting sign. Audit, Growth chart, Candlestick chart. Graphic art. Education set. Vector
Free with trial Outline set of Credit card, Diagram chart and Financial app line icons for web application. Talk, information, delivery truck outline icon. Vector. Diagram financial growth decrease vectors Outline set of Credit card, Diagram chart and Financial app line icons for web application. For design. Vector. Outline set of Credit card, Diagram chart and Financial app line icons for web application. Talk, information, delivery truck outline icon. Vector
Free with trial Question mark, Diagram and Diagram chart line icons set. Infographic chart, financial data graphic. Exhibitors sign. Ask support, Growth graph, Presentation graph. Information desk. Vector. Diagram financial growth decrease vectors Question mark, Diagram and Diagram chart icons set. Exhibitors sign. Vector. Question mark, Diagram and Diagram chart line icons set. Infographic chart, financial data graphic. Exhibitors sign. Ask support, Growth graph, Presentation graph. Information desk. Vector
Free with trial Growth chart, Column diagram and Buying accessory minimal line icons. 3d spheres or balls buttons. Discounts cart icons. For web, application, printing. Vector. Diagram financial growth decrease illustrations Growth chart, Column diagram and Buying accessory minimal line icons. For web application, printing. Vector. Growth chart, Column diagram and Buying accessory minimal line icons. 3d spheres or balls buttons. Discounts cart icons. For web, application, printing. Vector