Free with trial Business sales chart background. Diagram financial growth decrease vectors Business sales chart
Free with trial Set Coal mine trolley Server Pie chart infographic Financial growth Data analysis decrease and Sales funnel with icon. Vector. Diagram financial growth decrease vectors Set Coal mine trolley, Server, Pie chart infographic, Financial growth, Data analysis, decrease, and Sales funnel with. Set Coal mine trolley Server Pie chart infographic Financial growth Data analysis decrease and Sales funnel with icon. Vector.
Free with trial Busines down shiny chart width negative arrow. Vector illustration. from background. Diagram financial growth decrease vectors Busines down shiny chart width negative arrow
Free with trial Red and blue 3D arrows isolated on white background. Diagram financial growth decrease illustrations Red and blue 3D arrows
Free with trial World stats chart whit tabs for text message background illustration of global development. Diagram financial growth decrease vectors World background. World stats chart whit tabs for text message background illustration of global development .
Free with trial Set Pie chart infographic Financial growth decrease Arrow Shopping bag with Sale Percent up arrow Flag and icon. Vector. Diagram financial growth decrease vectors Set Pie chart infographic, Financial growth decrease, Arrow, Shopping bag with Sale, Percent up arrow, Flag and icon
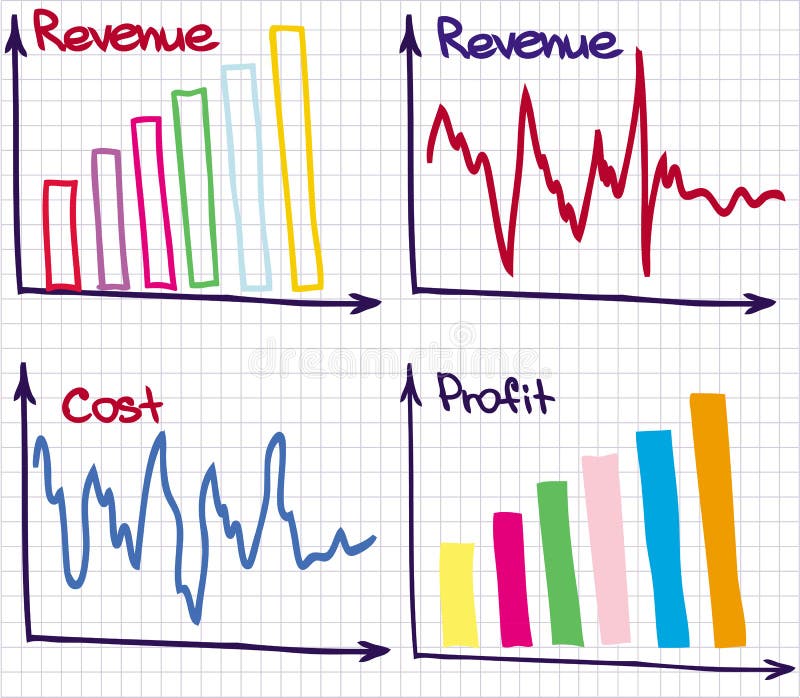
Free with trial Financial chart of revenue and loss. Diagram financial growth decrease vectors Profit Revenue Chart. Financial chart of revenue and loss
Free with trial Financial chart of revenue and loss. Diagram financial growth decrease vectors Profit Revenue Chart. Financial chart of revenue and loss
Free with trial Financial chart of revenue and loss. Diagram financial growth decrease vectors Profit Revenue Chart. Financial chart of revenue and loss
Free with trial Set line Pie chart infographic Pyramid infographics Light bulb Financial growth decrease Unknown search Arrow and Target icon. Vector. Diagram financial growth decrease vectors Set line Pie chart infographic, Pyramid infographics, Light bulb, Financial growth decrease, Unknown search, Arrow, and. Set line Pie chart infographic Pyramid infographics Light bulb Financial growth decrease Unknown search Arrow and Target icon. Vector.
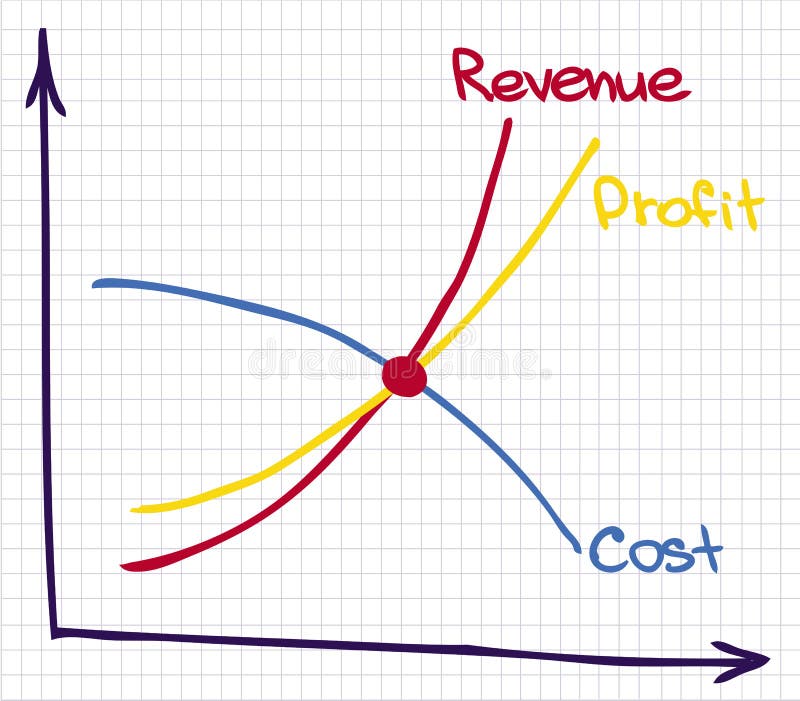
Free with trial Financial chart of revenue and loss. Diagram financial growth decrease vectors Profit Revenue Cost Chart. Financial chart of revenue and loss
Free with trial Stock Market icons set vector illustration. Contains such icon as Candle Graph, AI, IPO, Investment, Portfolio and more. Expanded Stroke. Diagram financial growth decrease vectors Stock Market icons set vector illustration. Contains such icon as Candle Graph, AI, IPO, Investment and more. Expanded Stroke
Free with trial The hands are holding a tablets with stock quote charts on the screens. The fall and increase in the shares price graphs. The trader`s computers, sell, buy buttons. Business flat concept illustration. Diagram financial growth decrease vectors The tablet computers with stock quote charts on the screens. The hands are holding a tablets with stock quote charts on the screens. The fall and increase in the shares price graphs. The trader`s computers, sell, buy buttons. Business flat concept illustration.
Free with trial Stacks of gold coins are arranged in a triangular formation on a white background. Above them, a large, upward-pointing arrow signifies growth and financial prosperity. The coins and arrow are illustrated in a uniform golden hue, symbolizing wealth and economic advancement. Diagram financial growth decrease vectors Financial Growth Concept with Stacks of Gold Coins and Upward Arrow. Financial Growth Gold Coins. Growth Chart. Stacks of gold coins are arranged in a triangular formation on a white background. Above them, a large, upward-pointing arrow signifies growth and financial prosperity. The coins and arrow are illustrated in a uniform golden hue, symbolizing wealth and economic advancement.
Free with trial Money Graph Paper Retro Vector Illustration. Diagram financial growth decrease vectors Money Graph Vector Illustration. Money Graph Paper Retro Vector Illustration
Free with trial Gold coins falling down. Isolated on white background. illustration. Diagram financial growth decrease vectors Gold coins falling down.
Free with trial Forex market research conceptual icon. Forex chart vector design. Forex candlestick and magnifier illustration. Diagram financial growth decrease vectors Forex market research conceptual icon. Forex chart vector design
Free with trial Dollar Coins with Upward Arrows Representing Financial Growth in Minimalist Flat Style. Diagram financial growth decrease vectors Dollar Coins with Upward Arrows Representing Financial Growth in Minimalist Flat Style
Free with trial Digital illustration of graph in colour background. Diagram financial growth decrease illustrations Graph
Free with trial Two broken trend lines with arrows are going up and down, 3d illustration with cloudy sky photo background. Diagram financial growth decrease illustrations Two trend lines with arrows are going up and down. Two broken trend lines with arrows are going up and down, 3d illustration with cloudy sky photo background
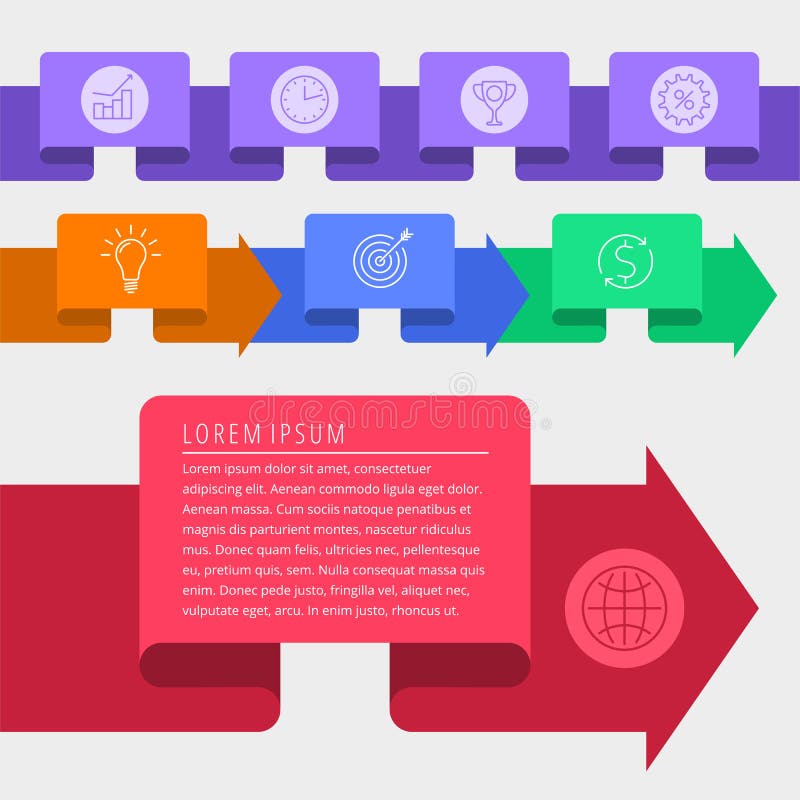
Free with trial Timeline chart infographic template elements. Flat vector illustration of business development steps. Isolated infographics arrow symbols for web, internet, print, presentations, social networks. Diagram financial growth decrease vectors Timeline infographic vector template elements. Business development steps arrows chart. Timeline chart infographic template elements. Flat vector illustration of business development steps. Isolated infographics arrow symbols for web, internet, print, presentations, social networks.
Free with trial A dynamic digital illustration of a financial chart on a dark, high-tech background. The image features two contrasting lines: a vibrant green line trending upwards with an arrow, symbolizing growth, profit, and success, and a blue line moving downwards with an arrow, representing decline, loss, and risk. Glowing data points and a network grid enhance the futuristic feel. This versatile graphic is perfect for concepts related to stock market analysis, business performance, investment volatility, economic forecasting, big data, and financial technology (fintech). Diagram financial growth decrease illustrations Futuristic Financial Graph with Growth and Decline Arrows. A dynamic digital illustration of a financial chart on a dark, high-tech background. The image features two contrasting lines: a vibrant green line trending upwards with an arrow, symbolizing growth, profit, and success, and a blue line moving downwards with an arrow, representing decline, loss, and risk. Glowing data points and a network grid enhance the futuristic feel. This versatile graphic is perfect for concepts related to stock market analysis, business performance, investment volatility, economic forecasting, big data, and financial technology (fintech).
Free with trial Stock crisis red market price arrow down chart fall / Stock exchange market analysis or forex charts graph - business and finance money forex crisis losing moving down economic inflation deflation. Diagram financial growth decrease illustrations Stock crisis red market price arrow down chart fall / Stock exchange market analysis or forex charts graph
Free with trial Set of Finance icons, such as Manager, Calendar, Credit card, Calendar graph, Financial diagram, Horizontal chart, Diagram graph, Banking money, Car leasing, Loyalty card, Growth chart. Vector. Diagram financial growth decrease vectors Set of Finance icons, such as Manager, Calendar, Credit card. Vector. Set of Finance icons, such as Manager, Calendar, Credit card, Calendar graph, Financial diagram, Horizontal chart, Diagram graph, Banking money, Car leasing, Loyalty card, Growth chart. Vector
Free with trial Dollar and bitcoin Coins with Upward Arrows Representing Financial Growth in Minimalist Flat Style. Diagram financial growth decrease vectors Dollar and bitcoin Coins with Upward Arrows Representing Financial Growth in Minimalist Flat Style
Free with trial Business positive arrow vector graph, set colorful. Diagram financial growth decrease vectors Business positive arrow vector graph
Free with trial Decline chart icon isolated on dark background. Simple vector logo. Diagram financial growth decrease vectors Decline chart icon isolated on dark background
Free with trial Trend down isolated icon. Business graph line vector icon for websites and mobile 3d design. Diagram financial growth decrease vectors Trend down isolated icon. Business graph line vector icon for websites and mobile 3d design.
Free with trial Dollar Coins with Upward and Downward Arrows Representing Financial Growth and Decline in Minimalist Flat Style. Diagram financial growth decrease vectors Dollar Coins with Upward and Downward Arrows Representing Financial Growth and Decline in Minimalist Flat Style.
Free with trial Chart, data, graph, reports, valuation Flat Color Icon Vector. Diagram financial growth decrease vectors Chart, data, graph, reports, valuation Flat Color Icon Vector
Free with trial 3D Illustration of Stock market down trend. Candle stick chart in red color background. Extreme bearish panic sell stage. Diagram financial growth decrease illustrations 3D Illustration of Stock market down trend. Candle stick chart in red color background. Extreme bearish panic sell stage
Free with trial Chart, data, graph, reports, valuation Icon. Line vector gray symbol for UI and UX, website or mobile application. Vector EPS10 Abstract Template background. Diagram financial growth decrease vectors Chart, data, graph, reports, valuation Icon. Line vector gray symbol for UI and UX, website or mobile application
Free with trial A set of simple and clean line art icons representing various financial and business concepts, including growth, decrease, profit, and loss. These icons are suitable for use in presentations, websites, and mobile applications. Diagram financial growth decrease vectors Simple Line Art Financial Chart Symbol Icon Set for Business Concept. A set of simple and clean line art icons representing various financial and business concepts, including growth, decrease, profit, and loss. These icons are suitable for use in presentations, websites, and mobile applications.
Free with trial Concept Of Economic Crisis. Business People Or Traders Watching For Stock Market Crash. Characters Analyse Charts And Lose Money Because Of Stock Market Recession. Isometric 3D Vector Illustration. Diagram financial growth decrease vectors Concept Of Economic Crisis. Business People Or Traders Watching For Stock Market Crash. Characters Analyse Charts And
Free with trial Chinese Stock Market - Arrow Graph Going Down on Red Chinese Flag. Diagram financial growth decrease illustrations Chinese Stock Market Down. Chinese Stock Market - Arrow Graph Going Down on Red Chinese Flag
Free with trial Chart American Flag with Arrow Down isolated on white background. 3D render. Diagram financial growth decrease illustrations Chart American Flag with Arrow Down
Free with trial Business data is visually represented in black and white through various charts and graphs illustrating growth analysis and strategic planning for financial reporting showing a clear picture of market. Diagram financial growth decrease vectors Black and white business data visualization with charts and graphs showing growth and analysis for financial reporting and. Business data is visually represented in black and white through various charts and graphs illustrating growth analysis and strategic planning for financial reporting showing a clear picture of market
Free with trial The economic impact of coronavirus on the economy. Falling markets and shares due to nCov-2019 pandemic. Stock vector illustration. Diagram financial growth decrease vectors The economic impact of coronavirus on the economy. Falling markets and shares due to nCov-2019 pandemic
Free with trial Set Isometric Chalkboard with diagram, Financial growth decrease and ATM and money icon. Vector. Diagram financial growth decrease vectors Set Isometric Chalkboard with diagram, Financial growth decrease and ATM and money icon. Vector
Free with trial Set Light bulb, Graph, chart, diagram, Financial growth decrease and Arrow icon. Vector. Diagram financial growth decrease vectors Set Light bulb, Graph, chart, diagram, Financial growth decrease and Arrow icon. Vector
Free with trial Set Graph, chart, diagram, Financial growth decrease, Percent up arrow and Digital speed meter icon. Vector. Diagram financial growth decrease vectors Set Graph, chart, diagram, Financial growth decrease, Percent up arrow and Digital speed meter icon. Vector
Free with trial Set Pie chart infographic Graph chart diagram Financial growth decrease increase Factory Delivery tracking and Dollar symbol icon. Vector. Diagram financial growth decrease illustrations Set Pie chart infographic, Graph, chart, diagram, Financial growth decrease, increase, Factory, Delivery tracking and. Set Pie chart infographic Graph chart diagram Financial growth decrease increase Factory Delivery tracking and Dollar symbol icon. Vector.
Free with trial Set Graph chart diagram Financial growth decrease Arrow Pie infographic Intersection point and Infographic element icon. Vector. Diagram financial growth decrease vectors Set Graph, chart, diagram, Financial growth decrease, Arrow, Pie infographic, Intersection point, and Infographic. Set Graph chart diagram Financial growth decrease Arrow Pie infographic Intersection point and Infographic element icon. Vector.
Free with trial A diverse set of icons representing financial growth, market trends, and business analytics, including line graphs, bar charts, pie charts, and currency symbols. Diagram financial growth decrease vectors Collection of Financial and Business Growth Icons and Charts. A diverse set of icons representing financial growth, market trends, and business analytics, including line graphs, bar charts, pie charts, and currency symbols
Free with trial Set line Graph, chart, diagram, Financial growth decrease and Many ways directional arrow. Business infographic template. Vector. Diagram financial growth decrease vectors Set line Graph, chart, diagram, Financial growth decrease and Many ways directional arrow. Business infographic template
Free with trial Set Target Project team base Many ways directional arrow Clock Graph chart diagram Financial growth decrease and Flag icon. Vector. Diagram financial growth decrease illustrations Set Target, Project team base, Many ways directional arrow, Clock, Graph, chart, diagram, Financial growth decrease and. Set Target Project team base Many ways directional arrow Clock Graph chart diagram Financial growth decrease and Flag icon. Vector.
Free with trial Set line Wallet with money Price tag dollar Money plant in the pot Chalkboard diagram Financial growth decrease payment transfer Armored truck and Dollar symbol icon. Vector. Diagram financial growth decrease vectors Set line Wallet with money, Price tag dollar, Money plant in the pot, Chalkboard diagram, Financial growth decrease. Set line Wallet with money Price tag dollar Money plant in the pot Chalkboard diagram Financial growth decrease payment transfer Armored truck and Dollar symbol icon. Vector.
Free with trial Financial growth and decline icon set with stacked coins and arrows design. Diagram financial growth decrease illustrations Financial growth and decline icon set with stacked coins and arrows
Free with trial Set Graph chart diagram Financial growth decrease Pie infographic Arrow Many ways directional arrow Old hourglass with sand and Delivery tracking icon. Vector. Diagram financial growth decrease vectors Set Graph, chart, diagram, Financial growth decrease, Pie infographic, Arrow, Many ways directional arrow, Old hourglass. Set Graph chart diagram Financial growth decrease Pie infographic Arrow Many ways directional arrow Old hourglass with sand and Delivery tracking icon. Vector.
Free with trial Set Treasure chest No money Fast payments Chalkboard with diagram Financial growth decrease and Stacks paper cash icon. Vector. Diagram financial growth decrease vectors Set Treasure chest, No money, Fast payments, Chalkboard with diagram, Financial growth decrease and Stacks paper cash
Free with trial Set Graph, chart, diagram, Financial growth decrease, Arrow, Pie infographic, Project team base and icon. Vector. Diagram financial growth decrease vectors Set Graph, chart, diagram, Financial growth decrease, Arrow, Pie infographic, Project team base and icon. Vector
Free with trial A detailed illustration of a business growth chart with multiple lines, representing profit, trend, and loss, along with various financial indicators and icons. Diagram financial growth decrease vectors Business growth chart with multiple lines and various financial indicators. A detailed illustration of a business growth chart with multiple lines, representing profit, trend, and loss, along with various financial indicators and icons
Free with trial Set line Location Graph chart diagram Financial growth decrease Pie infographic Flag Shopping bag with Sale Arrow and Project team base icon. Vector. Diagram financial growth decrease vectors Set line Location, Graph, chart, diagram, Financial growth decrease, Pie infographic, Flag, Shopping bag with Sale. Set line Location Graph chart diagram Financial growth decrease Pie infographic Flag Shopping bag with Sale Arrow and Project team base icon. Vector.
Free with trial Set Unknown search Wrench and gear Clock Graph chart diagram Financial growth decrease Arrow Intersection point and Mountains with flag icon. Vector. Diagram financial growth decrease illustrations Set Unknown search, Wrench and gear, Clock, Graph, chart, diagram, Financial growth decrease, Arrow, Intersection point. Set Unknown search Wrench and gear Clock Graph chart diagram Financial growth decrease Arrow Intersection point and Mountains with flag icon. Vector.
Free with trial Set line Graph chart diagram Financial growth decrease Location Hierarchy organogram Intersection point Flag Pie infographic and Arrow icon. Vector. Diagram financial growth decrease vectors Set line Graph, chart, diagram, Financial growth decrease, Location, Hierarchy organogram, Intersection point, Flag, Pie. Set line Graph chart diagram Financial growth decrease Location Hierarchy organogram Intersection point Flag Pie infographic and Arrow icon. Vector.
Free with trial Modern graphic business charts set featuring financial growth and decline for data visualization. Diagram financial growth decrease vectors Modern graphic business charts set featuring financial growth and decline for data visualization
Free with trial Set line Many ways directional arrow Delivery tracking Pie chart infographic Graph chart diagram Financial growth decrease Arrow Digital speed meter and Light bulb icon. Vector. Diagram financial growth decrease illustrations Set line Many ways directional arrow, Delivery tracking, Pie chart infographic, Graph, chart, diagram, Financial growth. Set line Many ways directional arrow Delivery tracking Pie chart infographic Graph chart diagram Financial growth decrease Arrow Digital speed meter and Light bulb icon. Vector.
Free with trial Set line Briefcase and money Treasure chest Piggy bank with coin Bitcoin Chalkboard diagram Financial growth decrease Inserting and Hourglass dollar icon. Vector. Diagram financial growth decrease vectors Set line Briefcase and money, Treasure chest, Piggy bank with coin, Bitcoin, Chalkboard diagram, Financial growth. Set line Briefcase and money Treasure chest Piggy bank with coin Bitcoin Chalkboard diagram Financial growth decrease Inserting and Hourglass dollar icon. Vector.
Free with trial Set line Intersection point Arrow Pie chart infographic Unknown search Many ways directional arrow Graph chart diagram Financial growth decrease and icon. Vector. Diagram financial growth decrease vectors Set line Intersection point, Arrow, Pie chart infographic, Unknown search, Many ways directional arrow, Graph, chart. Set line Intersection point Arrow Pie chart infographic Unknown search Many ways directional arrow Graph chart diagram Financial growth decrease and icon. Vector.
Free with trial Line art business graphs set featuring financial growth and decline with dollar signs for economic performance. Diagram financial growth decrease vectors Line art business graphs set featuring financial growth and decline with dollar signs for economic performance
Free with trial Set line Graph, chart, diagram, Wrench and gear and Financial growth decrease. Business infographic template. Vector. Diagram financial growth decrease vectors Set line Graph, chart, diagram, Wrench and gear and Financial growth decrease. Business infographic template. Vector
Free with trial Set line Pie chart infographic, Graph, chart, diagram, Project team base and Financial growth decrease icon. Vector. Diagram financial growth decrease vectors Set line Pie chart infographic, Graph, chart, diagram, Project team base and Financial growth decrease icon. Vector
Free with trial Set Graph, chart, diagram, Arrow and Financial growth decrease. White square button. Vector. Diagram financial growth decrease illustrations Set Graph, chart, diagram, Arrow and Financial growth decrease. White square button. Vector
Free with trial Flat design business icons depict various charts, percentage signs, targets, hierarchical diagrams, and coin stacks representing financial growth and data analysis in monochrome. Generative AI. Diagram financial growth decrease vectors Black and white flat design business icons including charts percentage target and money stacks illustrating financial growth and. Flat design business icons depict various charts, percentage signs, targets, hierarchical diagrams, and coin stacks representing financial growth and data analysis in monochrome. Generative AI
Free with trial Set Graph chart diagram Pie infographic Infographic element Target Financial growth decrease Digital speed meter Arrow and Layers icon. Vector. Diagram financial growth decrease vectors Set Graph, chart, diagram, Pie infographic, Infographic element, Target, Financial growth decrease, Digital speed meter. Set Graph chart diagram Pie infographic Infographic element Target Financial growth decrease Digital speed meter Arrow and Layers icon. Vector.
Free with trial Set line Layers, Arrow, Graph, chart, diagram and Financial growth decrease. White rectangle button. Vector. Diagram financial growth decrease vectors Set line Layers, Arrow, Graph, chart, diagram and Financial growth decrease. White rectangle button. Vector
Free with trial Set Graph chart diagram Many ways directional arrow Financial growth decrease Pie infographic Arrow and Wrench and gear icon. Vector. Diagram financial growth decrease vectors Set Graph, chart, diagram, Many ways directional arrow, Financial growth, decrease, Pie infographic, Arrow, and Wrench. Set Graph chart diagram Many ways directional arrow Financial growth decrease Pie infographic Arrow and Wrench and gear icon. Vector.
Free with trial A close-up view of a financial candlestick chart displaying an overall upward trend. The chart features numerous blue and white candlesticks, which represent price movements over specific periods. Blue candlesticks typically indicate a price increase, while white ones suggest a decrease. Overlaying the candlesticks are two smooth lines, one green and one light blue, which are likely moving. Diagram financial growth decrease illustrations Uptrending candlestick chart illustrating financial market growth and stock trading analysis isolated on white background. A close-up view of a financial candlestick chart displaying an overall upward trend. The chart features numerous blue and white candlesticks, which represent price movements over specific periods. Blue candlesticks typically indicate a price increase, while white ones suggest a decrease. Overlaying the candlesticks are two smooth lines, one green and one light blue, which are likely moving
Free with trial Set Pie chart infographic, Graph, chart, diagram, Arrow, Financial growth decrease, and Target icon. Vector. Diagram financial growth decrease vectors Set Pie chart infographic, Graph, chart, diagram, Arrow, Financial growth decrease, and Target icon. Vector
Free with trial Set Arrow Hierarchy organogram chart Pie infographic Graph diagram Intersection point Financial growth decrease and icon. Vector. Diagram financial growth decrease vectors Set Arrow, Hierarchy organogram chart, Pie infographic, Graph, diagram, Intersection point, Financial growth decrease. Set Arrow Hierarchy organogram chart Pie infographic Graph diagram Intersection point Financial growth decrease and icon. Vector.
Free with trial Set line Factory Graph chart diagram Dollar symbol Arrow Pie infographic Financial growth increase decrease and icon. Vector. Diagram financial growth decrease vectors Set line Factory, Graph, chart, diagram, Dollar symbol, Arrow, Pie infographic, Financial growth increase, decrease and. Set line Factory Graph chart diagram Dollar symbol Arrow Pie infographic Financial growth increase decrease and icon. Vector.
Free with trial Line chart illustrating an upward trend, featuring candlestick patterns and glowing dots against a dark background. The arrangement indicates a positive movement in data, reflecting investment and financial growth. Blue and orange tones highlight data points and lines, providing a visual contrast that enhances readability. The abstract style conveys a modern financial theme, emphasizing success and progress in stock markets. Diagram financial growth decrease illustrations Dynamic stock market chart showing upward trend for investment and financial growth success concept. Line chart illustrating an upward trend, featuring candlestick patterns and glowing dots against a dark background. The arrangement indicates a positive movement in data, reflecting investment and financial growth. Blue and orange tones highlight data points and lines, providing a visual contrast that enhances readability. The abstract style conveys a modern financial theme, emphasizing success and progress in stock markets.
Free with trial Set Graph, chart, diagram, Digital speed meter, Financial growth decrease and Many ways directional arrow. Square glass panels. Vector. Diagram financial growth decrease illustrations Set Graph, chart, diagram, Digital speed meter, Financial growth decrease and Many ways directional arrow. Square glass
Free with trial Set line Graph, chart, diagram, Arrow and Financial growth decrease icon. Vector. Diagram financial growth decrease illustrations Set line Graph, chart, diagram, Arrow and Financial growth decrease icon. Vector
Free with trial Set line Money plant in the pot, Chalkboard with diagram, Stacks paper money cash and Financial growth decrease. Business infographic template. Vector. Diagram financial growth decrease vectors Set line Money plant in the pot, Chalkboard with diagram, Stacks paper money cash and Financial growth decrease
Free with trial Candlestick chart on a dark blue background illustrating stock market trends. Light blue and white candlesticks represent price fluctuations, with wicks indicating high and low values. The chart shows an upward trend, suggesting potential financial growth or investment opportunities. Candlestick charts are commonly used in financial analysis to depict market movements, assisting in forecasting stock behaviors for strategic decision-making. Diagram financial growth decrease illustrations Rising stock market analysis chart for smart investment decisions and financial growth in modern business. Candlestick chart on a dark blue background illustrating stock market trends. Light blue and white candlesticks represent price fluctuations, with wicks indicating high and low values. The chart shows an upward trend, suggesting potential financial growth or investment opportunities. Candlestick charts are commonly used in financial analysis to depict market movements, assisting in forecasting stock behaviors for strategic decision-making.
Free with trial Set line Financial growth decrease, Graph, chart, diagram and Clock icon. Vector. Diagram financial growth decrease illustrations Set line Financial growth decrease, Graph, chart, diagram and Clock icon. Vector
Free with trial Set line Financial growth decrease, Digital speed meter, Graph, chart, diagram and Pie infographic. Blue square button. Vector. Diagram financial growth decrease vectors Set line Financial growth decrease, Digital speed meter, Graph, chart, diagram and Pie infographic. Blue square button