Free with trial Set line Financial growth decrease, Graph, chart, diagram and Arrow icon. Vector. Diagram financial growth decrease illustrations Set line Financial growth decrease, Graph, chart, diagram and Arrow icon. Vector
Free with trial Decrease : Decrease represents a reduction in value, profit, or financial performance over a specific period. Diagram financial growth decrease vectors Illustration of Decrease. Decrease : Decrease represents a reduction in value, profit, or financial performance over a specific period.
Free with trial Set line Financial growth decrease, Wrench and gear, Graph, chart, diagram and. Color circle button. Vector. Diagram financial growth decrease vectors Set line Financial growth decrease, Wrench and gear, Graph, chart, diagram and . Color circle button. Vector
Free with trial Set line Financial growth decrease, Arrow and Graph, chart, diagram. Business infographic template. Vector. Diagram financial growth decrease vectors Set line Financial growth decrease, Arrow and Graph, chart, diagram. Business infographic template. Vector
Free with trial Set Many ways directional arrow Clock Financial growth decrease Pie chart infographic Graph chart diagram and Dollar symbol icon. Vector. Diagram financial growth decrease vectors Set Many ways directional arrow, Clock, Financial growth decrease, Pie chart infographic, Graph, chart, diagram, and. Set Many ways directional arrow Clock Financial growth decrease Pie chart infographic Graph chart diagram and Dollar symbol icon. Vector.
Free with trial A clean and modern vector illustration featuring graphic symbols for business growth and decline. This EPS file shows an upward-trending green arrow for success and a downward-trending red arrow for loss, both depicted on a stylized financial chart. Ideal for corporate presentations, financial reports, economic analysis, and stock market metaphors. Diagram financial growth decrease vectors Growth And Decline Chart Graphic Symbol. A clean and modern vector illustration featuring graphic symbols for business growth and decline. This EPS file shows an upward-trending green arrow for success and a downward-trending red arrow for loss, both depicted on a stylized financial chart. Ideal for corporate presentations, financial reports, economic analysis, and stock market metaphors.
Free with trial Set line Financial growth decrease, Graph, chart, diagram and Many ways directional arrow. Colored shapes. Vector. Diagram financial growth decrease vectors Set line Financial growth decrease, Graph, chart, diagram and Many ways directional arrow. Colored shapes. Vector
Free with trial Set line Financial growth decrease, Graph, chart, diagram, Pie infographic and Layers. Gradient color icons. Vector. Diagram financial growth decrease vectors Set line Financial growth decrease, Graph, chart, diagram, Pie infographic and Layers. Gradient color icons. Vector
Free with trial Set line Project team base, Financial growth decrease, Graph, chart, diagram and Wrench and gear. Gradient color icons. Vector. Diagram financial growth decrease vectors Set line Project team base, Financial growth decrease, Graph, chart, diagram and Wrench and gear. Gradient color icons
Free with trial Blue growing chart and magnifying glass with falling coins inside. Market analysis, financial audit, growth tracking, decline detection, data insight concept. Digital futuristic low poly style Vector. Diagram financial growth decrease vectors Blue growing chart and magnifying glass with falling coins inside. Market analysis, financial audit, growth tracking. Decline detection, data insight concept. Blue growing chart and magnifying glass with falling coins inside. Market analysis, financial audit, growth tracking, decline detection, data insight concept. Digital futuristic low poly style Vector.
Free with trial Set line Financial growth decrease, Graph, chart, diagram, Arrow and icon. Vector. Diagram financial growth decrease illustrations Set line Financial growth decrease, Graph, chart, diagram, Arrow and icon. Vector
Free with trial Set Pie chart infographic Arrow Financial growth decrease Graph chart diagram Many ways directional arrow Infographic element and Old hourglass with sand icon. Vector. Diagram financial growth decrease vectors Set Pie chart infographic, Arrow, Financial growth decrease, Graph, chart, diagram, Many ways directional arrow. Set Pie chart infographic Arrow Financial growth decrease Graph chart diagram Many ways directional arrow Infographic element and Old hourglass with sand icon. Vector.
Free with trial Set line Mountains with flag, Many ways directional arrow, Financial growth decrease and Graph, chart, diagram. Color circle button. Vector. Diagram financial growth decrease illustrations Set line Mountains with flag, Many ways directional arrow, Financial growth decrease and Graph, chart, diagram. Color
Free with trial Simple black and white vector illustration showing bar charts indicating increase and decrease, perfect for financial or data concepts. Diagram financial growth decrease vectors Bar chart icon showing increase and decrease data. Simple black and white vector illustration showing bar charts indicating increase and decrease, perfect for financial or data concepts
Free with trial Set line Financial growth decrease Unknown search Mountains with flag Flag Graph chart diagram Infographic element and increase icon. Vector. Diagram financial growth decrease vectors Set line Financial growth decrease, Unknown search, Mountains with flag, Flag, Graph, chart, diagram, Infographic. Set line Financial growth decrease Unknown search Mountains with flag Flag Graph chart diagram Infographic element and increase icon. Vector.
Free with trial Set Old hourglass with sand Financial growth decrease Arrow Many ways directional arrow Graph chart diagram Flag and icon. Vector. Diagram financial growth decrease vectors Set Old hourglass with sand, Financial growth decrease, Arrow, Many ways directional arrow, Graph, chart, diagram, Flag. Set Old hourglass with sand Financial growth decrease Arrow Many ways directional arrow Graph chart diagram Flag and icon. Vector.
Free with trial Set pop art Chalkboard with diagram, Envelope dollar symbol, Price tag and Financial growth decrease icon. Vector. Diagram financial growth decrease vectors Set pop art Chalkboard with diagram, Envelope dollar symbol, Price tag and Financial growth decrease icon. Vector
Free with trial Financial graph with green and red pointers, Business strategy, Business concept, Price increase, Price decrease. Diagram financial growth decrease vectors Financial graph with green and red pointers, Business strategy, Business concept
Free with trial Set Chalkboard with diagram, Price tag dollar, Financial growth decrease and Paper or financial check icon. Vector. Diagram financial growth decrease vectors Set Chalkboard with diagram, Price tag dollar, Financial growth decrease and Paper or financial check icon. Vector
Free with trial Set Clock Graph chart diagram Pie infographic Financial growth decrease Infographic element Arrow and Target icon. Vector. Diagram financial growth decrease vectors Set Clock, Graph, chart, diagram, Pie infographic, Financial growth decrease, Infographic element, Arrow and Target icon
Free with trial Set line Graph chart diagram Project team base Arrow Target Financial growth decrease and Percent up arrow icon. Vector. Diagram financial growth decrease vectors Set line Graph, chart, diagram, Project team base, Arrow, Target, Financial growth decrease, and Percent up arrow icon
Free with trial Financial graph with green and red pointers, Business strategy, Business concept, Price increase, Price decrease. Diagram financial growth decrease vectors Financial graph with green and red pointers, Business strategy, Business concept
Free with trial Set line Graph chart diagram Pie infographic Financial growth decrease Clock Digital speed meter Old hourglass with sand and Arrow icon. Vector. Diagram financial growth decrease vectors Set line Graph, chart, diagram, Pie infographic, Financial growth decrease, Clock, Digital speed meter, Old hourglass. Set line Graph chart diagram Pie infographic Financial growth decrease Clock Digital speed meter Old hourglass with sand and Arrow icon. Vector.
Free with trial Set line Graph chart diagram Pie infographic Financial growth decrease Clock Digital speed meter Old hourglass with sand and Arrow icon. Vector. Diagram financial growth decrease illustrations Set line Graph, chart, diagram, Pie infographic, Financial growth decrease, Clock, Digital speed meter, Old hourglass. Set line Graph chart diagram Pie infographic Financial growth decrease Clock Digital speed meter Old hourglass with sand and Arrow icon. Vector.
Free with trial Set Factory Light bulb Pie chart infographic Graph chart diagram Financial growth increase Intersection point and decrease icon. Vector. Diagram financial growth decrease vectors Set Factory, Light bulb, Pie chart infographic, Graph, chart, diagram, Financial growth increase, Intersection point and. Set Factory Light bulb Pie chart infographic Graph chart diagram Financial growth increase Intersection point and decrease icon. Vector.
Free with trial Financial graph with green and red pointers, Business strategy, Business concept, Price increase, Price decrease. Diagram financial growth decrease vectors Financial graph with green and red pointers, Business strategy, Business concept
Free with trial Set Pie chart infographic Factory Financial growth Clock Graph chart diagram Many ways directional arrow decrease and Percent up icon. Vector. Diagram financial growth decrease vectors Set Pie chart infographic, Factory, Financial growth, Clock, Graph, chart, diagram, Many ways directional arrow. Set Pie chart infographic Factory Financial growth Clock Graph chart diagram Many ways directional arrow decrease and Percent up icon. Vector.
Free with trial Set Financial growth decrease Arrow Wrench and gear Pie chart infographic Graph chart diagram and Many ways directional arrow icon. Vector. Diagram financial growth decrease vectors Set Financial growth decrease, Arrow, Wrench and gear, Pie chart infographic, Graph, chart, diagram and Many ways. Set Financial growth decrease Arrow Wrench and gear Pie chart infographic Graph chart diagram and Many ways directional arrow icon. Vector.
Free with trial Set Pie chart infographic Wrench and gear Financial growth decrease Clock Dollar symbol Graph chart diagram and Old hourglass with sand icon. Vector. Diagram financial growth decrease illustrations Set Pie chart infographic, Wrench and gear, Financial growth decrease, Clock, Dollar symbol, Graph, chart, diagram, and. Set Pie chart infographic Wrench and gear Financial growth decrease Clock Dollar symbol Graph chart diagram and Old hourglass with sand icon. Vector.
Free with trial Abstract illustration of a financial graph with glowing lines on a dark background. The graph shows two distinct curves, one starting in cool blue tones and transitioning to warm orange hues, suggesting a shift in market trends or performance. The image conveys concepts of data analysis, growth, decline, and financial forecasting. Suitable for illustrating business reports, presentations, or articles related to finance, investment, and economics. Diagram financial growth decrease illustrations Abstract Financial Graph Illustration. Abstract illustration of a financial graph with glowing lines on a dark background. The graph shows two distinct curves, one starting in cool blue tones and transitioning to warm orange hues, suggesting a shift in market trends or performance. The image conveys concepts of data analysis, growth, decline, and financial forecasting. Suitable for illustrating business reports, presentations, or articles related to finance, investment, and economics.
Free with trial Set Arrow, Financial growth decrease, Pie chart infographic, Graph, chart, diagram, Target, and Factory icon. Vector. Diagram financial growth decrease vectors Set Arrow, Financial growth decrease, Pie chart infographic, Graph, chart, diagram, Target, and Factory icon. Vector
Free with trial Set Unknown search Pie chart infographic Clock Target Financial growth decrease Arrow Graph chart diagram and icon. Vector. Diagram financial growth decrease illustrations Set Unknown search, Pie chart infographic, Clock, Target, Financial growth decrease, Arrow, Graph, chart, diagram and. Set Unknown search Pie chart infographic Clock Target Financial growth decrease Arrow Graph chart diagram and icon. Vector.
Free with trial Set Financial growth decrease Pie chart infographic Graph chart diagram Location Pyramid infographics and icon. Vector. Diagram financial growth decrease vectors Set Financial growth decrease, Pie chart infographic, Graph, chart, diagram, Location, Pyramid infographics, and icon
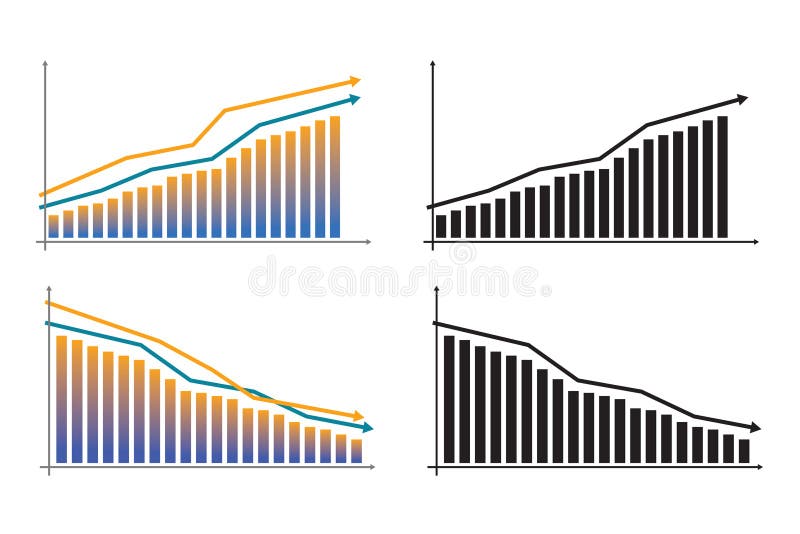
Free with trial This image displays a set of stylized bar chart icons representing financial and business trends. The leftmost icon features green bars increasing in height, accompanied by a green upward-pointing arrow, symbolizing growth and success. The middle icon shows red bars decreasing in height, with a black downward-pointing arrow indicating decline and loss. The right side presents two smaller black and white bar charts, also depicting downward trends. These icons are ideal for illustrating concepts like profit, loss, market trends, economic performance, and data analysis. Diagram financial growth decrease illustrations Growth and Decline Bar Chart Icons. This image displays a set of stylized bar chart icons representing financial and business trends. The leftmost icon features green bars increasing in height, accompanied by a green upward-pointing arrow, symbolizing growth and success. The middle icon shows red bars decreasing in height, with a black downward-pointing arrow indicating decline and loss. The right side presents two smaller black and white bar charts, also depicting downward trends. These icons are ideal for illustrating concepts like profit, loss, market trends, economic performance, and data analysis.
Free with trial Set Layers Financial growth increase Pie chart infographic Arrow Location decrease and Graph chart diagram icon. Vector. Diagram financial growth decrease vectors Set Layers, Financial growth increase, Pie chart infographic, Arrow, Location, decrease and Graph, chart, diagram icon
Free with trial Set Financial growth decrease Pie chart infographic Arrow increase Shopping bag with Sale and Graph chart diagram icon. Vector. Diagram financial growth decrease vectors Set Financial growth decrease, Pie chart infographic, Arrow, increase, Shopping bag with Sale, and Graph, chart, diagram. Set Financial growth decrease Pie chart infographic Arrow increase Shopping bag with Sale and Graph chart diagram icon. Vector.
Free with trial Set line Pie chart infographic Arrow Financial growth decrease Target Hierarchy organogram and Graph chart diagram icon. Vector. Diagram financial growth decrease vectors Set line Pie chart infographic, Arrow, Financial growth decrease, Target, Hierarchy organogram and Graph, chart, diagram. Set line Pie chart infographic Arrow Financial growth decrease Target Hierarchy organogram and Graph chart diagram icon. Vector.
Free with trial Business strategy, performance analysis, goal setting, success tracking, financial growth, decision-making. Visual includes bar chart, target with an arrow and directional arrows. Business strategy. Diagram financial growth decrease vectors Business Growth, Performance Metrics, and Success Concept with Charts, Arrows, and Target Symbol. Business strategy, performance analysis, goal setting, success tracking, financial growth, decision-making. Visual includes bar chart, target with an arrow and directional arrows. Business strategy
Free with trial Set line Financial growth decrease Graph chart diagram Hierarchy organogram Arrow Location Target and Digital speed meter icon. Vector. Diagram financial growth decrease illustrations Set line Financial growth decrease, Graph, chart, diagram, Hierarchy organogram, Arrow, Location, Target and Digital. Set line Financial growth decrease Graph chart diagram Hierarchy organogram Arrow Location Target and Digital speed meter icon. Vector.
Free with trial Set Light bulb, Arrow, Location, Financial growth decrease, Intersection point and Graph, chart, diagram icon. Vector. Diagram financial growth decrease vectors Set Light bulb, Arrow, Location, Financial growth decrease, Intersection point and Graph, chart, diagram icon. Vector
Free with trial Set line Factory Unknown search Financial growth decrease Graph chart diagram Arrow Hierarchy organogram Dollar symbol and Target icon. Vector. Diagram financial growth decrease vectors Set line Factory, Unknown search, Financial growth decrease, Graph, chart, diagram, Arrow, Hierarchy organogram, Dollar. Set line Factory Unknown search Financial growth decrease Graph chart diagram Arrow Hierarchy organogram Dollar symbol and Target icon. Vector.
Free with trial This comprehensive vector illustration features a set of 18 flat icons depicting various financial trends, market indicators, and warning signals. The collection includes rising and falling line graphs, bar charts, currency symbols (dollar and euro) indicating fluctuations, and alert symbols like sirens and exclamation marks. Ideal for illustrating concepts of economic growth, decline, market volatility, financial crisis, investment risks, and business performance. Perfect for presentations, reports, websites, and applications related to finance, economics, and stock markets. Diagram financial growth decrease vectors Financial Trends, Market Indicators and Crisis Alert Icons Set. This comprehensive vector illustration features a set of 18 flat icons depicting various financial trends, market indicators, and warning signals. The collection includes rising and falling line graphs, bar charts, currency symbols (dollar and euro) indicating fluctuations, and alert symbols like sirens and exclamation marks. Ideal for illustrating concepts of economic growth, decline, market volatility, financial crisis, investment risks, and business performance. Perfect for presentations, reports, websites, and applications related to finance, economics, and stock markets.
Free with trial Set Pie chart infographic Layers Location Flag Financial growth decrease Clock and Graph chart diagram icon. Vector. Diagram financial growth decrease vectors Set Pie chart infographic, Layers, Location, Flag, Financial growth decrease, Clock and Graph, chart, diagram icon
Free with trial Set line Arrow Flag Clock Financial growth decrease Pyramid chart infographics Graph chart diagram and Intersection point icon. Vector. Diagram financial growth decrease illustrations Set line Arrow, Flag, Clock, Financial growth decrease, Pyramid chart infographics, Graph, chart, diagram and. Set line Arrow Flag Clock Financial growth decrease Pyramid chart infographics Graph chart diagram and Intersection point icon. Vector.
Free with trial Set line Arrow Flag Clock Financial growth decrease Pyramid chart infographics Graph chart diagram and Intersection point icon. Vector. Diagram financial growth decrease vectors Set line Arrow, Flag, Clock, Financial growth decrease, Pyramid chart infographics, Graph, chart, diagram and. Set line Arrow Flag Clock Financial growth decrease Pyramid chart infographics Graph chart diagram and Intersection point icon. Vector.
Free with trial Stickman presenting income growth with upward arrow and expenses decrease illustrated with chart. Perfect for financial themed presentations. Use as simple visual tool to show financial concepts on. Diagram financial growth decrease illustrations Stickman with Financial Graphic Illustration on White Background. Stickman presenting income growth with upward arrow and expenses decrease illustrated with chart. Perfect for financial themed presentations. Use as simple visual tool to show financial concepts on
Free with trial Set line Graph chart diagram Location Unknown search Percent up arrow Arrow Financial growth decrease and Digital speed meter icon. Vector. Diagram financial growth decrease illustrations Set line Graph, chart, diagram, Location, Unknown search, Percent up arrow, Arrow, Financial growth decrease, and. Set line Graph chart diagram Location Unknown search Percent up arrow Arrow Financial growth decrease and Digital speed meter icon. Vector.
Free with trial Set line Diamond Armored truck Chalkboard with diagram Money exchange Financial growth decrease ATM and money Piggy bank coin and Paper financial check icon. Vector. Diagram financial growth decrease vectors Set line Diamond, Armored truck, Chalkboard with diagram, Money exchange, Financial growth decrease, ATM and money. Set line Diamond Armored truck Chalkboard with diagram Money exchange Financial growth decrease ATM and money Piggy bank coin and Paper financial check icon. Vector.
Free with trial Set line Treasure chest Gold bars Chalkboard with diagram Stacks paper money cash ATM and Financial growth decrease and Price tag dollar icon. Vector. Diagram financial growth decrease vectors Set line Treasure chest, Gold bars, Chalkboard with diagram, Stacks paper money cash, ATM and, Financial growth decrease. Set line Treasure chest Gold bars Chalkboard with diagram Stacks paper money cash ATM and Financial growth decrease and Price tag dollar icon. Vector.
Free with trial This vector illustration set features six distinct icons representing key financial and economic concepts. It includes bar charts depicting growth with a green arrow and decline with a red arrow, alongside currency exchange rate indicators for USD, INR, and EUR. Two donut charts visualize data distribution, while a world map colored green and red signifies global market trends or segmentation. Ideal for business presentations, financial reports, economic analysis, and investment-related content, these versatile graphics convey complex data clearly and concisely. Diagram financial growth decrease vectors Financial Growth, Decline, and Global Market Data Visualization Icons Set. This vector illustration set features six distinct icons representing key financial and economic concepts. It includes bar charts depicting growth with a green arrow and decline with a red arrow, alongside currency exchange rate indicators for USD, INR, and EUR. Two donut charts visualize data distribution, while a world map colored green and red signifies global market trends or segmentation. Ideal for business presentations, financial reports, economic analysis, and investment-related content, these versatile graphics convey complex data clearly and concisely.
Free with trial Set line Graph chart diagram Pie infographic Dollar symbol Many ways directional arrow Arrow and Financial growth decrease icon. Vector. Diagram financial growth decrease vectors Set line Graph, chart, diagram, Pie infographic, Dollar symbol, Many ways directional arrow, Arrow, and Financial growth. Set line Graph chart diagram Pie infographic Dollar symbol Many ways directional arrow Arrow and Financial growth decrease icon. Vector.
Free with trial Set Graph chart diagram Light bulb Pie infographic Old hourglass with sand Intersection point Arrow Financial growth decrease and icon. Vector. Diagram financial growth decrease vectors Set Graph, chart, diagram, Light bulb, Pie infographic, Old hourglass with sand, Intersection point, Arrow, Financial. Set Graph chart diagram Light bulb Pie infographic Old hourglass with sand Intersection point Arrow Financial growth decrease and icon. Vector.
Free with trial Set line Many ways directional arrow Graph chart diagram Project team base Infographic element Financial growth decrease Pie infographic and Digital speed meter icon. Vector. Diagram financial growth decrease vectors Set line Many ways directional arrow, Graph, chart, diagram, Project team base, Infographic element, Financial growth. Set line Many ways directional arrow Graph chart diagram Project team base Infographic element Financial growth decrease Pie infographic and Digital speed meter icon. Vector.
Free with trial Stock market. The rise and fall of securities. Successful trading. Market trend up green and red down arrows, financial graphs. Business investment growth and loss arrow. Graph going up and down symbol vector illustration. Diagram financial growth decrease vectors Stock market. The rise and fall of securities. Successful trading. Market trend up green and red down arrows, financial graphs.
Free with trial Set line Graph chart diagram Pie infographic Target Digital speed meter Shopping bag with Sale Financial growth decrease and Mountains flag icon. Vector. Diagram financial growth decrease vectors Set line Graph, chart, diagram, Pie infographic, Target, Digital speed meter, Shopping bag with Sale, Financial growth. Set line Graph chart diagram Pie infographic Target Digital speed meter Shopping bag with Sale Financial growth decrease and Mountains flag icon. Vector.
Free with trial Set line Flag Graph chart diagram Delivery tracking Pyramid infographics Financial growth Project team base and decrease icon. Vector. Diagram financial growth decrease vectors Set line Flag, Graph, chart, diagram, Delivery tracking, Pyramid infographics, Financial growth, Project team base and. Set line Flag Graph chart diagram Delivery tracking Pyramid infographics Financial growth Project team base and decrease icon. Vector.
Free with trial Set line Mind map infographic, Financial growth decrease and icon. Vector. Diagram financial growth decrease illustrations Set line Mind map infographic, Financial growth decrease and icon. Vector
Free with trial Stock market. The rise and fall of securities. Successful trading. Market trend up green and red down arrows, financial graphs. Business investment growth and loss arrow. Graph going up and down symbol vector illustration. Diagram financial growth decrease vectors Stock market. The rise and fall of securities. Successful trading. Market trend up green and red down arrows, financial graphs.
Free with trial Set Isometric Financial growth decrease Data analysis and Pie chart infographic icon. Vector. Diagram financial growth decrease vectors Set Isometric Financial growth decrease, Data analysis and Pie chart infographic icon. Vector
Free with trial Pop art Financial growth decrease icon isolated on color background. Increasing revenue. Vector. Diagram financial growth decrease vectors Pop art Financial growth decrease icon isolated on color background. Increasing revenue. Vector
Free with trial Set line Search cloud computing, Financial growth decrease and Pie chart infographic icon. Vector. Diagram financial growth decrease vectors Set line Search cloud computing, Financial growth decrease and Pie chart infographic icon. Vector
Free with trial Stock market. The rise and fall of securities. Successful trading. Market trend up green and red down arrows, financial graphs. Business investment growth and loss arrow. Graph going up and down symbol vector illustration. Diagram financial growth decrease vectors Stock market. The rise and fall of securities. Successful trading. Market trend up green and red down arrows, financial graphs.
Free with trial Set line Calculator Pie chart infographic Financial growth decrease and Network cloud connection. Business infographic template. Vector. Diagram financial growth decrease illustrations Set line Calculator, Pie chart infographic, Financial growth decrease and Network cloud connection. Business infographic
Free with trial Set line Pie chart infographic, Financial growth increase, decrease and Old hourglass with sand icon. Vector. Diagram financial growth decrease vectors Set line Pie chart infographic, Financial growth increase, decrease and Old hourglass with sand icon. Vector
Free with trial Green Financial growth decrease icon isolated on black background. Increasing revenue. Black square button. Vector. Diagram financial growth decrease vectors Green Financial growth decrease icon isolated on black background. Increasing revenue. Black square button. Vector
Free with trial Stock market. The rise and fall of securities. Successful trading. Market trend up green and red down arrows, financial graphs. Business investment growth and loss arrow. Graph going up and down symbol vector illustration. Diagram financial growth decrease vectors Stock market. The rise and fall of securities. Successful trading. Market trend up green and red down arrows, financial graphs.
Free with trial Grey Financial growth decrease icon isolated on purple-blue background. Increasing revenue. Minimalism concept. 3D render illustration. Diagram financial growth decrease illustrations Grey Financial growth decrease icon isolated on purple-blue background. Increasing revenue. Minimalism concept. 3D
Free with trial Purple-blue Financial growth decrease icon isolated on grey background. Increasing revenue. Minimalism concept. 3D render illustration. Diagram financial growth decrease illustrations Purple-blue Financial growth decrease icon isolated on grey background. Increasing revenue. Minimalism concept. 3D
Free with trial White Financial growth decrease icon isolated with long shadow background. Increasing revenue. Circle button. Vector. Diagram financial growth decrease vectors White Financial growth decrease icon isolated with long shadow background. Increasing revenue. Circle button. Vector
Free with trial Stock market. The rise and fall of securities. Successful trading. Market trend up green and red down arrows, financial graphs. Business investment growth and loss arrow. Graph going up and down symbol vector illustration. Diagram financial growth decrease vectors Stock market. The rise and fall of securities. Successful trading. Market trend up green and red down arrows, financial graphs.
Free with trial Line Financial growth decrease icon isolated on white background. Increasing revenue. Colorful outline concept. Vector. Diagram financial growth decrease illustrations Line Financial growth decrease icon isolated on white background. Increasing revenue. Colorful outline concept. Vector
Free with trial Isometric line Financial growth decrease icon isolated on pink and blue background. Increasing revenue. Square button. Vector. Diagram financial growth decrease vectors Isometric line Financial growth decrease icon isolated on pink and blue background. Increasing revenue. Square button
Free with trial Line Financial growth decrease icon isolated on black background. Increasing revenue. Colorful outline concept. Vector. Diagram financial growth decrease illustrations Line Financial growth decrease icon isolated on black background. Increasing revenue. Colorful outline concept. Vector
Free with trial Stock market. The rise and fall of securities. Successful trading. Market trend up green and red down arrows, financial graphs. Business investment growth and loss arrow. Graph going up and down symbol vector illustration. Diagram financial growth decrease vectors Stock market. The rise and fall of securities. Successful trading. Market trend up green and red down arrows, financial graphs.
Free with trial Frosted glass Financial growth decrease icon isolated on white background. Increasing revenue. Minimalism concept. 3D render illustration. Diagram financial growth decrease illustrations Frosted glass Financial growth decrease icon isolated on white background. Increasing revenue. Minimalism concept. 3D
Free with trial Financial growth chart with trend line graph. Growth bar chart of economy. Financial decline. Economic crisis, decrease graph. Profit down. Vector illustration isolated on white background. Diagram financial growth decrease vectors Financial growth chart with trend line graph. Growth bar chart of economy. Financial decline. Economic crisis, decrease graph.
Free with trial Green Financial growth decrease icon isolated on purple-blue background. Increasing revenue. Minimalism concept. 3D render illustration. Diagram financial growth decrease illustrations Green Financial growth decrease icon isolated on purple-blue background. Increasing revenue. Minimalism concept. 3D
Free with trial Set Browser with stocks market Financial growth Pie chart infographic Binary code Cloud computing lock Search data analysis and Data icon. Vector. Diagram financial growth decrease vectors Set Browser with stocks market, Financial growth, Pie chart infographic, Binary code, Cloud computing lock, Search data. Set Browser with stocks market Financial growth Pie chart infographic Binary code Cloud computing lock Search data analysis and Data icon. Vector.
Free with trial Set line Financial growth decrease, Cloud and shield and Search data analysis icon. Vector. Diagram financial growth decrease illustrations Set line Financial growth decrease, Cloud and shield and Search data analysis icon. Vector
Free with trial Statistic graph progress, financial profit growth, increase, and decrease line icons set. Infographic charts with arrows, circles, and bars thin black outline symbols vector illustration. Diagram financial growth decrease vectors Statistic graph progress, financial profit growth, increase and decrease line icons set. Statistic graph progress, financial profit growth, increase, and decrease line icons set. Infographic charts with arrows, circles, and bars thin black outline symbols vector illustration.