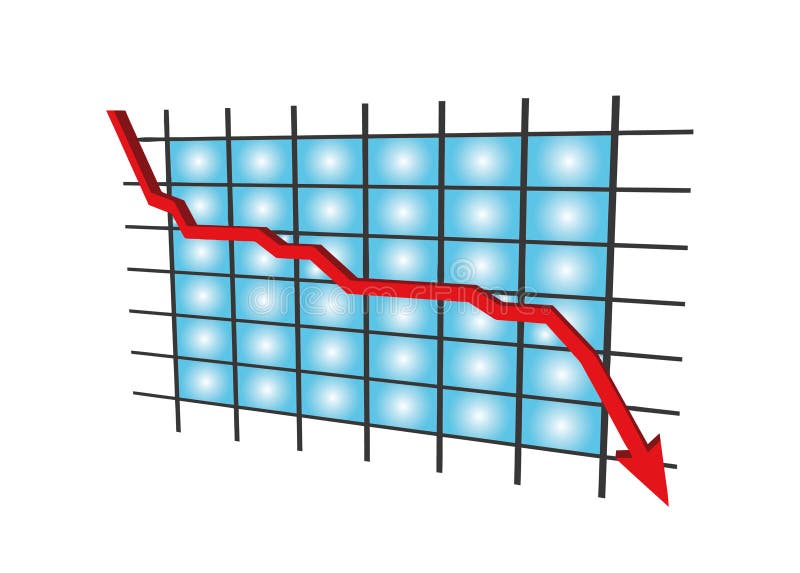
Free with trial Financial market graph chart going down trend Red arrow down with fire explosion from investment in crisis situation, generated AI. Diagram financial growth decrease illustrations Financial market graph chart going down trend Red arrow down with fire explosion from investment in crisis situation, generated AI
Free with trial Financial market graph chart going down trend Red arrow down with fire explosion from investment in crisis situation, generated AI. Diagram financial growth decrease illustrations Financial market graph chart going down trend Red arrow down with fire explosion from investment in crisis situation, generated AI
Free with trial Financial market graph chart going down trend Red arrow down with fire explosion from investment in crisis situation, generated AI. Diagram financial growth decrease illustrations Financial market graph chart going down trend Red arrow down with fire explosion from investment in crisis situation, generated AI
Free with trial Financial market graph chart going down trend Red arrow down with fire explosion from investment in crisis situation, generated AI. Diagram financial growth decrease illustrations Financial market graph chart going down trend Red arrow down with fire explosion from investment in crisis situation, generated AI
Free with trial Financial market graph chart going down trend Red arrow down with fire explosion from investment in crisis situation, generated AI. Diagram financial growth decrease illustrations Financial market graph chart going down trend Red arrow down with fire explosion from investment in crisis situation, generated AI
Free with trial Financial market graph chart going down trend Red arrow down with fire explosion from investment in crisis situation, generated AI. Diagram financial growth decrease illustrations Financial market graph chart going down trend Red arrow down with fire explosion from investment in crisis situation, generated AI
Free with trial Financial market graph chart going down trend Red arrow down with fire explosion from investment in crisis situation, generated AI. Diagram financial growth decrease illustrations Financial market graph chart going down trend Red arrow down with fire explosion from investment in crisis situation, generated AI
Free with trial Businessman hand making a decrease chart. Concept of economic downturn. Global financial crisis. Diagram financial growth decrease illustrations Businessman hand making a decrease chart. Concept of economic downturn. Global financial crisis
Free with trial Businessman hand making a decrease chart. Concept of economic downturn. Global financial crisis. Diagram financial growth decrease illustrations Businessman hand making a decrease chart. Concept of economic downturn. Global financial crisis
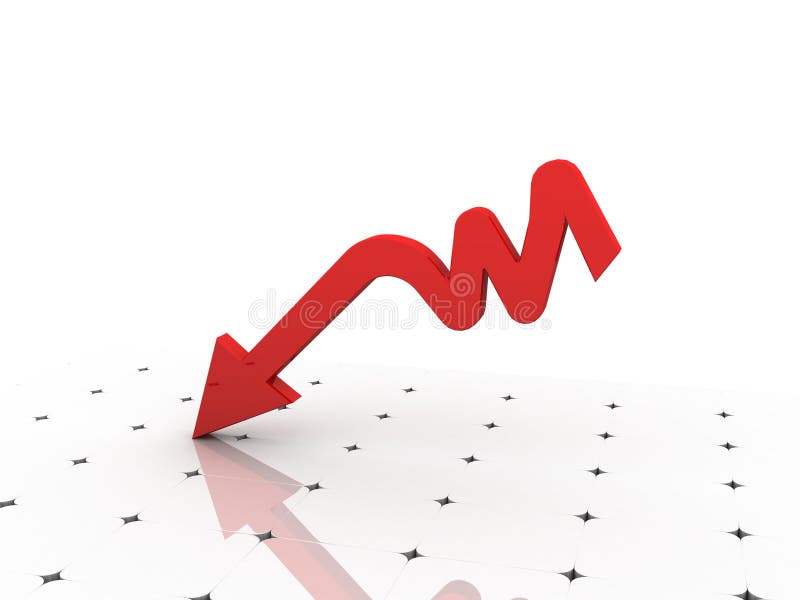
Free with trial Plan business negative growth in year 2021 concept. Businessman plan and increase of negative indicators in his business, decline down business concepts. Diagram financial growth decrease illustrations Plan business negative growth in year 2021 concept. Businessman plan and increase of negative indicators in his business, decline
Free with trial Plan business negative growth in year 2021 concept. Businessman plan and increase of negative indicators in his business, decline down business concepts. Diagram financial growth decrease illustrations Plan business negative growth in year 2021 concept. Businessman plan and increase of negative indicators in his business, decline
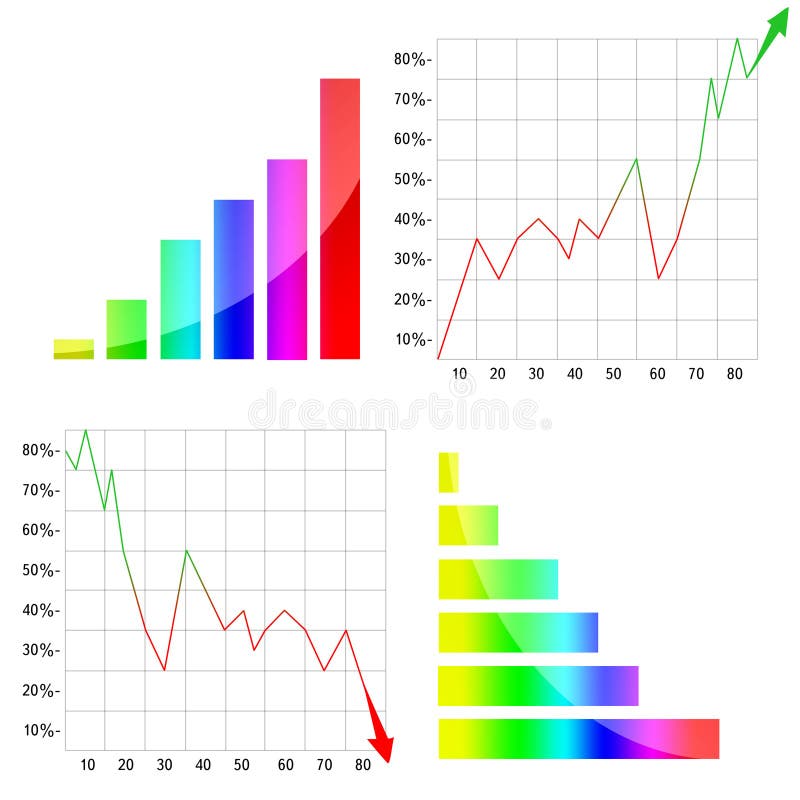
Free with trial Statistics - 3d isolated multicolor diagram. Diagram financial growth decrease illustrations 3d statistics. Statistics - 3d isolated multicolor diagram
Free with trial Statistics - 3d isolated multicolor diagram. Diagram financial growth decrease illustrations 3d statistics. Statistics - 3d isolated multicolor diagram
Free with trial Statistics - 3d isolated multicolor diagram. Diagram financial growth decrease illustrations 3d statistics. Statistics - 3d isolated multicolor diagram
Free with trial Uptrend candle sticks, arrow and stacking coins on white background. Uptrend stock and crypto currency investment situation concept. Stock trading, finances and market growth concept. Diagram financial growth decrease vectors Uptrend candle sticks, arrow and stacking coins on white background. Uptrend stock and crypto currency investment
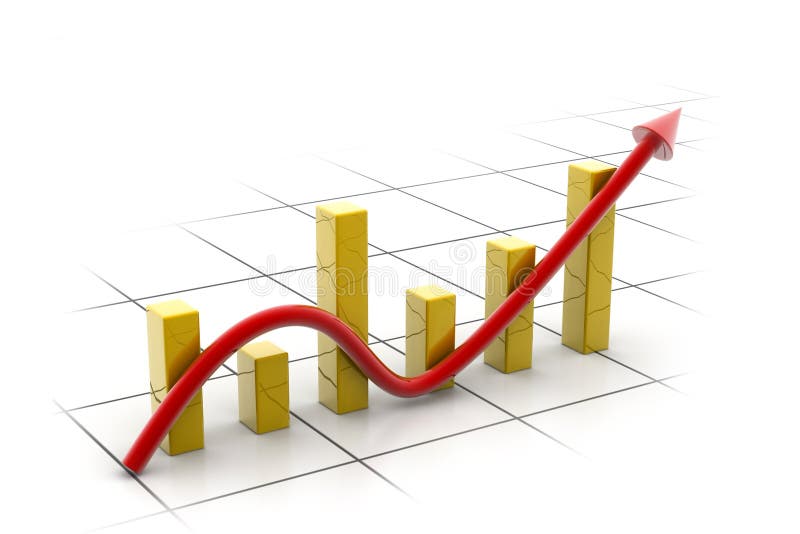
Free with trial Digital illustration of business graph with arrow showing growth and profit. Diagram financial growth decrease illustrations Business graph
Free with trial Statistics - 3d isolated multicolor diagram. Diagram financial growth decrease illustrations 3d statistics. Statistics - 3d isolated multicolor diagram
Free with trial Statistics - 3d isolated multicolor diagram. Diagram financial growth decrease illustrations 3d statistics. Statistics - 3d isolated multicolor diagram
Free with trial Statistics - 3d isolated multicolor diagram. Diagram financial growth decrease illustrations 3d statistics. Statistics - 3d isolated multicolor diagram
Free with trial Colorful graph / diagram with arrow. Diagram financial growth decrease illustrations Colorful graph
Free with trial 2026. Decrease chart. Red color. 3d illustration. Diagram financial growth decrease illustrations 2026. Decrease chart. Red color.
Free with trial Statistics - 3d isolated multicolor diagram. Diagram financial growth decrease illustrations 3d statistics. Statistics - 3d isolated multicolor diagram
Free with trial Digital illustration of business graph with arrow showing growth and profit. Diagram financial growth decrease illustrations Business graph
Free with trial 3d statistics - isolated diagram on white (with vector EPS format). Diagram financial growth decrease vectors 3d statistics
Free with trial Statistics - 3d isolated multicolor diagram. Diagram financial growth decrease illustrations Statistics - 3d isolated on white. Statistics - 3d isolated multicolor diagram
Free with trial Statistics - 3d isolated multicolor diagram. Diagram financial growth decrease illustrations Statistics - 3d isolated on black. Statistics - 3d isolated multicolor diagram
Free with trial Statistics - 3d isolated diagram on white. Diagram financial growth decrease illustrations Statistics
Free with trial Digital illustration of business graph with arrow showing growth and profit. Diagram financial growth decrease illustrations Business graph
Free with trial Statistics - 3d isolated multicolor diagram. Diagram financial growth decrease illustrations 3d statistics. Statistics - 3d isolated multicolor diagram
Free with trial Statistics - 3d isolated multicolor diagram. Diagram financial growth decrease illustrations 3d statistics. Statistics - 3d isolated multicolor diagram
Free with trial Graph showing decrease in profits or earnings in 3D on white background. Diagram financial growth decrease illustrations Graph showing decrease in profits or earnings
Free with trial Chart of development and decrease of the activity in work of the company or market (red and green schedules). Diagram financial growth decrease illustrations Green schedule of growth and red - falling. Chart of development and decrease of the activity in work of the company or market (red and green schedules)
Free with trial Statistics - 3d isolated multicolor diagram. Diagram financial growth decrease illustrations Statistics - 3d isolated on white. Statistics - 3d isolated multicolor diagram
Free with trial Statistics - 3d isolated multicolor diagram. Diagram financial growth decrease illustrations 3d statistics. Statistics - 3d isolated multicolor diagram
Free with trial Statistics - 3d isolated multicolor diagram. Diagram financial growth decrease illustrations 3d statistics. Statistics - 3d isolated multicolor diagram
Free with trial Statistics - 3d multicolor diagram - illustration. Diagram financial growth decrease illustrations 3d statistics. Statistics - 3d multicolor diagram - illustration
Free with trial Digital illustration of business graph with arrow showing growth and profit. Diagram financial growth decrease illustrations Business graph
Free with trial Statistics - 3d isolated multicolor diagram. Diagram financial growth decrease illustrations 3d statistics. Statistics - 3d isolated multicolor diagram
Free with trial Business graph showing falling trend with arrow for recession and financial loss. Diagram financial growth decrease vectors Business crisis chart with falling arrow. Business graph showing falling trend with arrow for recession and financial loss
Free with trial Crisis in the money market/business market - isolated diagram (with vector EPS format). Diagram financial growth decrease vectors Crisis in the money market/business market
Free with trial A minimalist solid black icon of a bar chart with a downward arrow, representing financial loss, decline, decrease, or negative trend. Perfect for business, finance, analytics, and reporting projects. Clean and versatile for web, print, and digital use. Diagram financial growth decrease vectors . A minimalist solid black icon of a bar chart with a downward arrow, representing financial loss, decline, decrease, or negative trend. Perfect for business, finance, analytics, and reporting projects. Clean and versatile for web, print, and digital use
Free with trial Collapse stock market is seen by man invested money, standing near collapsing financial chart. Crisis in stock market and sharp stop in growth or beginning of decline in prices for stocks and bonds. Diagram financial growth decrease vectors Collapse of stock market is seen by man invested money, standing near collapsing financial chart. Collapse stock market is seen by man invested money, standing near collapsing financial chart. Crisis in stock market and sharp stop in growth or beginning of decline in prices for stocks and bonds
Free with trial Line graph with a downward slope representing a decrease or drop in value. Diagram financial growth decrease vectors Arrow line falling diagram. Line graph with a downward slope representing a decrease or drop in value.
Free with trial Crisis in the money market/business market - isolated diagram (with vector EPS format). Diagram financial growth decrease vectors Crisis in the money market/business market
Free with trial Infographic template with 5 arrows pointing down. Can be used for diagram, graph, chart, report, web design. Vector illustration. Diagram financial growth decrease vectors Infographic template with 5 arrows pointing down
Free with trial Infographic template with 4 arrows pointing down. Can be used for diagram, graph, chart, report, web design. Vector illustration. Diagram financial growth decrease vectors Infographic template with 4 arrows pointing down
Free with trial Background business, abstract image of a computer screen of abstract stock market data. Diagram financial growth decrease illustrations Financial Business Abstract Background. Background business, abstract image of a computer screen of abstract stock market data
Free with trial Growth chart faced a crisis, 3D concept on white. Diagram financial growth decrease illustrations Crisis chart. Growth chart faced a crisis, 3D concept on white
Free with trial A 3D illustration of a financial bar chart showing a drastic decline with a red arrow, symbolizing a stock market crash, recession, and economic loss. Diagram financial growth decrease illustrations Market Crash 3D Bar Chart with Downward Arrow. A 3D illustration of a financial bar chart showing a drastic decline with a red arrow, symbolizing a stock market crash, recession, and economic loss
Free with trial Vibrant vector illustration featuring business data charts and graphs, including bar graphs, line graphs, pie charts, and a roller coaster metaphor for market trends. This eye-catching design is perfect for presentations, infographics, and financial reports. Diagram financial growth decrease illustrations Business Data Charts Graphs Vector Illustration, Statistics. Vibrant vector illustration featuring business data charts and graphs, including bar graphs, line graphs, pie charts, and a roller coaster metaphor for market trends. This eye-catching design is perfect for presentations, infographics, and financial reports.
Free with trial Business audit round composition with financial elements and icons in hand drawn style isolated vector illustration. Diagram financial growth decrease vectors Business Audit Round Composition
Free with trial 3D Illustration decrease wood brick chart round. Diagram financial growth decrease illustrations Increase wood brick chart round 2. 3D Illustration decrease wood brick chart round
Free with trial Wavy green arrows visualizing market movement, trend fluctuation, and economic volatility, depicting both growth and decline, ideal for financial data and business analytics concepts. Diagram financial growth decrease illustrations Wavy arrows showing up and down fluctuation trend. Wavy green arrows visualizing market movement, trend fluctuation, and economic volatility, depicting both growth and decline, ideal for financial data and business analytics concepts
Free with trial Trend Down : Trend down indicates a decrease in financial performance, market value, or economic indicators over time. Diagram financial growth decrease vectors Trend Down
Free with trial Circular percentage icon indicating a decrease or reduction, useful for financial concepts like interest rate changes, sales, discounts, and data analysis in business and economics. Diagram financial growth decrease vectors Decreasing percentage rate circular icon illustration. Circular percentage icon indicating a decrease or reduction, useful for financial concepts like interest. Circular percentage icon indicating a decrease or reduction, useful for financial concepts like interest rate changes, sales, discounts, and data analysis in business and economics
Free with trial Illustration depicting financial growth 1. Diagram financial growth decrease vectors Business chart 2. Illustration depicting financial growth 1
Free with trial Businesses compete for growth indicators. Pop art retro vector illustration kitsch vintage 50s 60s style. Diagram financial growth decrease vectors Businesses compete for growth indicators
Free with trial Red arrow decline arrow isolated in white background. Diagram financial growth decrease illustrations Finance Decrease Bar and Arrow. 3D Render illustration. Red arrow decline arrow isolated in white background
Free with trial 3D graph going up and down with red arrows, blue bar chart icon vector, sales chart with 3D arrow down and arrow up, financial analytics symbol, EPS 10. Diagram financial growth decrease vectors 3D graph going up and down with red arrows, blue bar chart icon vector, sales chart symbol. 3D graph going up and down with red arrows, blue bar chart icon vector, sales chart with 3D arrow down and arrow up, financial analytics symbol, EPS 10
Free with trial A simplified flat style icon displays a declining bar graph with arrow. Focuses on business and financial themes. Diagram financial growth decrease vectors Flat icon illustration showing bar chart trending downwards. A simplified flat style icon displays a declining bar graph with arrow. Focuses on business and financial themes.
Free with trial Person typing on a keyboard while studying stock market charts displayed on a monitor in a dimly lit room Perfect for financial and investment visuals. Diagram financial growth decrease illustrations Analyzing Stock Market Charts on Computer Screen. Person typing on a keyboard while studying stock market charts displayed on a monitor in a dimly lit room Perfect for financial and investment visuals
Free with trial Flat style illustration showcasing business financial data analysis via a magnifying glass and graph chart visualization, isolated on black. Diagram financial growth decrease vectors Analyzing Financial Data with Magnifying Glass and Graph Chart. Flat style illustration showcasing business financial data analysis via a magnifying glass and graph chart visualization, isolated on black.
Free with trial Blue arrow decline arrow isolated in white background. Diagram financial growth decrease illustrations Finance Decrease Bar and Arrow. 3D Render illustration. Blue arrow decline arrow isolated in white background
Free with trial Return of investment icon set. Dollar symbols with arrow. Cost of dollar with arrow down and up. Coin of dollar with loss or growth. Increase and low of revenue. Diagram financial growth decrease vectors Return of investment icon set. Dollar symbols with arrow. Cost of dollar with arrow down and up.
Free with trial A series of glowing blue arrows curve upwards against a dark background, symbolizing growth and success. The arrows decrease in size from left to right, creating a sense of movement and progress. The largest arrow is at the top, indicating a peak or goal. The blue gradient enhances the sense of dynamism and forward momentum, typical in business and financial contexts. Diagram financial growth decrease illustrations Abstract Upward Trend Arrow Symbolizing Growth and Success. A series of glowing blue arrows curve upwards against a dark background, symbolizing growth and success. The arrows decrease in size from left to right, creating a sense of movement and progress. The largest arrow is at the top, indicating a peak or goal. The blue gradient enhances the sense of dynamism and forward momentum, typical in business and financial contexts.
Free with trial Minimalist outline drawing of a bar chart representing data analysis and statistical information. Great for presentations and data representations. Diagram financial growth decrease vectors Simple Outline Bar Chart Sign Statistical Data Analysis Diagram Icon. Minimalist outline drawing of a bar chart representing data analysis and statistical information. Great for presentations and data representations.
Free with trial Isometric business analyst professional composition with conceptual financial analysis icons and people vector illustration. Diagram financial growth decrease vectors Crypto Analysis Growth Composition. Isometric business analyst professional composition with conceptual financial analysis icons and people vector illustration
Free with trial Six simple line graphs showcase various data trends, including upward, downward, and fluctuating patterns. Each graph features key data points marked with letters. Diagram financial growth decrease illustrations Six Line Graph Charts Data Visualization, Trends, Growth, Analysis. Six simple line graphs showcase various data trends, including upward, downward, and fluctuating patterns. Each graph features key data points marked with letters
Free with trial Logo design graphic concept creative premium vector stock image top sell. Diagram financial growth decrease vectors Dollar money arrow up down chart diagram inflation rate risk market business. Logo design graphic concept creative premium vector stock image top sell
Free with trial Isometric business analyst professional composition with conceptual financial analysis icons and people vector illustration. Diagram financial growth decrease vectors Financial Analyst Computer Composition. Isometric business analyst professional composition with conceptual financial analysis icons and people vector illustration
Free with trial Isometric business analyst professional composition with conceptual financial analysis icons and people vector illustration. Diagram financial growth decrease vectors Business Growth Coworkers Composition. Isometric business analyst professional composition with conceptual financial analysis icons and people vector illustration
Free with trial Economic crisis and money loss icons, downturn and bankruptcy symbols, line vector. World financial crisis and global economy recession icons of business bankruptcy, finance downturn and unemployment. Diagram financial growth decrease vectors Economic crisis and money loss icons of downturn. Economic crisis and money loss icons, downturn and bankruptcy symbols, line vector. World financial crisis and global economy recession icons of business bankruptcy, finance downturn and unemployment
Free with trial Infographic template with 3 arrows pointing down. Can be used for diagram, graph, chart, report, web design. Vector illustration. Diagram financial growth decrease vectors Infographic template with 3 arrows pointing down
Free with trial Isometric business analyst professional composition with conceptual financial analysis icons and people vector illustration. Diagram financial growth decrease vectors Financial Computing Analysts Composition. Isometric business analyst professional composition with conceptual financial analysis icons and people vector illustration
Free with trial A 3D rendered image depicting a financial graph with a prominent red arrow indicating a downward trend. The graph features a bar chart with several red bars, showing a decline in value. The background is a dark grid, emphasizing the data visualization. This image is ideal for representing financial losses, economic downturns, market crashes, or negative performance in business and investment contexts. Diagram financial growth decrease illustrations Red Arrow Downward Trend Graph with Bar Chart. A 3D rendered image depicting a financial graph with a prominent red arrow indicating a downward trend. The graph features a bar chart with several red bars, showing a decline in value. The background is a dark grid, emphasizing the data visualization. This image is ideal for representing financial losses, economic downturns, market crashes, or negative performance in business and investment contexts.
Free with trial Circular chart icon presenting a bar graph visualizing statistical data, analytics, and business reports, symbolizing financial decline, data analysis, and market trends. Diagram financial growth decrease vectors Circular chart icon showing declining bar graph. Circular chart icon presenting a bar graph visualizing statistical data, analytics, and business reports, symbolizing financial decline, data analysis, and market trends
Free with trial A minimalist vector icon illustrating market volatility and financial trends. The graphic features two distinct line graphs on a coordinate system: a jagged, highly fluctuating upper line representing high volatility, and a smoother lower line with marked points indicating a general trend. Up-down arrows and separate up down indicators further emphasize market movement and unpredictable changes. Ideal for financial reports, business presentations, data visualization, and economic analysis. Diagram financial growth decrease vectors Market Volatility and Financial Trend Graph Icon. A minimalist vector icon illustrating market volatility and financial trends. The graphic features two distinct line graphs on a coordinate system: a jagged, highly fluctuating upper line representing high volatility, and a smoother lower line with marked points indicating a general trend. Up-down arrows and separate up down indicators further emphasize market movement and unpredictable changes. Ideal for financial reports, business presentations, data visualization, and economic analysis.
Free with trial A stack of gold coins and bars sit on top of a chart with a downward trend. The chart shows a decrease in value, while the gold coins and bars remain valuable. Diagram financial growth decrease illustrations A stack of gold coins and bars sit on top of a chart with a downward trend
Free with trial Isometric business analyst professional composition with conceptual financial analysis icons and people vector illustration. Diagram financial growth decrease vectors Business Growth Arrows Composition. Isometric business analyst professional composition with conceptual financial analysis icons and people vector illustration
Free with trial 3D rendering, coronabond coronavirus cells covid-19 influenza with color of europe euro, concept of corona bond crisis for economy finance business europe for pandemic health risk recession on blue financial economy chart background. Diagram financial growth decrease illustrations 3D rendering, coronabond coronavirus cells covid-19 influenza with color of europe euro, concept of corona bond crisis for economy