Free with trial Modern reduction line icon. Premium pictogram isolated on a white background. Vector illustration. Stroke high quality symbol. Decrease icon in modern line style. Diagram financial growth decrease vectors Modern reduction line icon.
Free with trial Modern reduction line icon. Premium pictogram isolated on a white background. Vector illustration. Stroke high quality symbol. Decrease icon in modern line style. Diagram financial growth decrease vectors Modern reduction line icon.
Free with trial Modern reduction line icon. Premium pictogram isolated on a white background. Vector illustration. Stroke high quality symbol. Decrease icon in modern line style. Diagram financial growth decrease vectors Modern reduction line icon.
Free with trial Modern reduction line icon. Premium pictogram isolated on a white background. Vector illustration. Stroke high quality symbol. Decrease icon in modern line style. Diagram financial growth decrease vectors Modern reduction line icon.
Free with trial Modern reduction line icon. Premium pictogram isolated on a white background. Vector illustration. Stroke high quality symbol. Decrease icon in modern line style. Diagram financial growth decrease vectors Modern reduction line icon.
Free with trial Modern reduction line icon. Premium pictogram isolated on a white background. Vector illustration. Stroke high quality symbol. Decrease icon in modern line style. Diagram financial growth decrease vectors Modern reduction line icon.
Free with trial Modern reduction line icon. Premium pictogram isolated on a white background. Vector illustration. Stroke high quality symbol. Decrease icon in modern line style. Diagram financial growth decrease vectors Modern reduction line icon.
Free with trial Bar chart illustration - financial vector. Diagram financial growth decrease vectors Bar chart illustration – vector. Bar chart illustration - financial vector
Free with trial Loyalty award, Calendar graph and Cashback line icons set. Cell phone, megaphone and deal vector icons. Upper arrows sign. Bonus medal, Annual report, Financial transfer. Growth infochart. Vector. Diagram financial growth decrease vectors Loyalty award, Calendar graph and Cashback icons set. Upper arrows sign. Vector. Loyalty award, Calendar graph and Cashback line icons set. Cell phone, megaphone and deal vector icons. Upper arrows sign. Bonus medal, Annual report, Financial transfer. Growth infochart. Vector
Free with trial Decrease icon. Element of arrow and object icon for mobile concept and web apps. Thin line decrease icon can be used for web and mobile on white background. Diagram financial growth decrease illustrations Decrease icon. Element of arrow and object icon for mobile concept and web apps. Thin line decrease icon can be used for web and
Free with trial Gold bars on graph and arrow down, fall, chart gold with increase and decrease, gold profit and loss concept. Diagram financial growth decrease vectors Gold bars on graph and arrow down, fall, chart gold with increase and decrease, gold profit and loss concept
Free with trial Stock market investment trading technical analysis candlestick, bar, line and area chart set on white background. Business candle stick graph exchange trends. Trader financial investment index. Vector. Diagram financial growth decrease vectors Stock market investment trading technical analysis candlestick, bar, line and area chart set on white background
Free with trial Financial crisis concept, impact on global economy and stock markets due to Coronavirus disease. Diagram financial growth decrease vectors Impact on global economy and stock markets due to Coronavirus disease
Free with trial File settings, Statistics and Graph chart icons simple set. Button with halftone dots. Question mark sign. File management, Financial report, Growth report. Quiz chat. Technology set. Vector. Diagram financial growth decrease vectors File settings, Statistics and Graph chart icons set. Question mark sign. Vector. File settings, Statistics and Graph chart icons simple set. Button with halftone dots. Question mark sign. File management, Financial report, Growth report. Quiz chat. Technology set. Vector
Free with trial Decrease icon or logo line art style. Vector Illustration. Diagram financial growth decrease vectors Icon or Logo in modern line style. Decrease icon or logo line art style. Vector Illustration.
Free with trial A vibrant 3D bar chart icon isolated on a clean white background. This minimalist data visualization features five colorful bars in a soft, pastel palette of yellow, pink, and purple, arranged in descending order. The clean, modern render is perfect for illustrating concepts like business statistics, financial reports, market analysis, and performance metrics. An ideal graphic element for presentations, infographics, websites, and educational materials, symbolizing data, comparison, and analytics in a visually appealing way. 3D illustration. Diagram financial growth decrease illustrations 3D Colorful Bar Chart for Business and Data Analysis. A vibrant 3D bar chart icon isolated on a clean white background. This minimalist data visualization. A vibrant 3D bar chart icon isolated on a clean white background. This minimalist data visualization features five colorful bars in a soft, pastel palette of yellow, pink, and purple, arranged in descending order. The clean, modern render is perfect for illustrating concepts like business statistics, financial reports, market analysis, and performance metrics. An ideal graphic element for presentations, infographics, websites, and educational materials, symbolizing data, comparison, and analytics in a visually appealing way. 3D illustration.
Free with trial An image of coloured columns of statistical diagram on a blue background. Diagram financial growth decrease vectors Colored Chart. An image of coloured columns of statistical diagram on a blue background
Free with trial A black and white line illustration features a speech bubble with a downward arrow and a dollar sign, indicating a decrease in value. Below, a stylized gold bar is depicted, flanked by two sparkles. The minimalistic design suggests an economic theme, likely related to changes in gold prices. Diagram financial growth decrease vectors Gold Price Down. A black and white line illustration features a speech bubble with a downward arrow and a dollar sign, indicating a decrease in value. Below, a stylized gold bar is depicted, flanked by two sparkles. The minimalistic design suggests an economic theme, likely related to changes in gold prices.
Free with trial Black and white illustration featuring two elements. The top section displays a speech bubble with a downward arrow and a Bitcoin symbol, suggesting a decrease. Below, a square frame contains a simplistic image of a landscape with a sun and a mountain, often used to represent digital images or NFTs. The design uses bold lines and minimalistic style to convey the concept of digital currency and media. Diagram financial growth decrease vectors NFT Prices Down. Black and white illustration featuring two elements. The top section displays a speech bubble with a downward arrow and a Bitcoin symbol, suggesting a decrease. Below, a square frame contains a simplistic image of a landscape with a sun and a mountain, often used to represent digital images or NFTs. The design uses bold lines and minimalistic style to convey the concept of digital currency and media.
Free with trial A graphic icon shows a stylized gold bar with two sparkle symbols on either side, suggesting value or shine. Above, a speech bubble contains a downward-facing arrow and a dollar sign, indicating a decrease or decline in value or price. The design uses a simple black and white color scheme, conveying information clearly and directly. Diagram financial growth decrease vectors Gold Price Down. A graphic icon shows a stylized gold bar with two sparkle symbols on either side, suggesting value or shine. Above, a speech bubble contains a downward-facing arrow and a dollar sign, indicating a decrease or decline in value or price. The design uses a simple black and white color scheme, conveying information clearly and directly.
Free with trial Speech bubble with a downward arrow and Bitcoin symbol indicates decreased value. Below, a simple landscape icon represents digital art or NFTs. Both elements are in black and white, highlighting financial and digital market themes. Diagram financial growth decrease vectors NFT Prices Down. Speech bubble with a downward arrow and Bitcoin symbol indicates decreased value. Below, a simple landscape icon represents digital art or NFTs. Both elements are in black and white, highlighting financial and digital market themes.
Free with trial Group sign. Diploma certificate, save planet chat bubbles. Bitcoin pay, Time management and Graph chart line icons set. Mobile payment, User with clock, Growth report. Group of users. Vector. Diagram financial growth decrease vectors Bitcoin pay, Time management and Graph chart icons set. Group sign. Vector. Group sign. Diploma certificate, save planet chat bubbles. Bitcoin pay, Time management and Graph chart line icons set. Mobile payment, User with clock, Growth report. Group of users. Vector
Free with trial Financial crisis concept, impact on global economy and stock markets due to Coronavirus disease. Diagram financial growth decrease vectors Impact on global economy and stock markets due to Coronavirus disease
Free with trial Red 3d arrow going down stock icon on white background. Bankruptcy, financial market crash icon for your web site design. chart going down sign. 3d rendering. Vector illustration. Diagram financial growth decrease vectors 3d arrow going down stock icon
Free with trial A close-up of a stock market chart showing a sharp downturn. The orange line graph against a dark background with gridlines illustrates the volatility and potential risks in financial markets. The image captures the urgency and anxiety associated with market fluctuations. The "MA 1000" text is visib. Diagram financial growth decrease illustrations Stock Market Downturn. A close-up of a stock market chart showing a sharp downturn. The orange line graph against a dark background with gridlines illustrates the volatility and potential risks in financial markets. The image captures the urgency and anxiety associated with market fluctuations. The "MA 1000" text is visib
Free with trial This image features two variations of a graph icon showing a downward trend. One is a simple outline, while the other is a solid black silhouette. Both depict a graph with a sharp decline, represented by a line with a downward-pointing arrow. The icons are suitable for illustrating concepts like financial loss, economic downturn, negative growth, or any situation involving a decrease in value or performance. Diagram financial growth decrease illustrations Declining Graph Icon Set. This image features two variations of a graph icon showing a downward trend. One is a simple outline, while the other is a solid black silhouette. Both depict a graph with a sharp decline, represented by a line with a downward-pointing arrow. The icons are suitable for illustrating concepts like financial loss, economic downturn, negative growth, or any situation involving a decrease in value or performance.
Free with trial A simple, flat design icon depicting a downward trend. The image features a red graph line descending from the top left to the bottom right, with an arrow indicating the direction. The graph is set against a clean white background, emphasizing the visual impact of the trend. This graphic is suitable for illustrating concepts such as financial decline, decreasing sales, or negative performance in business, economics, or data analysis. Diagram financial growth decrease vectors Downward Trend Graph Icon. A simple, flat design icon depicting a downward trend. The image features a red graph line descending from the top left to the bottom right, with an arrow indicating the direction. The graph is set against a clean white background, emphasizing the visual impact of the trend. This graphic is suitable for illustrating concepts such as financial decline, decreasing sales, or negative performance in business, economics, or data analysis.
Free with trial A red J is on a table with a graph behind it. The graph shows a downward trend, which could represent a decrease in value or a negative outcome. The red J could symbolize a warning or a call to action. Diagram financial growth decrease illustrations A red J is on a table with a graph behind it
Free with trial Candlestick Chart vector Professional Financial Trading concept icon or symbol. Diagram financial growth decrease vectors Candlestick Chart vector Professional Financial Trading icon or symbol
Free with trial Chart with red arrow down and arrow green up isolated on white background. Fall and growth in business. Diagram financial growth decrease vectors Chart with red arrow down and arrow green up isolated on white background
Free with trial Decreasing graph, Payment card and Graph chart signs. Chat bubbles with quotes. Coins, Growth chart and Report document line icons set. Loan percent, Bitcoin coin symbols. Vector. Diagram financial growth decrease vectors Coins, Growth chart and Report document icons set. Decreasing graph, Payment card and Graph chart signs. Vector. Decreasing graph, Payment card and Graph chart signs. Chat bubbles with quotes. Coins, Growth chart and Report document line icons set. Loan percent, Bitcoin coin symbols. Vector
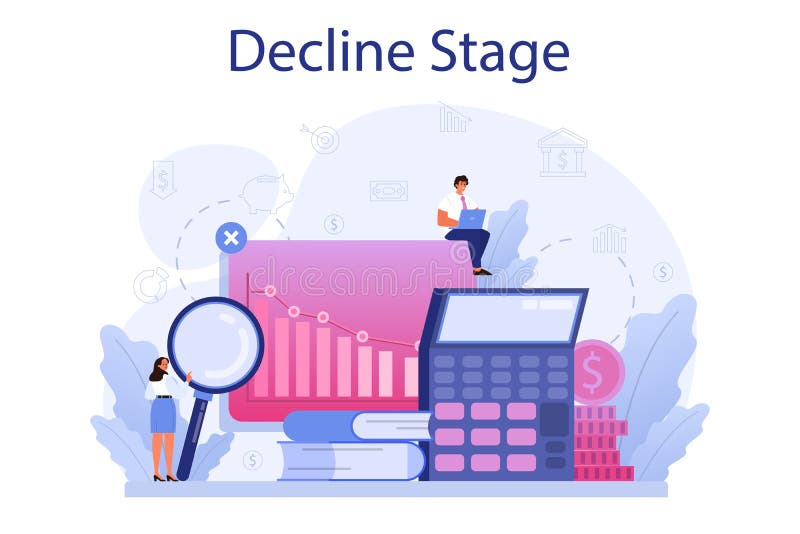
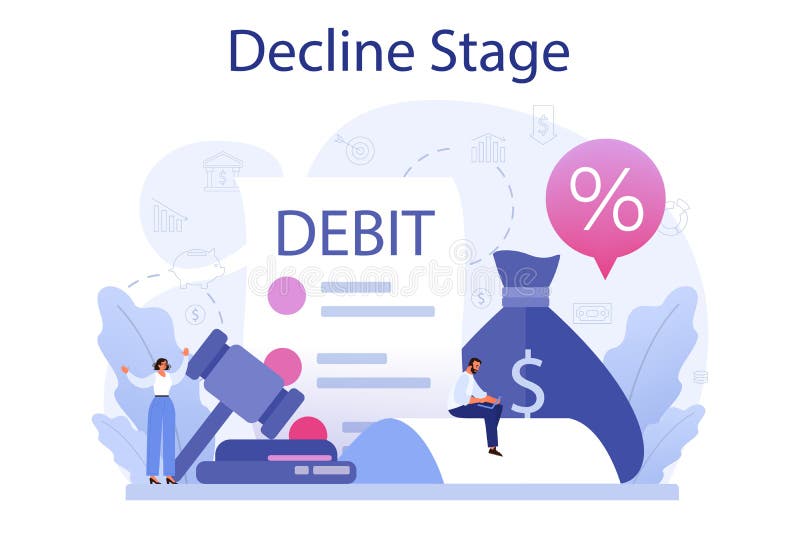
Free with trial Decline stage concept. Finance crisis with falling down graph and income decrease. Idea of bancruptcy and business risk. Money loss. Isolated flat vector illustration. Diagram financial growth decrease illustrations Decline stage concept. Finance crisis with falling down graph
Free with trial A visual representation of data, showcasing trends and comparisons through a green bar chart. This graphic illustrates statistical information and growth patterns effectively. Diagram financial growth decrease illustrations Bar chart data analysis on. A visual representation of data, showcasing trends and comparisons through a green bar chart. This graphic illustrates statistical information and growth patterns effectively
Free with trial Bitcoin, Income money and Presentation board icons simple set. Button with halftone dots. Stock analysis sign. Cryptocurrency coin, Savings, Growth chart. Business trade. Finance set. Vector. Diagram financial growth decrease vectors Bitcoin, Income money and Presentation board icons set. Stock analysis sign. Vector. Bitcoin, Income money and Presentation board icons simple set. Button with halftone dots. Stock analysis sign. Cryptocurrency coin, Savings, Growth chart. Business trade. Finance set. Vector
Free with trial Bitcoin, Income money and Presentation board icons simple set. Timeline infographic. Stock analysis sign. Cryptocurrency coin, Savings, Growth chart. Business trade. Finance set. Vector. Diagram financial growth decrease vectors Bitcoin, Income money and Presentation board icons set. Stock analysis sign. Vector. Bitcoin, Income money and Presentation board icons simple set. Timeline infographic. Stock analysis sign. Cryptocurrency coin, Savings, Growth chart. Business trade. Finance set. Vector
Free with trial Chart with red down arrow on abstract background. Falling growth in business. Diagram financial growth decrease illustrations Chart with red down arrow on abstract background. Falling growth in business
Free with trial Image of a stock market chart with a red and blue candlestick pattern, plotted on a dark grid, suggesting financial trends and investment analysis. Image is generated using AI. Diagram financial growth decrease illustrations Stock Market Chart on a Grid. Image of a stock market chart with a red and blue candlestick pattern, plotted on a dark grid, suggesting financial trends and investment analysis. Image is generated using AI
Free with trial A simple line graph illustration showing fluctuations and an upward trend. The graph is drawn on a grid with a black line and red data points, indicating a period of increase, followed by a decrease, and then a final increase. This image can be used to represent business trends, financial analysis, stock market data, or any data that shows changes over time. Diagram financial growth decrease vectors Line Graph with Fluctuations. A simple line graph illustration showing fluctuations and an upward trend. The graph is drawn on a grid with a black line and red data points, indicating a period of increase, followed by a decrease, and then a final increase. This image can be used to represent business trends, financial analysis, stock market data, or any data that shows changes over time.
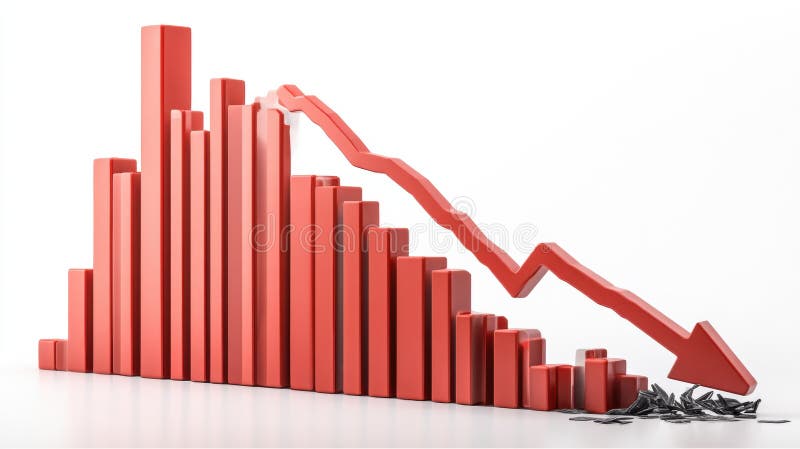
Free with trial A 3D rendering of a bar graph depicting a sharp decline in values. The red bars decrease in size, culminating in a large downward red arrow, symbolizing a significant economic downturn or market crash. The broken pieces at the bottom represent the loss or damage incurred. Diagram financial growth decrease illustrations Red Bar Graph Showing Decline. A 3D rendering of a bar graph depicting a sharp decline in values. The red bars decrease in size, culminating in a large downward red arrow, symbolizing a significant economic downturn or market crash. The broken pieces at the bottom represent the loss or damage incurred.
Free with trial A graph with a red line and a green line. This could represent a decrease in one variable and an increase in another. Diagram financial growth decrease illustrations A graph with a red line and a green line
Free with trial Futuristic red signal trend drop down arrow chart digital transformation abstract technology background. Big data and business growth currency stock and investment indicator of set trade economy. Diagram financial growth decrease vectors Futuristic red signal trend drop down arrow chart digital transformation abstract technology background. Big data and business
Free with trial Bitcoin coin, Private payment and Shopping cart icons simple set. Pricing table, price list. Report document sign. Piggy bank, Secure finance, Discount. Growth chart. Finance set. Vector. Diagram financial growth decrease vectors Bitcoin coin, Private payment and Shopping cart icons set. Report document sign. Vector. Bitcoin coin, Private payment and Shopping cart icons simple set. Pricing table, price list. Report document sign. Piggy bank, Secure finance, Discount. Growth chart. Finance set. Vector
Free with trial Bitcoin coin, Private payment and Shopping cart icons simple set. Price table template. Report document sign. Piggy bank, Secure finance, Discount. Growth chart. Finance set. Vector. Diagram financial growth decrease vectors Bitcoin coin, Private payment and Shopping cart icons set. Report document sign. Vector. Bitcoin coin, Private payment and Shopping cart icons simple set. Price table template. Report document sign. Piggy bank, Secure finance, Discount. Growth chart. Finance set. Vector
Free with trial Graph chart, Report document and Contactless payment line icons set. Timeline steps. 360 degrees sign. Growth report, Growth chart, Financial payment. Panoramic view. Technology set. Vector. Diagram financial growth decrease vectors Graph chart, Report document and Contactless payment icons set. 360 degrees sign. Vector. Graph chart, Report document and Contactless payment line icons set. Timeline steps. 360 degrees sign. Growth report, Growth chart, Financial payment. Panoramic view. Technology set. Vector
Free with trial Bitcoin, Euro money and Cash line icons set. Timeline plan infograph. Graph chart sign. Cryptocurrency coin, Receive cash, Atm payment. Growth report. Finance set. Vector. Diagram financial growth decrease vectors Bitcoin, Euro money and Cash icons set. Graph chart sign. Cryptocurrency coin, Receive cash, Atm payment. Vector. Bitcoin, Euro money and Cash line icons set. Timeline plan infograph. Graph chart sign. Cryptocurrency coin, Receive cash, Atm payment. Growth report. Finance set. Vector
Free with trial Wind energy, Bitcoin system and Calculator target line icons set. Infographic timeline. Report document sign. Ventilator, Cryptocurrency monitor, Audit. Growth chart. Finance set. Vector. Diagram financial growth decrease vectors Wind energy, Bitcoin system and Calculator target icons set. Report document sign. Vector. Wind energy, Bitcoin system and Calculator target line icons set. Infographic timeline. Report document sign. Ventilator, Cryptocurrency monitor, Audit. Growth chart. Finance set. Vector
Free with trial Report document sign. Diploma certificate, save planet chat bubbles. Wind energy, Bitcoin system and Calculator target line icons set. Ventilator, Cryptocurrency monitor, Audit. Growth chart. Vector. Diagram financial growth decrease vectors Wind energy, Bitcoin system and Calculator target icons set. Report document sign. Vector. Report document sign. Diploma certificate, save planet chat bubbles. Wind energy, Bitcoin system and Calculator target line icons set. Ventilator, Cryptocurrency monitor, Audit. Growth chart. Vector
Free with trial Increase statistic target vector design, statistical diagram that serves to provide information about a data or so on. Diagram financial growth decrease vectors Increase statistic target vector design
Free with trial This image showcases a downward trending graph, generated by AI, represented by a red arrow descending within a transparent glass structure. The visual effectively communicates decline or negative growth. The clean, minimalist design enhances the impact of the falling trend. Diagram financial growth decrease illustrations Decreasing Trend: AI-Generated Graph. This image showcases a downward trending graph, generated by AI, represented by a red arrow descending within a transparent glass structure. The visual effectively communicates decline or negative growth. The clean, minimalist design enhances the impact of the falling trend.
Free with trial Golden coins stack and up arrow. Flat vector icon isolated on white. Economy, finance, money symbol. Currency pictogram. Vector illustration. Diagram financial growth decrease vectors Golden coin sign dollar vector growth vector. golden coins stack and up arrow. Flat vector icon isolated on white. Economy, finance, money symbol. Currency pictogram. Vector illustration
Free with trial Abstract 3D rendering of a blue bar chart receding into the distance. The bars are arranged in descending order, suggesting a decline or downward trend. The reflective surface adds depth and visual interest, creating a clean and modern aesthetic. This image can be used to illustrate concepts such as financial downturn, market analysis, or statistical data representation. Diagram financial growth decrease illustrations Abstract Blue Bar Chart. Abstract 3D rendering of a blue bar chart receding into the distance. The bars are arranged in descending order, suggesting a decline or downward trend. The reflective surface adds depth and visual interest, creating a clean and modern aesthetic. This image can be used to illustrate concepts such as financial downturn, market analysis, or statistical data representation.
Free with trial Decline stage online service or platform. Finance crisis with falling down graph and income decrease. Idea of bancruptcy. Isolated flat vector illustration. Diagram financial growth decrease illustrations Decline stage online service or platform. Finance crisis
Free with trial Decline stage online service or platform. Finance crisis with falling down graph and income decrease. Idea of bancruptcy. Online support. Isolated flat vector illustration. Diagram financial growth decrease vectors Decline stage online service or platform. Finance crisis
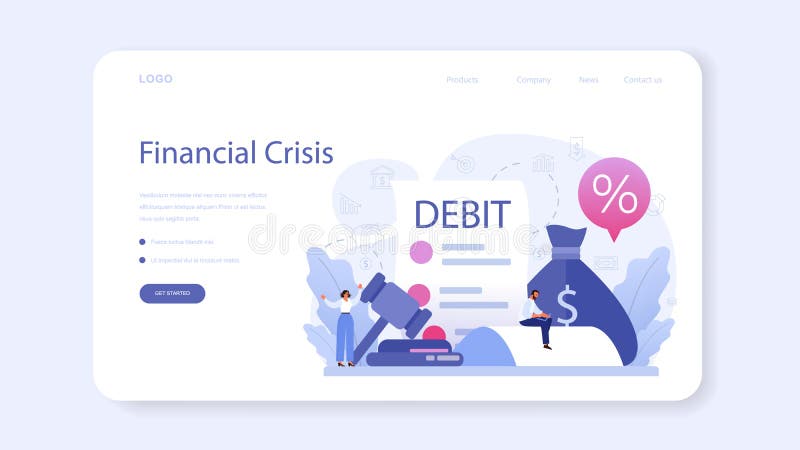
Free with trial Decline stage web banner or landing page. Finance crisis with falling down graph and income decrease. Idea of bancruptcy and business risk. Money loss. Isolated flat vector illustration. Diagram financial growth decrease vectors Decline stage web banner or landing page. Finance crisis
Free with trial Decline stage online service or platform. Finance crisis with falling down graph and income decrease. Idea of bancruptcy. Online consultation. Isolated flat vector illustration. Diagram financial growth decrease vectors Decline stage online service or platform. Finance crisis
Free with trial Flat icons related to financial transactions pertaining to business or personal both. Very well crafted finance icons set to be used in related projects. Grab this pack and enjoy designing. Diagram financial growth decrease vectors Set of Finance Flat Icons. Flat icons related to financial transactions pertaining to business or personal both. Very well crafted finance icons set to be used in related projects. Grab this pack and enjoy designing
Free with trial Decline stage web banner or landing page. Finance crisis with falling down graph and income decrease. Idea of bancruptcy and business risk. Money loss. Isolated flat vector illustration. Diagram financial growth decrease vectors Decline stage web banner or landing page. Finance crisis
Free with trial Decline stage online service or platform. Finance crisis with falling down graph and income decrease. Idea of bancruptcy. Online financing. Isolated flat vector illustration. Diagram financial growth decrease vectors Decline stage online service or platform. Finance crisis
Free with trial A graph with a red arrow pointing upward. The graph is orange and blue. The graph is a representation of a trend or growth. Diagram financial growth decrease vectors A graph with a red arrow pointing upward
Free with trial Decline stage web banner or landing page. Finance crisis with falling down graph and income decrease. Idea of bancruptcy and business risk. Money loss. Isolated flat vector illustration. Diagram financial growth decrease vectors Decline stage web banner or landing page. Finance crisis
Free with trial Graphs indicators of social networks. isometric vector diagram growing in popularity. social copper analytics. Diagram financial growth decrease vectors Graphs indicators of social networks
Free with trial Simple up and down statistic vector design, statistical diagram that serves to provide information about a data or so on. Diagram financial growth decrease vectors Simple up and down statistic vector design
Free with trial Cube statistic with red arrow vector design, statistical diagram that serves to provide information about a data or so on. Diagram financial growth decrease vectors Cube statistic with red arrow vector design
Free with trial Circle statistic illustration vector design, statistical diagram that serves to provide information about a data or so on. Diagram financial growth decrease vectors Circle statistic illustration vector design
Free with trial Overheating of the stock market and falling concept. Financial arrow chart, line graph. Stock market crisis, drawdown or correction. Vector illustration. Diagram financial growth decrease vectors Overheating of the stock market and falling concept.
Free with trial Bitcoin coin, Private payment and Shopping cart icons simple set. Button with halftone dots. Report document sign. Piggy bank, Secure finance, Discount. Growth chart. Finance set. Vector. Diagram financial growth decrease vectors Bitcoin coin, Private payment and Shopping cart icons set. Report document sign. Vector. Bitcoin coin, Private payment and Shopping cart icons simple set. Button with halftone dots. Report document sign. Piggy bank, Secure finance, Discount. Growth chart. Finance set. Vector
Free with trial Business crisis refers to a significant, unexpected event or series of events that poses a threat to the operations, reputation, financial stability, or existence of a company. Diagram financial growth decrease illustrations The man siting on Bomb for Business crisis concept 3d rendering. Business crisis refers to a significant, unexpected event or series of events that poses a threat to the operations, reputation, financial stability, or existence of a company
Free with trial Business crisis refers to a significant, unexpected event or series of events that poses a threat to the operations, reputation, financial stability, or existence of a company. Diagram financial growth decrease illustrations The man siting on Bomb for Business crisis concept 3d rendering. Business crisis refers to a significant, unexpected event or series of events that poses a threat to the operations, reputation, financial stability, or existence of a company
Free with trial Business crisis refers to a significant, unexpected event or series of events that poses a threat to the operations, reputation, financial stability, or existence of a company. Diagram financial growth decrease illustrations The man siting on Bomb for Business crisis concept 3d rendering. Business crisis refers to a significant, unexpected event or series of events that poses a threat to the operations, reputation, financial stability, or existence of a company
Free with trial Business crisis refers to a significant, unexpected event or series of events that poses a threat to the operations, reputation, financial stability, or existence of a company. Diagram financial growth decrease illustrations The man siting on Bomb for Business crisis concept 3d rendering. Business crisis refers to a significant, unexpected event or series of events that poses a threat to the operations, reputation, financial stability, or existence of a company
Free with trial High-Quality Vector Icons. Diagram financial growth decrease illustrations Decrease icon vector, filled. High-Quality Vector Icons
Free with trial Touchscreen gesture, Statistics and Dots message line icons set. Web traffic, Scroll down and Audit signs. 3d chart, Startup rocket symbols. Drag drop, Financial report. Technology set. Vector. Diagram financial growth decrease vectors Touchscreen gesture, Statistics and Dots message icons set. Web traffic, Scroll down and Audit signs. Vector. Touchscreen gesture, Statistics and Dots message line icons set. Web traffic, Scroll down and Audit signs. 3d chart, Startup rocket symbols. Drag drop, Financial report. Technology set. Vector
Free with trial Business crisis refers to a significant, unexpected event or series of events that poses a threat to the operations, reputation, financial stability, or existence of a company. Diagram financial growth decrease illustrations The man siting on Bomb for Business crisis concept 3d rendering. Business crisis refers to a significant, unexpected event or series of events that poses a threat to the operations, reputation, financial stability, or existence of a company
Free with trial Suitable for discounts. Vector 3d icon in high quality. Diagram financial growth decrease vectors The red arrow indicates a decrease in money. Suitable for discounts. Vector 3d icon in high quality
Free with trial Downward Trend Financial Graph Illustration. Diagram financial growth decrease vectors Downward Trend Financial Graph Illustration
Free with trial A vibrant 3D bar chart featuring multiple colorful columns, including red, blue, green, yellow, and purple, set against a clean white background. The bars vary in height, representing different data points or categories, and are displayed on a reflective surface, adding depth to the visualization. Grid lines provide a clear scale for interpretation. This modern graphic is ideal for illustrating statistics, business growth, financial performance, market analysis, and educational concepts in presentations, reports, and digital media. Diagram financial growth decrease illustrations Colorful 3D Bar Chart on White Background. A vibrant 3D bar chart featuring multiple colorful columns, including red, blue, green, yellow, and purple, set against a clean white background. The bars vary in height, representing different data points or categories, and are displayed on a reflective surface, adding depth to the visualization. Grid lines provide a clear scale for interpretation. This modern graphic is ideal for illustrating statistics, business growth, financial performance, market analysis, and educational concepts in presentations, reports, and digital media.
Free with trial Candlestick Chart vector Professional Financial Trading concept seamless pattern. Diagram financial growth decrease vectors Candlestick Chart vector Professional Financial Trading seamless pattern
Free with trial This image shows a hand-drawn graph depicting a sharp decline, generated by AI for illustrative purposes. It's a simple yet effective visual representation of negative growth or market downturn, useful for presentations or reports. Diagram financial growth decrease illustrations Downward Trend on Whiteboard. This image shows a hand-drawn graph depicting a sharp decline, generated by AI for illustrative purposes. It's a simple yet effective visual representation of negative growth or market downturn, useful for presentations or reports.
Free with trial A stock chart shows a red arrow trending upwards with a sharp decline represented by a red bar, juxtaposed with green bars, illustrating market fluctuations for financial analysis. Diagram financial growth decrease illustrations Stock Chart with Red Arrow and Green Bars. A stock chart shows a red arrow trending upwards with a sharp decline represented by a red bar, juxtaposed with green bars, illustrating market fluctuations for financial analysis
Free with trial Decline stage concept. Finance crisis with falling down graph and income decrease. Idea of bancruptcy and business risk. Money loss. Isolated flat vector illustration. Diagram financial growth decrease vectors Decline stage concept. Finance crisis with falling down graph