Free with trial Stacks of golden coins and red arrow down isolated on white background. Financial crisis, downtrend tendency, declining economy concept. 3D render. Diagram financial growth decrease illustrations Stacks of golden coins and red arrow down isolated on white background
Free with trial Modern reduction line icon. Premium pictogram isolated on a white background. Vector illustration. Stroke high quality symbol. Decrease icon in modern line style. Diagram financial growth decrease vectors Modern reduction line icon.
Free with trial A high-tech visualization of financial data, showing a glowing blue bar chart and line graphs representing stock market trends, business analytics, and economic growth. Diagram financial growth decrease illustrations Futuristic digital stock market chart with glowing blue graphs and data analysis on a dark background. A high-tech visualization of financial data, showing a. A high-tech visualization of financial data, showing a glowing blue bar chart and line graphs representing stock market trends, business analytics, and economic growth
Free with trial Cost efficient and quality increase control, business budget strategy, project management concept. Businessman work on computer growth graph productivity. Cost reduction effective analysis marketing. Diagram financial growth decrease illustrations Cost efficient and quality increase control
Free with trial Crisis typographic header. Finance crisis with falling down graph and income decrease. Idea of bancruptcy and business risk. Money loss. Isolated flat vector illustration. Diagram financial growth decrease vectors Crisis typographic header. Finance crisis with falling down graph
Free with trial Bar chart or bar graph decreasing vector icon with drop down arrow. Statistical data of stock, financial in business to loss, negative, decline or crisis. Graphic for report, presentation. 48x48 px. n. Diagram financial growth decrease illustrations Bar chart or bar graph decreasing vector icon with drop down arrow. 48x48 pixel perfect and editable stroke. Bar chart or bar graph decreasing vector icon with drop down arrow. Statistical data of stock, financial in business to loss, negative, decline or crisis. Graphic for report, presentation. 48x48 px.n
Free with trial Bitcoin, Income money and Presentation board icons simple set. Remote work banner. Home education class. Stock analysis sign. Cryptocurrency coin, Savings, Growth chart. Business trade. Vector. Diagram financial growth decrease vectors Bitcoin, Income money and Presentation board icons set. Stock analysis sign. Vector. Bitcoin, Income money and Presentation board icons simple set. Remote work banner. Home education class. Stock analysis sign. Cryptocurrency coin, Savings, Growth chart. Business trade. Vector
Free with trial Simple line graph illustration showing trend fluctuations, ideal for financial concepts. Diagram financial growth decrease illustrations Outline of ups and downs chart vector icon. Simple line graph illustration showing trend fluctuations, ideal for financial concepts
Free with trial Line art arrow icon set featuring percentage symbols with upward, downward, and bidirectional movement for financial data. Diagram financial growth decrease vectors Line art arrow icon set featuring percentage symbols with upward, downward, and bidirectional movement for financial data
Free with trial Illustration of up and down percentage arrow line icon. Percentage arrow with percent sign. Design concept for banking, credit, interest rates, finance and financial fields. isolated white background. Diagram financial growth decrease illustrations Illustration of up and down percentage arrow line icon.
Free with trial Illustration of up and down percentage arrow line icon. Percentage arrow with percent sign. Design concept for banking, credit, interest rates, finance and financial fields. isolated white background. Diagram financial growth decrease illustrations Illustration of up and down percentage arrow line icon.
Free with trial Illustration of up and down percentage arrow line icon. Percentage arrow with percent sign. Design concept for banking, credit, interest rates, finance and financial fields. isolated white background. Diagram financial growth decrease illustrations Illustration of up and down percentage arrow line icon.
Free with trial Illustration of up and down percentage arrow line icon. Percentage arrow with percent sign. Design concept for banking, credit, interest rates, finance and financial fields. isolated white background. Diagram financial growth decrease illustrations Illustration of up and down percentage arrow line icon.
Free with trial A detailed data visualization illustrating market trends over time. The infographic combines a line chart, which shows fluctuating values and percentages, with a bar chart representing data for specific time intervals. The line chart highlights key data points, such as peaks annotated with values like '1. 24%' and '500K'. The x-axis represents a timeline from January to March, while the y-axis. Diagram financial growth decrease illustrations A modern market trend analysis visualization combining a bar and line chart for financial data isolated on white background. A detailed data visualization illustrating market trends over time. The infographic combines a line chart, which shows fluctuating values and percentages, with a bar chart representing data for specific time intervals. The line chart highlights key data points, such as peaks annotated with values like '1.24%' and '500K'. The x-axis represents a timeline from January to March, while the y-axis
Free with trial Business graph icon. Flat design. Vector illustration, EPS 10. Diagram financial growth decrease vectors Recession statistics financial failure concept. Business graph icon. Flat design. Vector illustration, EPS 10.
Free with trial Modern reduction line icon. Premium pictogram isolated on a white background. Vector illustration. Stroke high quality symbol. Decrease icon in modern line style. Diagram financial growth decrease vectors Modern reduction line icon.
Free with trial Down market, decrease graph icon design vector. Diagram financial growth decrease vectors Down market, decrease graph icon design
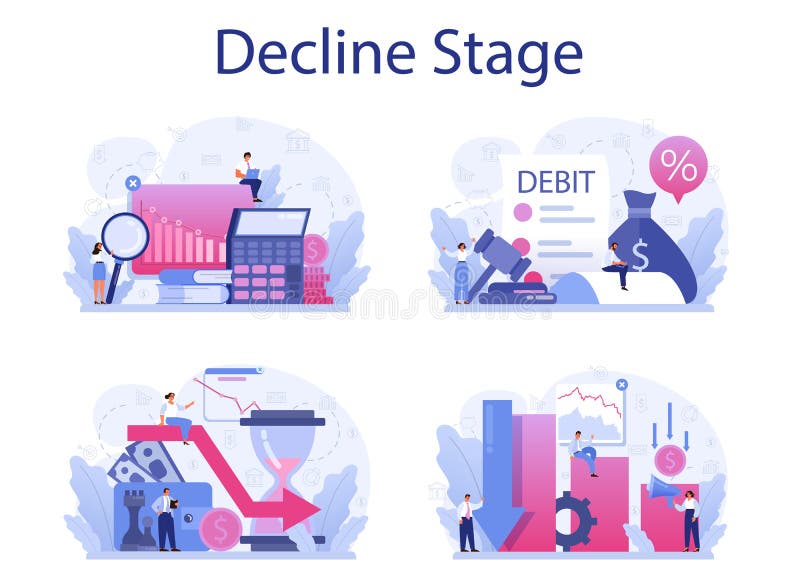
Free with trial Decline stage concept. Finance crisis with falling down graph and income decrease. Idea of bancruptcy and business risk. Money loss. Isolated flat vector illustration. Diagram financial growth decrease vectors Decline stage concept. Finance crisis with falling down graph
Free with trial Crypto money icon flat vector. Payment money cash. Diagram gain. Diagram financial growth decrease illustrations Crypto money icon flat vector. Payment money cash
Free with trial Coins stacks with arrow upwards. Financial success, savings and investment. Golden coins. Vector illustration in flat style. Diagram financial growth decrease vectors Coins stacks with arrow upwards
Free with trial Elevate your financial presentations and data visualizations with these captivating vintage-style arrow graphics. Perfect for illustrating price fluctuations, interest rate movements, and market trends, these retro-inspired up and down arrow designs are a visually engaging way to convey complex information. The sepia tone and textured background add a touch of vintage charm, bringing a classic. Diagram financial growth decrease illustrations Vintage-Inspired Arrow Graphics for Illustrating Price & Interest Rate Trends: A Retro Style Design Element. Elevate your financial presentations and data visualizations with these captivating vintage-style arrow graphics. Perfect for illustrating price fluctuations, interest rate movements, and market trends, these retro-inspired up and down arrow designs are a visually engaging way to convey complex information. The sepia tone and textured background add a touch of vintage charm, bringing a classic
Free with trial Crypto money icon outline vector. Payment money cash. Diagram gain. Diagram financial growth decrease illustrations Crypto money icon outline vector. Payment money cash
Free with trial Set of nine different graphs. Diagrams of oscilloscope on checkered paper. Diagram financial growth decrease vectors Diagram
Free with trial Vector illustration of a graph with a downward arrow, representing decline or negative growth. Diagram financial growth decrease vectors Professional Graph with Arrow Down Outline Icon Vector Illustration. Vector illustration of a graph with a downward arrow, representing decline or negative growth.
Free with trial Grow bitcoin salary icon flat vector. Gain finance. Cash coin bar diagram. Diagram financial growth decrease vectors Grow bitcoin salary icon flat vector. Gain finance
Free with trial Online money graph icon flat vector. Bitcoin online feature. Finance diagram. Diagram financial growth decrease illustrations Online money graph icon flat vector. Bitcoin online feature
Free with trial Grow bitcoin salary icon outline vector. Gain finance. Cash coin bar diagram. Diagram financial growth decrease illustrations Grow bitcoin salary icon outline vector. Gain finance
Free with trial Chat manager online icon flat vector. Bitcoin currency. Diagram gain salary. Diagram financial growth decrease illustrations Chat manager online icon flat vector. Bitcoin currency
Free with trial Rise money cash coin bar icon flat vector. Online graph. Financial analysis. Diagram financial growth decrease illustrations Rise money cash coin bar icon flat vector. Online graph
Free with trial Chat manager online icon outline vector. Bitcoin currency. Diagram gain salary. Diagram financial growth decrease illustrations Chat manager online icon outline vector. Bitcoin currency
Free with trial Bitcoin graph analyst icon flat vector. Data price salary. Gain financial. Diagram financial growth decrease illustrations Bitcoin graph analyst icon flat vector. Data price salary
Free with trial Decrease icon or logo isolated sign symbol vector illustration - Collection of high quality black style vector icons, seles chart icon isolated sign symbol vector illustration - Collection of high quality. Diagram financial growth decrease vectors Decrease icon or logo isolated sign symbol vector illustration
Free with trial Modern graph line icon. Premium pictogram isolated on a white background. Vector illustration. Stroke high quality symbol. Decrease icon in modern line style. Diagram financial growth decrease vectors Modern graph line icon.
Free with trial Overheating of the stock market and falling concept. Financial arrow chart, line graph. Stock market crisis, drawdown or correction. Vector illustration. Diagram financial growth decrease vectors Overheating of the stock market and falling concept.
Free with trial Bar chart or bar graph decreasing vector icon with drop down arrow. Statistical data of stock, financial in business to loss, negative, decline or crisis. Graphic for report, presentation. 48x48 px. n. Diagram financial growth decrease vectors Bar chart or bar graph decreasing vector icon with drop down arrow. 48x48 pixel perfect and editable stroke. Bar chart or bar graph decreasing vector icon with drop down arrow. Statistical data of stock, financial in business to loss, negative, decline or crisis. Graphic for report, presentation. 48x48 px.n
Free with trial Bitcoin graph analyst icon outline vector. Data price salary. Gain financial. Diagram financial growth decrease illustrations Bitcoin graph analyst icon outline vector. Data price salary
Free with trial Modern reduction line icon. Premium pictogram isolated on a white background. Vector illustration. Stroke high quality symbol. Decrease icon in modern line style. Diagram financial growth decrease vectors Modern reduction line icon.
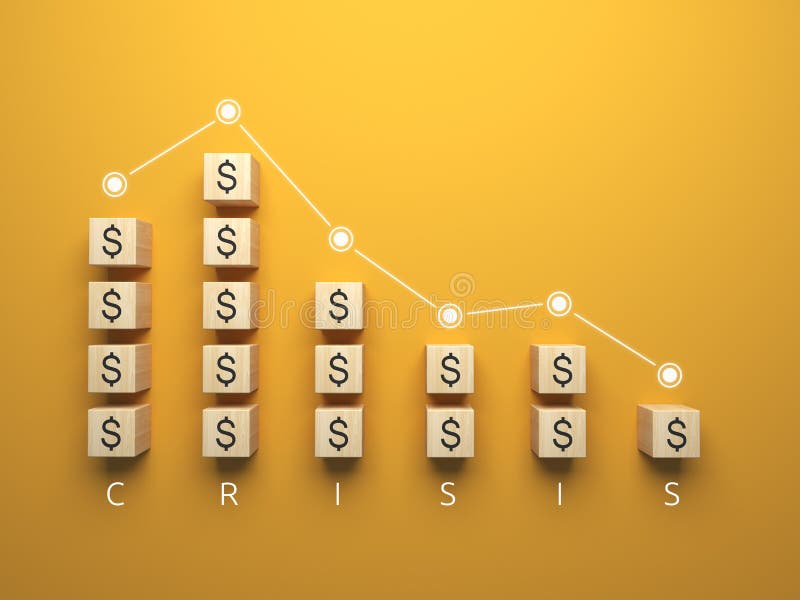
Free with trial Decrease and fall of indicators in 3D illustrations. Graph of the decline of the economy from wooden cubes. Diagram financial growth decrease illustrations Graph of the decline of the economy from wooden cubes
Free with trial Decrease and fall of indicators in 3D illustrations. Graph of the decline of the economy from wooden cubes. Diagram financial growth decrease illustrations Graph of the decline of the economy from wooden cubes
Free with trial Abstract blue laptop with graph gowing down. Financial crisis concept. Low poly style design. Blue geometric background. Wireframe light connection structure. Modern 3d graphic. Vector illustration. Diagram financial growth decrease vectors Abstract blue laptop with graph gowing down
Free with trial Abstarct illustration connectivity round background art design wallpaper. Diagram financial growth decrease illustrations Stock graphic illustration business decrease drop down. Abstarct illustration connectivity round background art design wallpaper.
Free with trial Abstarct illustration connectivity round background art design wallpaper. Diagram financial growth decrease illustrations Stock graphic illustration business decrease drop down. Abstarct illustration connectivity round background art design wallpaper.
Free with trial Cryptocurrency Up Down Graph. Vector Illustration with Financial Diagram Objects. Diagram financial growth decrease vectors Cryptocurrency Up Down Graph
Free with trial Online money graph icon outline vector. Bitcoin online feature. Finance diagram. Diagram financial growth decrease vectors Online money graph icon outline vector. Bitcoin online feature
Free with trial A wooden arrow pointing down is on top of a stack of wooden blocks. The arrow represents a downward trend or a decrease in something generated by AI. Diagram financial growth decrease vectors A wooden arrow pointing down is on top of a stack of wooden blocks generated by AI. A wooden arrow pointing down is on top of a stack of wooden blocks. The arrow represents a downward trend or a decrease in something generated by AI
Free with trial Rise money cash coin bar icon outline vector. Online graph. Financial analysis. Diagram financial growth decrease vectors Rise money cash coin bar icon outline vector. Online graph
Free with trial Rise money cash coin bar icon outline vector. Online graph. Financial analysis. Diagram financial growth decrease illustrations Rise money cash coin bar icon outline vector. Online graph
Free with trial A stack of wooden blocks with a red arrow pointing upwards. The blocks are arranged in a pyramid shape, with the top block being the largest. Concept of growth and progress generated by AI. Diagram financial growth decrease vectors A stack of wooden blocks with a red arrow pointing upwards generated by AI. A stack of wooden blocks with a red arrow pointing upwards. The blocks are arranged in a pyramid shape, with the top block being the largest. Concept of growth and progress generated by AI
Free with trial Businessman hand on dark background holding growing graph. Diagram financial growth decrease illustrations Concept of growth and progress. Businessman hand on dark background holding growing graph
Free with trial Businessman hand on dark background holding growing graph. Diagram financial growth decrease illustrations Concept of growth and progress. Businessman hand on dark background holding growing graph
Free with trial A wooden arrow pointing upwards is on top of a stack of wooden blocks. Concept of growth and progress, as the arrow represents upward movement generated by AI. Diagram financial growth decrease vectors A wooden arrow pointing upwards is on top of a stack of wooden blocks generated by AI. A wooden arrow pointing upwards is on top of a stack of wooden blocks. Concept of growth and progress, as the arrow represents upward movement generated by AI
Free with trial The fluctuating stock price graph concept background. Diagram financial growth decrease illustrations Abstract financial chart with a blue uptrend line. The fluctuating stock price graph concept background
Free with trial Modern reduction line icon. Premium pictogram isolated on a white background. Vector illustration. Stroke high quality symbol. Decrease icon in modern line style. Diagram financial growth decrease vectors Modern reduction line icon.
Free with trial Modern reduction line icon. Premium pictogram isolated on a white background. Vector illustration. Stroke high quality symbol. Decrease icon in modern line style. Diagram financial growth decrease vectors Modern reduction line icon.
Free with trial Graph rating icon outline vector. Growth chart. Money stock color flat. Diagram financial growth decrease vectors Graph rating icon vector flat. Graph rating icon outline vector. Growth chart. Money stock color flat
Free with trial Abstarct illustration connectivity round background art design wallpaper. Diagram financial growth decrease illustrations Stock graphic illustration business decrease drop down. Abstarct illustration connectivity round background art design wallpaper.
Free with trial Abstract blurred dots bokeh background. Diagram financial growth decrease illustrations Stock graphic illustration business decrease drop down. Abstract blurred dots bokeh background.
Free with trial Blue line chart stock market chart falling prices drop down from global economic and financial crisis , red line graph falling down due to low prices and market recession. Diagram financial growth decrease vectors Recession red line chart. Blue line chart stock market chart falling prices drop down from global economic and financial crisis , red line graph falling down due to low prices and market recession
Free with trial Reduction chart icon Vector symbol or sign set collection in black and white outline. Diagram financial growth decrease vectors Decline Chart Icon Illustrating Decrease in Performance, Economic Downturn, and Analytical Data. Reduction chart icon Vector symbol or sign set collection in black and white outline
Free with trial Modern reduction line icon. Premium pictogram isolated on a white background. Vector illustration. Stroke high quality symbol. Decrease icon in modern line style. Diagram financial growth decrease vectors Modern reduction line icon. Vector. Modern reduction line icon. Premium pictogram isolated on a white background. Vector illustration. Stroke high quality symbol. Decrease icon in modern line style
Free with trial Decline stage mobile application banner set. Finance crisis with falling down graph and income decrease. Idea of bancruptcy and business risk. Money loss. Isolated flat vector illustration. Diagram financial growth decrease vectors Decline stage mobile application banner set. Finance crisis
Free with trial Decline stage web banner or landing page set. Finance crisis with falling down graph and income decrease. Idea of bancruptcy and business risk. Money loss. Isolated flat vector illustration. Diagram financial growth decrease illustrations Decline stage web banner or landing page set. Finance crisis
Free with trial Decline stage concept. Finance crisis with falling down graph and income decrease. Idea of bancruptcy and business risk. Money loss. Isolated flat vector illustration. Diagram financial growth decrease vectors Decline stage concept. Finance crisis with falling down graph
Free with trial Bear Market, bearish market trend in stocks. Trade exchange background, down arrow graph for decrease in rates. Global economy crash. Diagram financial growth decrease vectors Bear Market
Free with trial A polygon bull charges forward against a backdrop of a stock market chart symbolizing finance This image can be used for financial promotions and market analysis. Diagram financial growth decrease illustrations Bull Market Concept with Polygon Bull and Stock Market Chart. A polygon bull charges forward against a backdrop of a stock market chart symbolizing finance This image can be used for financial promotions and market analysis
Free with trial Decline stage typographic header. Finance crisis with falling down graph and income decrease. Idea of bancruptcy and business risk. Money loss. Isolated flat vector illustration. Diagram financial growth decrease vectors Decline stage typographic header. Finance crisis with falling down graph
Free with trial Collapse stock market is seen by man invested money, standing near collapsing financial chart. Crisis in stock market and sharp stop in growth or beginning of decline in prices for stocks and bonds. Diagram financial growth decrease vectors Collapse of stock market is seen by man invested money, standing near collapsing financial chart. Collapse stock market is seen by man invested money, standing near collapsing financial chart. Crisis in stock market and sharp stop in growth or beginning of decline in prices for stocks and bonds
Free with trial Targeting, Payment click and Graph chart icons simple set. Button with halftone dots. Currency exchange sign. Target with arrows, Financial transfer, Growth report. Euro and usd. Finance set. Vector. Diagram financial growth decrease vectors Targeting, Payment click and Graph chart icons set. Currency exchange sign. Vector. Targeting, Payment click and Graph chart icons simple set. Button with halftone dots. Currency exchange sign. Target with arrows, Financial transfer, Growth report. Euro and usd. Finance set. Vector
Free with trial Targeting, Payment click and Graph chart icons simple set. Halftone dots button. Currency exchange sign. Target with arrows, Financial transfer, Growth report. Euro and usd. Finance set. Vector. Diagram financial growth decrease vectors Targeting, Payment click and Graph chart icons set. Currency exchange sign. Vector. Targeting, Payment click and Graph chart icons simple set. Halftone dots button. Currency exchange sign. Target with arrows, Financial transfer, Growth report. Euro and usd. Finance set. Vector
Free with trial Graph chart, Certificate and Column chart line icons set. Timeline process infograph. Income money sign. Growth report, Certified file, Financial graph. Savings. Education set. Vector. Diagram financial growth decrease vectors Graph chart, Certificate and Column chart icons set. Income money sign. Vector. Graph chart, Certificate and Column chart line icons set. Timeline process infograph. Income money sign. Growth report, Certified file, Financial graph. Savings. Education set. Vector
Free with trial Decline stage online service or platform set. Finance crisis with falling down graph and income decrease. Idea of bancruptcy. Online consultation, financing, support. Isolated flat vector illustration. Diagram financial growth decrease vectors Decline stage online service or platform set. Finance crisis
Free with trial Close up abstract view low curve go point simple account infochart draft project result set. Linear black pen hand drawn decrease info column logo. Outline art doodle note cartoon white paper style. Diagram financial growth decrease vectors Schematic graph. Vector drawing diagram. Close up abstract view low curve go point simple account infochart draft project result set. Linear black pen hand drawn decrease info column logo. Outline art doodle note cartoon white paper style
Free with trial Businessman hand on dark background holding growing graph. Diagram financial growth decrease illustrations Concept of growth and progress. Businessman hand on dark background holding growing graph
Free with trial Decline stage web banner or landing page. Finance crisis with falling down graph and income decrease. Idea of bancruptcy and business risk. Money loss. Isolated flat vector illustration. Diagram financial growth decrease vectors Decline stage web banner or landing page. Finance crisis
Free with trial Decline stage concept set. Finance crisis with falling down graph and income decrease. Idea of bancruptcy and business risk. Money loss. Isolated flat vector illustration. Diagram financial growth decrease vectors Decline stage concept set. Finance crisis with falling down graph
Free with trial Launch project, 360 degrees and Horizontal chart icons simple set. Button with halftone dots. Cashback sign. Business innovation, Full rotation, Presentation graph. Financial transfer. Vector. Diagram financial growth decrease vectors Launch project, 360 degrees and Horizontal chart icons set. Cashback sign. Vector. Launch project, 360 degrees and Horizontal chart icons simple set. Button with halftone dots. Cashback sign. Business innovation, Full rotation, Presentation graph. Financial transfer. Vector
Free with trial Modern reduction line icon. Premium pictogram isolated on a white background. Vector illustration. Stroke high quality symbol. Decrease icon in modern line style. Diagram financial growth decrease vectors Modern reduction line icon.
Free with trial Modern reduction line icon. Premium pictogram isolated on a white background. Vector illustration. Stroke high quality symbol. Decrease icon in modern line style. Diagram financial growth decrease vectors Modern reduction line icon.
Free with trial Modern reduction line icon. Premium pictogram isolated on a white background. Vector illustration. Stroke high quality symbol. Decrease icon in modern line style. Diagram financial growth decrease vectors Modern reduction line icon.
Free with trial Modern reduction line icon. Premium pictogram isolated on a white background. Vector illustration. Stroke high quality symbol. Decrease icon in modern line style. Diagram financial growth decrease vectors Modern reduction line icon.