Free with trial Stock price for buy or sell business company market investment finance economic vector. Diagram financial growth decrease vectors Stock price for buy or sell business company market investment finance economic
Free with trial Positive business sales graph. background. layered. Diagram financial growth decrease vectors Positive business sales graph
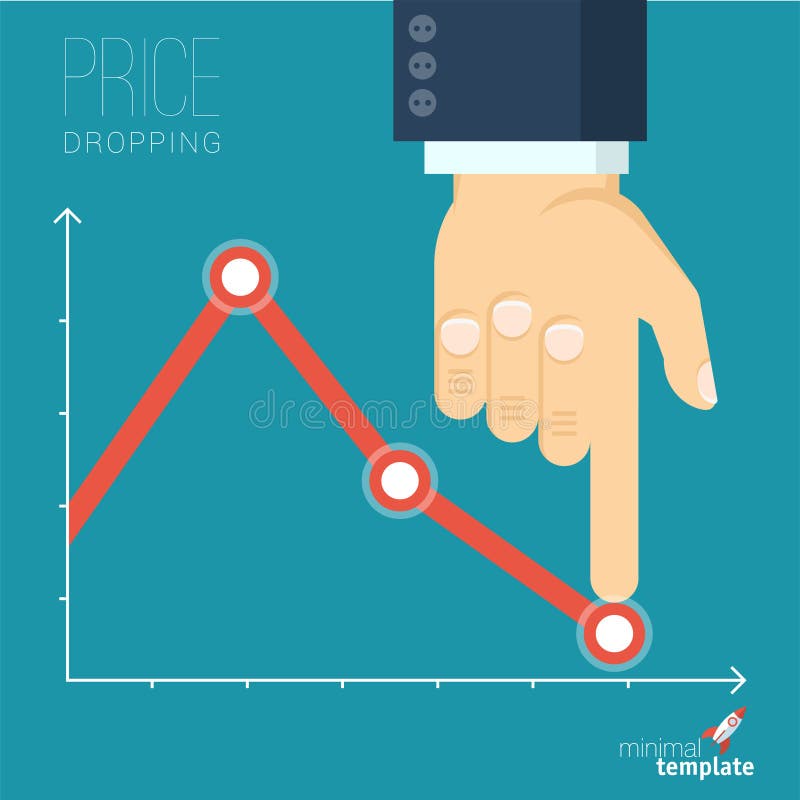
Free with trial Business man changes direction of sales chart. Human elements were created with 3D software and are not from any actual human likenesses. Diagram financial growth decrease illustrations Sales chart
Free with trial 3D graph with positive, negative and stagnant arrows. Diagram financial growth decrease vectors Prophecy dark. 3D graph with positive, negative and stagnant arrows
Free with trial Percentage arrow icon vector. Percent up and down icon vector. Diagram financial growth decrease vectors Up arrow percentage and down arrow percentage icon. Percentage arrow icon vector. Percent up and down icon vector.
Free with trial Arrow down: Arrow down is a symbol indicating decrease or downward movement. Diagram financial growth decrease vectors Arrow down
Free with trial Illustration of Hand pick money over increasing graph. Diagram financial growth decrease illustrations Business concept. Illustration of Hand pick money over increasing graph
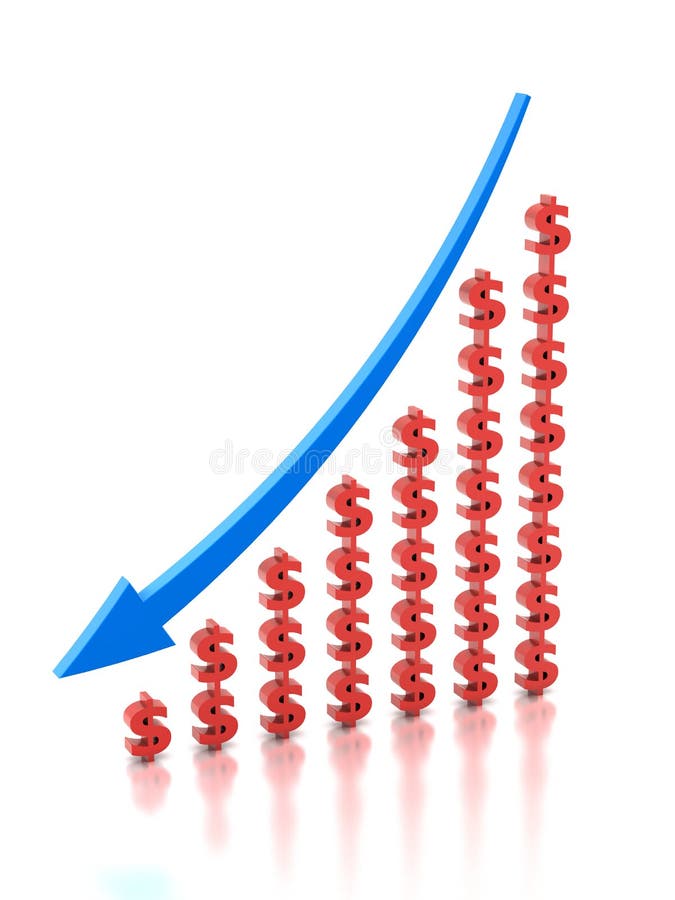
Free with trial Down trend dollar finance economy global. Diagram financial growth decrease illustrations Down trend dollar
Free with trial Flat design vector illustration of businessman creating decreasing business graph. Vector abstract price drop and sale countdown. Diagram financial growth decrease vectors Decreasing business graph
Free with trial Icons for business and Finance. Income,profit, and expense charts. Piggy Bank, dollar, accounting and interest. Investment. Diagram financial growth decrease vectors Icons for business and Finance. Income,profit, and expense charts.Piggy Bank, dollar, accounting and interest.
Free with trial 3d render of bar graph and a hand pulling it up. Diagram financial growth decrease illustrations Bar graph
Free with trial Bear market. Low poly wireframe vector stock exchange illustration. Polygonal digital image. Technology abstract style. Fall chart. Finance and business or animals theme World financial crisis concept. Diagram financial growth decrease vectors Bear market. Low poly
Free with trial Stock market changes and fluctuations vector concept. Markets plummet and skyrocket, soar. Market analysis symbol, trading and forecast. Eps10 illustration. Diagram financial growth decrease vectors Stock market changes and fluctuations vector concept. Markets plummet and skyrocket, soar. Market analysis symbol. Stock market changes and fluctuations vector concept. Markets plummet and skyrocket, soar. Market analysis symbol, trading and forecast. Eps10 illustration.
Free with trial Trend dollar money economic win finance business. Diagram financial growth decrease illustrations Trend dollar
Free with trial Stock market quotes graph chart. Diagram financial growth decrease illustrations Finance stock exchange background. Stock market quotes graph chart.
Free with trial Vector of bull and bear symbols of stock market trends. The growing and falling market. Easy editable layered vector illustration. Wild Animals. Diagram financial growth decrease vectors Vector of bull and bear symbols of stock market trends. The growing and falling market. Easy editable layered vector illustration
Free with trial Stack of bitcoin coins. in background a graph showing decrease in value. Falling of cryptocurrency. Diagram financial growth decrease vectors Bitcoin, cryptocurrency falling graph, risk, crash, collapse of BTC. Stack of bitcoin coins. in background a graph showing decrease in value. Falling of cryptocurrency.
Free with trial Silver bars graph prices illustration design over a white background. Diagram financial growth decrease illustrations Silver bars graph prices
Free with trial Background business, abstract image of a computer screen of abstract stock market data. Diagram financial growth decrease illustrations Global Market Data Screen. Background business, abstract image of a computer screen of abstract stock market data
Free with trial Businessmen are joining the effort to restore decreasing trend. Diagram financial growth decrease illustrations Restoring decreasing trend. Businessmen are joining the effort to restore decreasing trend
Free with trial Black and white outline showing a gear, a chart with falling bars, and an arrow pointing down, symbolizing economic. Diagram financial growth decrease illustrations Economic Downturn Gear, Chart, Arrow Down, Black and White. Black and white outline showing a gear, a chart with falling bars, and an arrow pointing down, symbolizing economic.
Free with trial Global international chart trend. Macroeconomic data and information, changing market monocolor vector illustration. Diagram financial growth decrease vectors Global international chart trend
Free with trial Business man crying and looking at down arrow feeling stressed about losing money or investment. Falling red graph is metaphor for financial crisis and decreasing income from investments in startup. Diagram financial growth decrease vectors Business man crying and looking at down arrow feeling stressed about losing money or investment
Free with trial Bar graph crashed, and the traffic cones indicate that it will be under construction. A 3d image. Diagram financial growth decrease illustrations Bar graph crashed, under construction - a 3d image. Bar graph crashed, and the traffic cones indicate that it will be under construction. A 3d image
Free with trial Background business, abstract image of a computer screen of abstract stock market data. Diagram financial growth decrease illustrations Global Market Screen. Background business, abstract image of a computer screen of abstract stock market data
Free with trial A flat design shows a bar graph depicting decreasing sales, with a downward trending red arrow. Diagram financial growth decrease vectors Decreasing Business Chart Shows a Dramatic Downturn in Sales. A flat design shows a bar graph depicting decreasing sales, with a downward trending red arrow. A flat design shows a bar graph depicting decreasing sales, with a downward trending red arrow.
Free with trial Abstract business background with a green graph and arrow on a wooden table. Diagram financial growth decrease vectors Abstract green graph with arrow on wooden table. Abstract business background with a green graph and arrow on a wooden table
Free with trial Up and down sign with green and red arrows vector illustration, sales bar chart symbol icon with arrow moving down and bar chart with arrow moving up, EPS 10. Diagram financial growth decrease vectors Up and down sign with green and red arrows vector illustration, sales bar chart symbol icon. Up and down sign with green and red arrows vector illustration, sales bar chart symbol icon with arrow moving down and bar chart with arrow moving up, EPS 10
Free with trial 3D decreasing red arrow on the chart. Diagram financial growth decrease illustrations Decreasing red arrow on the chart
Free with trial Graph going up and down sign isolated vector illustration on white background. Diagram financial growth decrease vectors Graph going up and down sign isolated vector illustration. Graph going up and down sign isolated vector illustration on white background
Free with trial Stock loss crisis crash illustration in red color. Online trade on computer screen. Diagram financial growth decrease illustrations Stock loss crisis crash in red color. Stock loss crisis crash illustration in red color. Online trade on computer screen.
Free with trial Business graph globe and people chart. Diagram financial growth decrease vectors Business graph
Free with trial Stocks fall. Candle stick graph chart of stock market investment trading. Bullish point, down trend of graph. Futuristic red signal trend drop down arrow chart. Diagram financial growth decrease vectors Stocks fall. Candle stick graph chart of stock market investment trading. Bullish point, down trend of graph. Futuristic red. Stocks fall. Candle stick graph chart of stock market investment trading. Bullish point, down trend of graph. Futuristic red signal trend drop down arrow chart
Free with trial The money and business outline icon set. The stack of dollar coins, gold 24k, upward and downward graph, online banking, briefcase and banknote symbols. Thin linear vector icons with editable strokes. Diagram financial growth decrease vectors The money and business outline vector icon set. The money and business outline icon set. The stack of dollar coins, gold 24k, upward and downward graph, online banking, briefcase and banknote symbols. Thin linear vector icons with editable strokes
Free with trial Illustration of a growing business intelligence with a dashboard displaying high metrics, a stack of data chips, and a simple magnifying glass. Vector flat icon design on a white background for a data analysis illustration --chaos 30 --ar 16:9 --v 7 Job ID: cfbe4cc3-3bae-455f-ac79-f340192ae4d4. Diagram financial growth decrease illustrations Data Analysis and Reporting Concept Computer Screen with Charts and Magnifying Glass. Illustration of a growing business intelligence with a dashboard displaying high metrics, a stack of data chips, and a simple magnifying glass. Vector flat icon design on a white background for a data analysis illustration --chaos 30 --ar 16:9 --v 7 Job ID: cfbe4cc3-3bae-455f-ac79-f340192ae4d4
Free with trial Statistic Bar Chart Outline Sign Data Stats Business Performance Market Analysis Economic Trend Line Icon Presentation Display Board Symbol. Diagram financial growth decrease vectors Statistic Bar Chart Outline Sign Data Stats Business Performance Market Analysis Economic Trend Line Icon Presentation Display
Free with trial Isometric business analyst professional composition with conceptual financial analysis icons and people vector illustration. Diagram financial growth decrease illustrations Male Chart Analyst Composition. Isometric business analyst professional composition with conceptual financial analysis icons and people vector illustration
Free with trial Illustration of Hand pick rising arrow. Diagram financial growth decrease illustrations Business concept. Illustration of Hand pick rising arrow
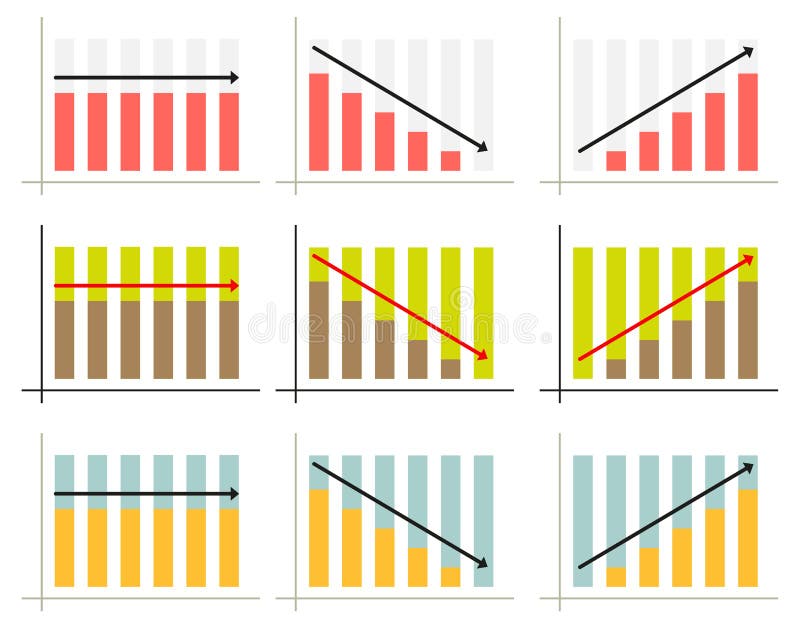
Free with trial Set of 3 infographic graphs for3 different situations in 3 color schemes. Diagram financial growth decrease vectors Graph set. Set of 3 infographic graphs for3 different situations in 3 color schemes
Free with trial Isometric business analyst professional composition with conceptual financial analysis icons and people vector illustration. Diagram financial growth decrease vectors Radial Chart Analyst Composition. Isometric business analyst professional composition with conceptual financial analysis icons and people vector illustration
Free with trial Isometric business analyst professional composition with conceptual financial analysis icons and people vector illustration. Diagram financial growth decrease illustrations Business Analyst Graphs Composition. Isometric business analyst professional composition with conceptual financial analysis icons and people vector illustration
Free with trial Isometric business analyst professional composition with conceptual financial analysis icons and people vector illustration. Diagram financial growth decrease vectors Smartphone Business Bars Composition. Isometric business analyst professional composition with conceptual financial analysis icons and people vector illustration
Free with trial The laptop with stock quote candlestick charts on the screen. The falling and increasing of shares graphs. The broker`s laptop, selling, buying buttons. Business flat isometric concept illustration. Diagram financial growth decrease vectors The laptop with stock quote candlestick charts on the screen.
Free with trial The laptop with stock quote charts on the screen. The fall and the increase in the shares price graphs. The trader`s computer, selling and buying buttons. Business flat isometric concept illustration. Diagram financial growth decrease vectors The laptop with stock quote charts on the screen.
Free with trial This image displays a 3D bar graph with five vertical bars of decreasing height, rendered in a vibrant pink color. A pink line graph with a sharp downward trajectory originates from the top of the tallest bar and descends across the bars, ending at the base of the shortest bar. The entire composition is isolated on a clean white background, clearly illustrating a negative trend or decline. Diagram financial growth decrease illustrations A pink 3D bar graph with a descending line graph on a white background chart. This image displays a 3D bar graph with five vertical bars of decreasing height, rendered in a vibrant pink color. A pink line graph with a sharp downward trajectory originates from the top of the tallest bar and descends across the bars, ending at the base of the shortest bar. The entire composition is isolated on a clean white background, clearly illustrating a negative trend or decline
Free with trial Up and Down sign with green and red arrows vector illustration. Concept of sales bar chart symbol icon with arrow moving down and sales bar chart with arrow moving up. Diagram financial growth decrease vectors Up and Down sign with green and red arrows vector illustration. Concept of sales bar chart symbol icon
Free with trial Red arrow decline arrow isolated in background. Diagram financial growth decrease illustrations Economy Recession Bar and Arrow. 3D Render illustration. Red arrow decline arrow isolated in background
Free with trial A collection of five distinct black and white graphic representations of data. From left to right, the first is a line graph with dots, showing fluctuations. The second is a zig-zag line graph with dots and an upward arrow. The third is a series of ascending vertical bars. The fourth is a bar chart with a single dot above one of the bars. The fifth is a pie chart divided into four sections, with. Diagram financial growth decrease vectors Collection of black and white business and data charts and graphs statistics analytics. A collection of five distinct black and white graphic representations of data. From left to right, the first is a line graph with dots, showing fluctuations. The second is a zig-zag line graph with dots and an upward arrow. The third is a series of ascending vertical bars. The fourth is a bar chart with a single dot above one of the bars. The fifth is a pie chart divided into four sections, with
Free with trial Isometric business analyst professional composition with conceptual financial analysis icons and people vector illustration. Diagram financial growth decrease vectors Business Analyst Woman Composition. Isometric business analyst professional composition with conceptual financial analysis icons and people vector illustration
Free with trial Bull and bear economy concept with 3d rendering bull and bear on stock market chart background. Diagram financial growth decrease illustrations Bull and bear economy concept
Free with trial Background business, abstract image of a computer screen of abstract stock market data. Diagram financial growth decrease illustrations Stock Market Abstract Background. Background business, abstract image of a computer screen of abstract stock market data
Free with trial Bull and bear economy concept with 3d rendering bull and bear on stock market chart background. Diagram financial growth decrease illustrations Bull and bear economy concept
Free with trial Professional Vector Logo Design High-Resolution & Fully Editable This high-quality vector logo is designed with precision and creativity making it ideal for modern businesses, startups, and creative professionals The design is clean, scalable, and easy to customize�perfect for branding marketing materials, websites, and print applications. Key Features:100% Vector format (AI EPS SVG)Fully editable (colors, text, and shapes)High resolution � perfect for both web and print Modern, professional, and versatile design Ready for branding and promotional use Elevate your brand with this premium quality logo!. Diagram financial growth decrease vectors Dementia icon editable stock vector logo design. Professional Vector Logo Design High-Resolution & Fully Editable This high-quality vector logo is designed with precision and creativity making it ideal for modern businesses, startups, and creative professionals The design is clean, scalable, and easy to customize�perfect for branding marketing materials, websites, and print applications. Key Features:100% Vector format (AI EPS SVG)Fully editable (colors, text, and shapes)High resolution � perfect for both web and print Modern, professional, and versatile design Ready for branding and promotional use Elevate your brand with this premium quality logo!
Free with trial Statistic graph with colorful decreasing bars in white background. Diagram financial growth decrease illustrations Decreasing statistics. Statistic graph with colorful decreasing bars in white background
Free with trial Light Blue arrow decline arrow isolated in background. Diagram financial growth decrease illustrations Economy Recession Bar and Arrow. 3D Render illustration. Light Blue arrow decline arrow isolated in background
Free with trial Inflation reduction act on blue background. Diagram financial growth decrease illustrations Inflation reduction act on blue
Free with trial Oil price falling concept isolated on white background. Diagram financial growth decrease illustrations Oil price falling concept
Free with trial Decreasing arrow and golden coins heap. Crisis, money and loss concept. 3d rendering. Diagram financial growth decrease illustrations Decreasing arrow and golden coins heap
Free with trial Euro Currency Icons in Circles. Diagram financial growth decrease vectors Euro Currency Icons
Free with trial Graph going Up and Down sign with green and red arrows vector. Flat design vector illustration concept of sales bar chart symbol icon with arrow moving down and sales bar chart with arrow moving up. Diagram financial growth decrease illustrations Graph going Up and Down sign with green and red arrows vector. Flat design vector illustration concept of sales bar chart symbol. Graph going Up and Down sign with green and red arrows vector. Flat design vector illustration concept of sales bar chart symbol icon with arrow moving down and sales bar chart with arrow moving up.
Free with trial Simple up and down arrows. Upward, downward arrows in green and red isolated on white background, set of two. Vector illustration. Diagram financial growth decrease vectors Simple up and down arrows
Free with trial Vector illustration of money go down with plant go to dead - Business concept. Diagram financial growth decrease vectors Vector illustration of money go down with plant go to dead
Free with trial 3D rendering of a business infographic chart showing a progressive decline over four periods. Red color on the 3D bar graph chart with an arrow on it. Diagram financial growth decrease illustrations 3D render of a business data in decline. 3D rendering of a business infographic chart showing a progressive decline over four periods. Red color on the 3D bar graph chart with an arrow on it.
Free with trial A clean line drawing showcases a magnifying glass focusing on a hand holding a declining bar graph with a downward. Diagram financial growth decrease illustrations Declining Market Analysis Magnifying Glass on Loss Trend. A clean line drawing showcases a magnifying glass focusing on a hand holding a declining bar graph with a downward.
Free with trial Light Blue arrow decline arrow isolated in background. Diagram financial growth decrease illustrations Economy Recession Bar and Arrow. 3D Render illustration. Light Blue arrow decline arrow isolated in background
Free with trial A 3D rendered graphic depicts a simplified bar chart with pastel colored bars in pink, yellow, and blue. A line graph with white lines and orange and yellow nodes crosses diagonally above the bars. The elements are set against a light blue background with a light tan border, all isolated on a white background. Diagram financial growth decrease vectors 3 D cartoon bar chart with line graph on blue background data. A 3D rendered graphic depicts a simplified bar chart with pastel colored bars in pink, yellow, and blue. A line graph with white lines and orange and yellow nodes crosses diagonally above the bars. The elements are set against a light blue background with a light tan border, all isolated on a white background
Free with trial Collection of simple black vector icons representing financial charts, data analysis graphs, and business statistics. Includes trend arrows, magnifier, and settings symbols. Diagram financial growth decrease vectors Set of black business graph and chart icons for data analysis. Collection of simple black vector icons representing financial charts, data analysis graphs, and business statistics. Includes trend arrows, magnifier, and settings symbols
Free with trial Stock crisis red price drop down chart fall / Stock market exchange analysis or forex graph business and finance crash money losing moving economic investment loss. Diagram financial growth decrease illustrations Stock crisis red price drop down chart fall
Free with trial Doodle Graph icon. Blue pen hand drawn infographic symbol on a notepaper piece. Line art style graphic design element. Web button with shadow. Decline, save on expences concept. Diagram financial growth decrease vectors Doodle Graph icon
Free with trial A simple line art icon of a decreasing bar chart with a trend arrow, representing negative growth or loss in business. Diagram financial growth decrease vectors Line Art Outline Decreasing Bar Chart Trend Arrow Business Icon. A simple line art icon of a decreasing bar chart with a trend arrow, representing negative growth or loss in business.
Free with trial Increasing graph and decreasing graph concept. Red progress arrow and blue recession arrow isolated on white background represent increase profit and recession business. Diagram financial growth decrease vectors Progress and recession. Increasing graph and decreasing graph concept. Red progress arrow and blue recession arrow isolated on white background represent increase profit and recession business.
Free with trial Statistic graph with colorful increasing bars in white background. Diagram financial growth decrease illustrations Increasing statistics. Statistic graph with colorful increasing bars in white background
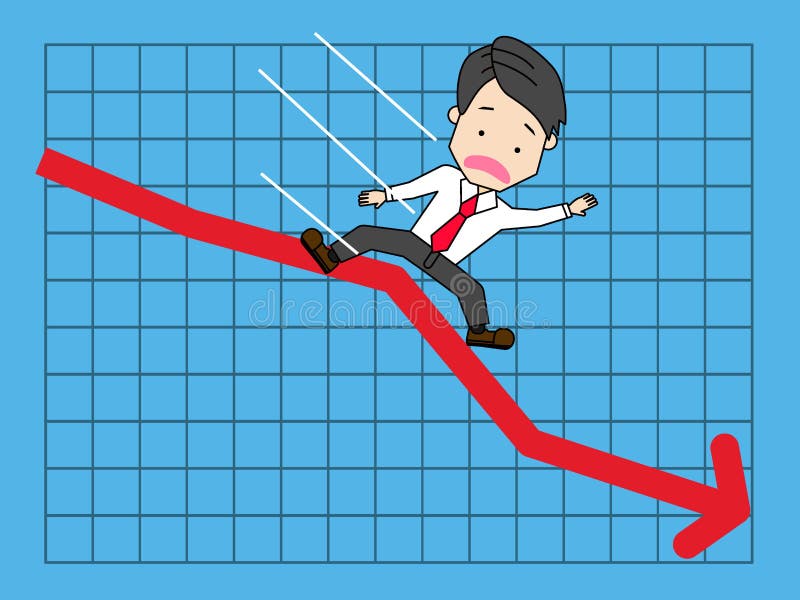
Free with trial Businessmen are slipping graphs falling on down. Funny vector concept. Diagram financial growth decrease vectors Businessmen are slipping graphs falling on down.
Free with trial Businessman pushing hard against falling graph down. Business Concept. Diagram financial growth decrease vectors Businessman pushing hard against falling graph down
Free with trial Digital illustration of graph in colour background. Diagram financial growth decrease illustrations Graph
Free with trial Digital illustration of graph in colour background. Diagram financial growth decrease illustrations Graph
Free with trial Digital illustration of graph in colour background. Diagram financial growth decrease illustrations Graph
Free with trial Digital illustration of graph in colour background. Diagram financial growth decrease illustrations Graph
Free with trial Digital illustration of graph in colour background. Diagram financial growth decrease illustrations Graph
Free with trial Abstract blue gowing down chart. Low poly style design. Abstract geometric background. Wireframe light connection structure. Modern 3d graphic concept. Isolated vector illustration. Diagram financial growth decrease vectors Low poly abstract blue gowing down chart. Abstract blue gowing down chart. Low poly style design. Abstract geometric background. Wireframe light connection structure. Modern 3d graphic concept. Isolated vector illustration.