Free with trial Reduction chart icon Vector symbol or sign set collection in black and white outline. Diagram financial growth decrease vectors Reduction chart icon flat line symbol set. Reduction chart icon Vector symbol or sign set collection in black and white outline
Free with trial US Dollar Exchange Rate Chart Illustration Forecast. Diagram financial growth decrease illustrations US Dollar Exchange Rate Chart Illustration Forecast
Free with trial Collection of simple black vector icons representing financial charts, data analysis graphs, and business statistics. Includes trend arrows, magnifier, and settings symbols. Diagram financial growth decrease illustrations Set of black business graph and chart icons for data analysis. Collection of simple black vector icons representing financial charts, data analysis graphs, and business statistics. Includes trend arrows, magnifier, and settings symbols
Free with trial Stock market quotes graph chart. Diagram financial growth decrease illustrations Finance stock exchange background. Stock market quotes graph chart.
Free with trial Shiny red and green arrows intersecting symbolize opposing directions or viewpoints This graphic is suitable for business presentations or conflict resolution materials. Diagram financial growth decrease illustrations Red and Green Arrows Pointing in Opposite Directions Symbolize Conflict. Shiny red and green arrows intersecting symbolize opposing directions or viewpoints This graphic is suitable for business presentations or conflict resolution materials
Free with trial A line art image depicting a magnifying glass focused on a person icon and a downward trending bar chart. Diagram financial growth decrease illustrations Declining Sales Analysis Magnifying Glass, Downward Trend Chart. A line art image depicting a magnifying glass focused on a person icon and a downward trending bar chart.
Free with trial A 3D rendered bar chart displays a series of bars decreasing in height from left to right. The bars are colored with a gradient transitioning from blue to orange, set against a plain white background. The visual represents a downward trend or decline. Diagram financial growth decrease illustrations Downward Trending Bar Chart with Gradient Colors on a White Background graph statistics. A 3D rendered bar chart displays a series of bars decreasing in height from left to right. The bars are colored with a gradient transitioning from blue to orange, set against a plain white background. The visual represents a downward trend or decline
Free with trial A hand-drawn business graph showing a decreasing trend line. It represents a down market, financial loss, economic downturn, or a business crisis. This could be used to illustrate various business presentations or reports. Diagram financial growth decrease illustrations Hand Drawn Business Graph with Decreasing Trend Line on White Background. A hand-drawn business graph showing a decreasing trend line. It represents a down market, financial loss, economic downturn, or a business crisis. This could be used to illustrate various business presentations or reports
Free with trial Colorful 3D pie chart render with segments in green, orange, yellow against soft green background. Minimalist design highlights data visualization concept. Useful for business reports. Diagram financial growth decrease illustrations Colorful 3D pie chart render with segments in green, orange, yellow against soft green background. Minimalist design highlights
Free with trial A simple line drawing depicts a magnifying glass focusing on a declining bar chart with a downward arrow and zig-zag. Diagram financial growth decrease illustrations Declining Market Analysis Magnifying Glass, Downward Trend Chart. A simple line drawing depicts a magnifying glass focusing on a declining bar chart with a downward arrow and zig-zag.
Free with trial Online finance crisis. Man with briefcase near smartphone with falling graphs and diagrams. Economical crisis and recession, inflation. Sad trader and investor. Flat vector illustration. Diagram financial growth decrease vectors Online finance crisis. Man with briefcase near smartphone with falling graphs and diagrams. Economical crisis and recession
Free with trial A data visualization bar graph displays three vertical bars arranged horizontally showing the relationship between positive and negative values with green bars representing positive data points on the left, orange and red bars indicating negative values in the middle, all set against a soft gradient background blending light green and pink tones with a central white square containing the word. Diagram financial growth decrease illustrations Bar graph showing positive and negative values comparison with green and red colored vertical bars on gradient background. A data visualization bar graph displays three vertical bars arranged horizontally showing the relationship between positive and negative values with green bars representing positive data points on the left, orange and red bars indicating negative values in the middle, all set against a soft gradient background blending light green and pink tones with a central white square containing the word
Free with trial Declining Bar Graph Representing Downturn or Reduction in Statistics. Diagram financial growth decrease vectors Declining Bar Graph Representing Downturn or Reduction in Statistics
Free with trial Japanese Yen Exchange Rate Chart Illustration Forecast. Diagram financial growth decrease illustrations Japanese Yen Exchange Rate Chart Illustration Forecast
Free with trial Green glossy arrow pointing upwards isolated on white background. Direction guide. Close-up. Diagram financial growth decrease illustrations Green glossy arrow pointing upwards isolated on white background. Direction guide
Free with trial Person's hand points to stock market data displayed on laptop screen indicating analysis Use for finance or investment themes. Diagram financial growth decrease illustrations Analyzing Stock Market Data on Laptop Screen with Hand Pointing. Person's hand points to stock market data displayed on laptop screen indicating analysis Use for finance or investment themes
Free with trial Stock market quotes graph chart. Diagram financial growth decrease illustrations Stock market quotes graph. Stock market quotes graph chart.
Free with trial Hand-drawn graph of business progress, with upward and downward arrows. Diagram financial growth decrease vectors Hand-drawn graph of business progress, with upward and downward arrows
Free with trial Graph going Up and Down sign with green and red arrows vector. Flat design vector illustration concept of sales bar chart symbol icon with arrow moving down and sales bar chart with arrow moving up. Diagram financial growth decrease vectors Graph going Up and Down sign with green and red arrows vector. Flat design vector illustration concept of sales bar chart symbol. Graph going Up and Down sign with green and red arrows vector. Flat design vector illustration concept of sales bar chart symbol icon with arrow moving down and sales bar chart with arrow moving up.
Free with trial A magnifying glass highlights a "Buy" signal amidst a declining stock market graph. Diagram financial growth decrease illustrations Buy Opportunity Stock Market Downturn Analysis with Magnifying Glass. A magnifying glass highlights a "Buy" signal amidst a declining stock market graph.
Free with trial A 3d rendering of a bar graph with green bars and a red downward-pointing arrow, illustrating a decline or negative. Diagram financial growth decrease illustrations 3d bar graph with downward arrow showing decline on white background. A 3d rendering of a bar graph with green bars and a red downward-pointing arrow. A 3d rendering of a bar graph with green bars and a red downward-pointing arrow, illustrating a decline or negative
Free with trial Bitcoin graph billboard icon flat vector. Pay finance. Digital data price. Diagram financial growth decrease illustrations Bitcoin graph billboard icon flat vector. Pay finance
Free with trial The visual features a black line graph illustration showing a downward trend. Positioned on a light blue backdrop, the minimalist design may represent decline, loss or negative progression. The image suits presentations, reports, or articles related to finance, statistics, business, or economic subjects, for editorial or commercial use. Diagram financial growth decrease illustrations Decreasing trend line graph on blue background finance visual concept. The visual features a black line graph illustration showing a downward trend. Positioned on a light blue backdrop, the minimalist design may represent decline, loss or negative progression. The image suits presentations, reports, or articles related to finance, statistics, business, or economic subjects, for editorial or commercial use
Free with trial A 3D rendered illustration displays a decreasing bar graph composed of blue, purple, and yellow bars, indicating declining numerical data and trends. Diagram financial growth decrease vectors Glossy bar graph with descending data trend on transparent background. A 3D rendered illustration displays a decreasing bar graph composed of blue, purple, and yellow bars, indicating declining numerical data and trends.
Free with trial Linear finances statistics descending bars graphic icon from Business outline collection. Thin line finances statistics descending bars graphic icon. Diagram financial growth decrease vectors Linear finances statistics descending bars graphic icon from Business outline collection. Thin line finances statistics descending
Free with trial Graph chart going up and down sign arrows flat design vector illustration on white background. Diagram financial growth decrease vectors Graph chart going up and down sign arrows flat design vector illustration
Free with trial Bitcoin change icon flat vector. Online monetary system. Data price salary. Diagram financial growth decrease vectors Bitcoin change icon flat vector. Online monetary system
Free with trial A green arrow points downward, while a red arrow points upward, symbolizing opposing forces, trends, or choices on a white background. created ai. Diagram financial growth decrease illustrations Green down arrow and red up arrow representing contrasting trends or directions. A green arrow points downward, while a red arrow points upward, symbolizing opposing forces, trends, or choices on a white background.created ai
Free with trial Simple flat design illustration of a stock market trend graph with a blue fill. The axis are dark gray and background is black. Diagram financial growth decrease vectors Flat Design Stock Market Trend Graph with Axis on a Black Background. Simple flat design illustration of a stock market trend graph with a blue fill. The axis are dark gray and background is black.
Free with trial Stock market quotes graph chart. Diagram financial growth decrease illustrations Finance stock exchange background. Stock market quotes graph chart.
Free with trial Stock market quotes graph chart. Diagram financial growth decrease illustrations Finance stock exchange background. Stock market quotes graph chart.
Free with trial Stock market quotes graph chart. Diagram financial growth decrease illustrations Finance stock exchange background. Stock market quotes graph chart.
Free with trial Stock market quotes graph chart. Diagram financial growth decrease illustrations Finance stock exchange background. Stock market quotes graph chart.
Free with trial Stock market quotes graph chart. Diagram financial growth decrease illustrations Finance stock exchange background. Stock market quotes graph chart.
Free with trial Cost reduction concept. the businessman pulled the arrow down with a rope. Diagram financial growth decrease vectors Cost reduction concept. the businessman pulled the arrow down with a rope
Free with trial Stock market quotes graph chart. Diagram financial growth decrease illustrations Finance stock exchange background. Stock market quotes graph chart.
Free with trial A 3D rendered bar graph in descending order shows decline or trend, rendered in pastel shades of blue, green, and purple. Diagram financial growth decrease vectors Colorful descending bar graph illustration, 3D render, on transparent background. A 3D rendered bar graph in descending order shows decline or trend, rendered in pastel shades of blue, green, and purple.
Free with trial Businessman on falling down chart. Cartoon character thin line style vector. Diagram financial growth decrease vectors Businessman on falling down chart. Cartoon character thin line style.
Free with trial This is an detailed collection of minimalist line icons representing various business graphs and data trends. Diagram financial growth decrease vectors Professional business graph and data visualization line icon set for reports. This is an detailed collection of minimalist line icons representing various business graphs and data trends
Free with trial Black line graph icon with data points showing fluctuations on a white background Clear details and vibrant co. Diagram financial growth decrease illustrations Black line graph icon showing fluctuating data points on a white background chart. Black line graph icon with data points showing fluctuations on a white background Clear details and vibrant co
Free with trial Illustration features worried blocks stacked with a data chart and arrows pointing up and down, in a flat, graphic style. Diagram financial growth decrease vectors Worried blocks stacked with data chart and arrows depicting volatile market conditions or economic uncertainty. Illustration features worried blocks stacked with a data chart and arrows pointing up and down, in a flat, graphic style.
Free with trial Red Stock Market and Economic graph showing a down trend and recession concept, Generative ai. Diagram financial growth decrease illustrations Red Stock Market and Economic graph showing a down trend and recession concept
Free with trial A 3D bar chart made of red and blue cubes arranged in ascending and descending steps against a white background. Diagram financial growth decrease illustrations 3D Red and Blue Cubes Arranged in Ascending Bar Chart Formation on White graph data. A 3D bar chart made of red and blue cubes arranged in ascending and descending steps against a white background
Free with trial Crisis icon isolated on white background. Vector illustration. Eps 10. Diagram financial growth decrease vectors Crisis icon isolated on white background. Vector illustration
Free with trial Minimalist bar chart created with natural wooden blocks, symbolizing data, financial trends, market fluctuations, and business analysis on a white surface. Diagram financial growth decrease illustrations Wooden blocks bar chart illustrating business data progression on a white background. Minimalist bar chart created with natural wooden blocks, symbolizing data, financial trends, market fluctuations, and business analysis on a white surface.
Free with trial Business woman pushing hard against falling graph down. Business Concept. Diagram financial growth decrease vectors Business woman pushing hard against falling graph down
Free with trial Isometric graph showing different trends with ups and downs, concept of trading and business analysis. Diagram financial growth decrease illustrations Isometric graph showing different trends with ups and downs
Free with trial Vector illustration of a statistical bar graph, with a green arrow with an upward trend. Diagram financial growth decrease vectors Statistical bar graph
Free with trial Debit card, Euro currency and Loan percent line icons set. Handshake deal, research and promotion complex icons. Statistics timer sign. Wallet with credit card, Eur banking, Discount blueprint. Vector. Diagram financial growth decrease vectors Debit card, Euro currency and Loan percent icons set. Statistics timer sign. Vector. Debit card, Euro currency and Loan percent line icons set. Handshake deal, research and promotion complex icons. Statistics timer sign. Wallet with credit card, Eur banking, Discount blueprint. Vector
Free with trial Set of vector chart and graph icons for infographic. Thin line diagrams for business report or presentation. Diagram financial growth decrease vectors Set of vector chart
Free with trial Global Recession Background. illustration of economic recession with red arrow symbol falling down. Diagram financial growth decrease vectors Global Recession Background. illustration of economic recession
Free with trial Global Recession Background. illustration of economic recession with red arrow symbol falling down. Diagram financial growth decrease vectors Global Recession Background. illustration of economic recession
Free with trial Global Recession Background. illustration of economic recession with red arrow symbol falling down. Diagram financial growth decrease vectors Global Recession Background
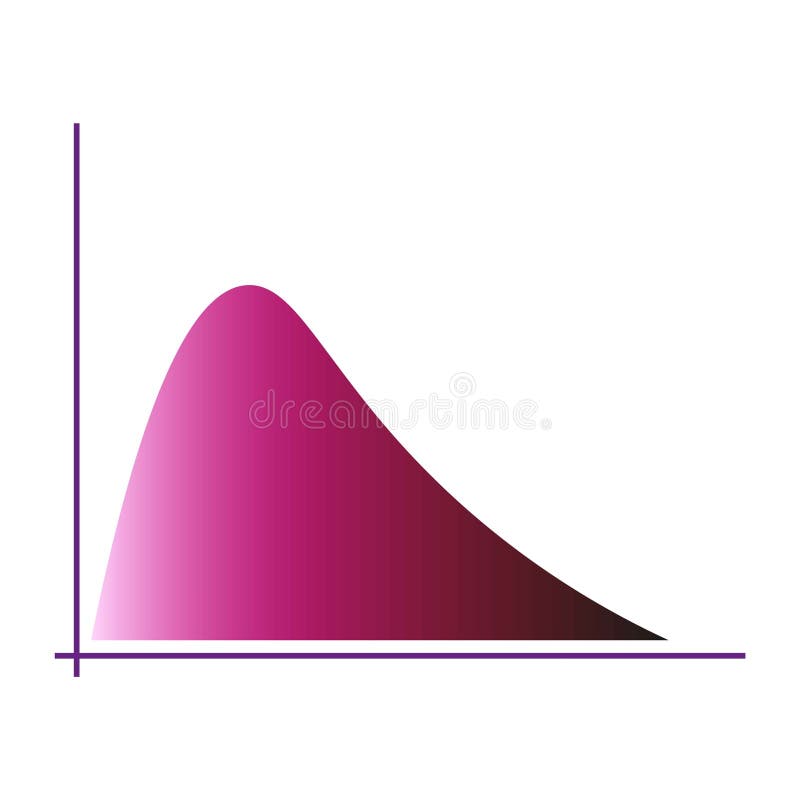
Free with trial Gradient curve chart. Pink color distribution. Graphical data visualization. Modern vector graphic. EPS 10. Diagram financial growth decrease vectors Gradient curve chart. Pink color distribution. Graphical data visualization. Modern vector graphic.
Free with trial Vector Illustration of Global Recession Economic Crisis Caused by Corona Virus Pandemic, Epidemic,. Diagram financial growth decrease illustrations Illustration of Global Recession Economic Crisis
Free with trial Colorful flat design depicts bull and bear market fluctuation. Rising and falling arrows symbolize investment direction with a simple yet informative design. Diagram financial growth decrease vectors Bull and Bear Market Illustration with Price Fluctuation Indicators on Black Background. Colorful flat design depicts bull and bear market fluctuation. Rising and falling arrows symbolize investment direction with a simple yet informative design.
Free with trial This is an detailed series of analytical icons for data visualization and statistical reporting in a clean line style. Diagram financial growth decrease vectors Comprehensive analytical data and statistics symbols for corporate business presentations. This is an detailed series of analytical icons for data visualization and statistical reporting in a clean line style
Free with trial Red glossy arrow pointing upwards isolated on white background. Direction guide. Close-up. Diagram financial growth decrease illustrations Red glossy arrow pointing upwards isolated on white background. Direction guide
Free with trial Red glossy arrow pointing upwards isolated on white background. Direction guide. Close-up. Diagram financial growth decrease illustrations Red glossy arrow pointing upwards isolated on white background. Direction guide
Free with trial Red glossy arrow pointing upwards isolated on white background. Direction guide. Close-up. Diagram financial growth decrease illustrations Red glossy arrow pointing upwards isolated on white background. Direction guide
Free with trial A set of nine minimalist vector icons depicting various types of charts and graphs including bar charts, progress bars, and trend lines for data visualization and analytics. Diagram financial growth decrease vectors Collection of simple black glyph icons representing business charts graphs and data analysis. A set of nine minimalist vector icons depicting various types of charts and graphs including bar charts, progress bars, and trend lines for data visualization and analytics
Free with trial A laptop screen shows a sales funnel chart with declining percentages positioned next to a notebook mug and plant on a desk. Diagram financial growth decrease illustrations Laptop displaying sales funnel chart with decreasing percentages beside notebook mug and plant. A laptop screen shows a sales funnel chart with declining percentages positioned next to a notebook mug and plant on a desk
Free with trial The businessman on top of oil barrels. Diagram financial growth decrease illustrations The businessman on top of oil barrels
Free with trial Clean vector icon illustrating a declining line graph with push pins, symbolizing data analysis. Diagram financial growth decrease illustrations Line graph decline chart icon. Clean vector icon illustrating a declining line graph with push pins, symbolizing data analysis
Free with trial Flat design illustration showing colorful bar graph combined with a line chart, both displaying data trends against a simple black background. Diagram financial growth decrease vectors Colorful Bar Graph and Line Chart on Black Background Illustrating Data Analysis and Trends. Flat design illustration showing colorful bar graph combined with a line chart, both displaying data trends against a simple black background.
Free with trial Green glossy arrow pointing upwards isolated on white background. Direction guide. Close-up. Diagram financial growth decrease illustrations Green glossy arrow pointing upwards isolated on white background. Direction guide
Free with trial Green glossy arrow pointing upwards isolated on white background. Direction guide. Close-up. Diagram financial growth decrease illustrations Green glossy arrow pointing upwards isolated on white background. Direction guide
Free with trial Green glossy arrow pointing upwards isolated on white background. Direction guide. Close-up. Diagram financial growth decrease illustrations Green glossy arrow pointing upwards isolated on white background. Direction guide
Free with trial Green glossy arrow pointing upwards isolated on white background. Direction guide. Close-up. Diagram financial growth decrease illustrations Green glossy arrow pointing upwards isolated on white background. Direction guide
Free with trial A flat style illustration of market trend with upward and downward arrows and wavy lines against black background. Diagram financial growth decrease vectors Stock market trend illustration showing upward and downward direction in financial trading. A flat style illustration of market trend with upward and downward arrows and wavy lines against black background.
Free with trial Bar chart illustration showing a downward trend with a red arrow indicating a significant drop in values. Diagram financial growth decrease vectors Bar chart illustration showing a downward trend with a red arrow indicating a significant drop in values
Free with trial Dollar rate vector icon. Increase, reduse dollar icon. EPS 10. Diagram financial growth decrease vectors Dollar rate vector icon. Increase, reduse dollar
Free with trial Arrow Going Down, Declining, Business Chart. Diagram financial growth decrease vectors Arrow Going Down, Declining, Business Chart
Free with trial Close-up view of city street with bar chart overlay, visualizing urban data analysis ,Generative AI. Diagram financial growth decrease illustrations Urban data analysis, closeup view of city street with bar chart visualization closeup. Close-up view of city street with bar chart overlay, visualizing urban data analysis ,Generative AI
Free with trial Futuristic red stock market graph showing a sharp decline in business and finance Digital Display. Diagram financial growth decrease illustrations Red Stock Market Decline Graph Digital Display Futuristic Technology Finance Business Data Chart. Futuristic red stock market graph showing a sharp decline in business and finance Digital Display
Free with trial Chart indicators Exchange. Reporting schedules. vector. infographic. Diagram financial growth decrease vectors Chart indicators Exchange.
Free with trial Set of vector chart and graph icons for infographic. Thin line diagrams for business report or presentation. Diagram financial growth decrease vectors Set of vector chart. Set of vector chart and graph icons for infographic. Thin line diagrams for business report or presentation.
Free with trial PNG 3D Bar Chart Data Visualization Business Analytics Performance Metrics Colorful Graph against transparent Background. Diagram financial growth decrease illustrations PNG 3D Bar Chart Data Visualization Business Analytics Performance Metrics Colorful Graph against transparent Background
Free with trial The Red Bear on Mother Board for Business concept 3d Rendering. Diagram financial growth decrease illustrations The Red Bear on Mother Board for Business concept 3d Rendering
Free with trial A 3D bar graph with a jagged trend line shows rising data followed by a sudden drop, set against a bright blue background. Diagram financial growth decrease illustrations A 3D bar graph with a jagged trend line shows rising data followed by a sudden drop, set against a bright blue background