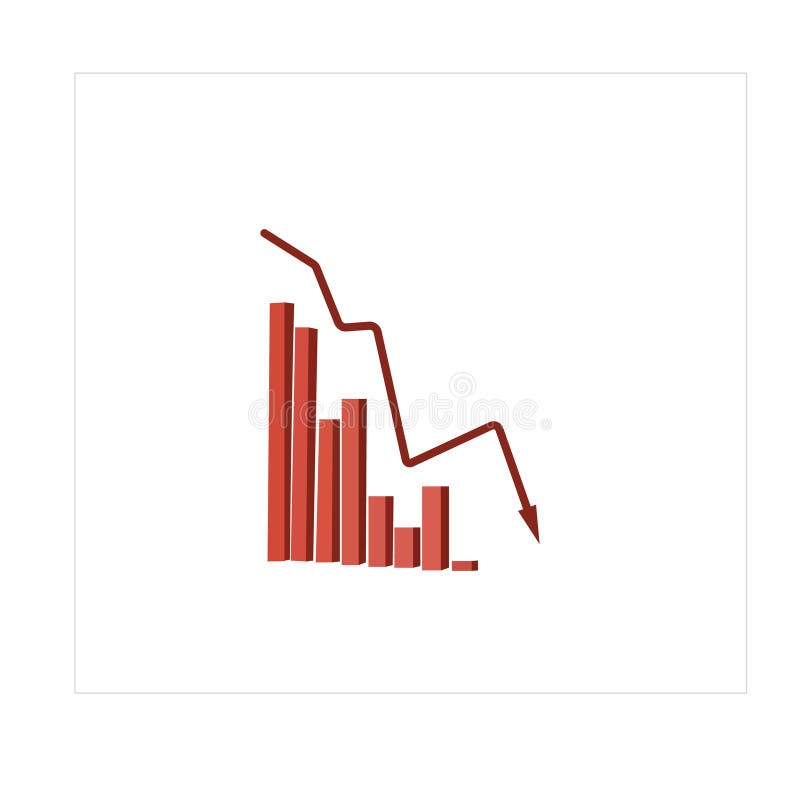
Free with trial A 3D rendered bar chart with bars in red, yellow, green, and blue, arranged in descending order of height. A thick black arrow curves downwards from the top left, crossing over the bars and pointing towards the bottom right, indicating a downward trend or decline. The image is set against a clean, white background. Diagram financial growth decrease illustrations Colorful Bar Chart Showing Downward Trend with Black Arrow on White Background graph. A 3D rendered bar chart with bars in red, yellow, green, and blue, arranged in descending order of height. A thick black arrow curves downwards from the top left, crossing over the bars and pointing towards the bottom right, indicating a downward trend or decline. The image is set against a clean, white background
Free with trial Two broken trend lines with arrows are going up and down, 3d illustration on white background. Diagram financial growth decrease illustrations Two broken trend lines are going up and down. Two broken trend lines with arrows are going up and down, 3d illustration on white background
Free with trial Business graph with up arrow down arrow logo template. Diagram financial growth decrease vectors Business graph with up arrow down arrow logo template
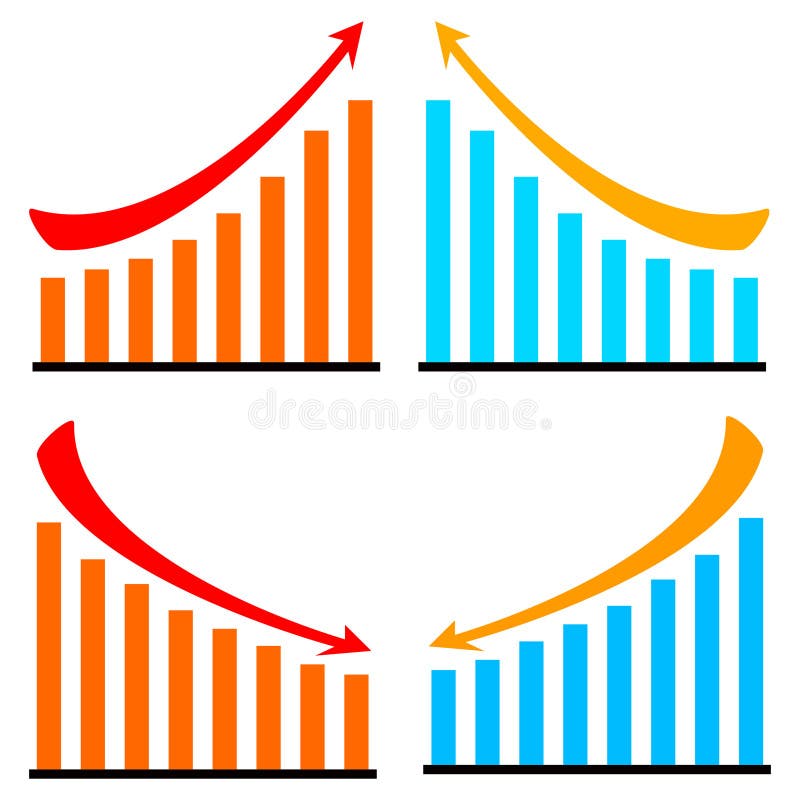
Free with trial Ascending and descending graph set. Vector illustration. Diagram financial growth decrease vectors Ascending and descending graph set.
Free with trial Ascending and descending graph set. Vector illustration. Diagram financial growth decrease vectors Ascending and descending graph set.
Free with trial Displaying dashboard grid showing fluctuating blue and red line graphs with metallic green sphere. Analytics, investment, data visualization, technology, finance, bar chart, dashboard. Diagram financial growth decrease illustrations Displaying dashboard grid showing fluctuating blue and red line graphs with metallic green sphere
Free with trial Climate crisis and environment policy ESG or ecology problem concept businessman leader watering seedling plant on bar graph with pollution smoke rising up. Diagram financial growth decrease vectors Climate crisis and environment policy ESG or ecology problem concept businessman leader watering seedling plant on bar graph. Climate crisis and environment policy ESG or ecology problem concept businessman leader watering seedling plant on bar graph with pollution smoke rising up
Free with trial Illustration of a business activities. Diagram financial growth decrease vectors Illustration of a business activities
Free with trial A visual representation of declining performance, with red bars and a descending line graph on a white background. Diagram financial growth decrease illustrations Red bar chart showing downward trend and line graph. A visual representation of declining performance, with red bars and a descending line graph on a white background.
Free with trial A downward trend is shown on a graph. The graph is black and white. Diagram financial growth decrease illustrations A downward trend is shown on a graph
Free with trial Performance of business analysis icon, vector graphic artwork design element. Diagram financial growth decrease vectors Analysis result performance icon. Performance of business analysis icon, vector graphic artwork design element
Free with trial A red downward-trending arrow overlays a background of financial documents featuring colorful charts and graphs. A person in a suit is writing on one of the pages, indicating analysis or note-taking. The setting suggests a focus on market trends, possibly within a corporate or financial context. The grid pattern across the image adds a conceptual element of data analysis. a i generated. Diagram financial growth decrease illustrations Declining market trends analysis with a downward trending red arrow overlay. A red downward-trending arrow overlays a background of financial documents featuring colorful charts and graphs. A person in a suit is writing on one of the pages, indicating analysis or note-taking. The setting suggests a focus on market trends, possibly within a corporate or financial context. The grid pattern across the image adds a conceptual element of data analysis. a i generated
Free with trial A 3D blue bar chart and a dark blue line graph illustrate a significant downward trend, indicating a decline in data over time. Diagram financial growth decrease illustrations Blue bar chart and line graph showing downward trend. A 3D blue bar chart and a dark blue line graph illustrate a significant downward trend, indicating a decline in data over time.
Free with trial Coronabond coronavirus cells covid-19 influenza with color of europe euro, concept of corona bond crisis for economy finance business europe for pandemic health risk recession on chroma key green screen background. Diagram financial growth decrease illustrations Coronabond coronavirus cells covid-19 influenza with color of europe euro, concept of corona bond crisis for economy finance
Free with trial Concept graph stock falls or illustrations for Business woman design and infographic eps. 10. Diagram financial growth decrease vectors Concept graph stock falls or illustrations for Business woman de
Free with trial This illustration shows a downward trend for the US dollar and an upward trend for the Japanese Yen, generated by AI. The graphic uses stylized gold coins with currency symbols and directional arrows to clearly visualize the contrasting market movements. Diagram financial growth decrease illustrations USD vs. Yen: Currency Fluctuation. This illustration shows a downward trend for the US dollar and an upward trend for the Japanese Yen, generated by AI. The graphic uses stylized gold coins with currency symbols and directional arrows to clearly visualize the contrasting market movements.
Free with trial Failure, red arrow going down on white background in business concept. 3d illustration. Diagram financial growth decrease illustrations Failure, red arrow going down on white background in business
Free with trial A bright blue easel holds a whiteboard displaying a bar chart with a clear downward trend. The bars transition in color from green to red, and a prominent red arrow points downwards, emphasizing the decline. The illustration is set against a clean white background. Diagram financial growth decrease illustrations Blue Easel Displaying a Downward Trend Bar Chart with Red Arrow graph decline. A bright blue easel holds a whiteboard displaying a bar chart with a clear downward trend. The bars transition in color from green to red, and a prominent red arrow points downwards, emphasizing the decline. The illustration is set against a clean white background
Free with trial A simple black silhouette of a bar chart with varying heights on a white background. The icon represents data analysis and statistical representation. Diagram financial growth decrease vectors Bar chart icon for data analysis and statistics graph. A simple black silhouette of a bar chart with varying heights on a white background. The icon represents data analysis and statistical representation
Free with trial Sixteen simple yellow candlestick charts with black lines on a white background, arranged in a four by four grid. Diagram financial growth decrease vectors Vector illustration of sixteen yellow candlestick charts. Sixteen simple yellow candlestick charts with black lines on a white background, arranged in a four by four grid
Free with trial Deposit and graph on white background. Diagram financial growth decrease illustrations Deposit and graph on white
Free with trial Modern collection of business and finance elements. Contains data, charts,diagrams. Use it for presentation, report and infographic projects. Diagram financial growth decrease vectors Set of Business and Finance Infographic Elements on Transparent Background Vectors. Modern collection of business and finance elements. Contains data, charts,diagrams. Use it for presentation, report and infographic projects
Free with trial Global international chart trend. Macroeconomic data and information, changing market monocolor vector illustration. Diagram financial growth decrease illustrations Global international chart trend
Free with trial The success and recession of business. Flat vector concept illustration. Managers on the background of arrow graphs holding a bundle of paper money or a coin in one hand and calculator in another. Diagram financial growth decrease vectors The success and recession of business flat vector concept illustration. The success and recession of business. Flat vector concept illustration. Managers on the background of arrow graphs holding a bundle of paper money or a coin in one hand and calculator in another.
Free with trial Graph down. Black Icon graph decline with arrow isolated on white background. Hologram statistic. Deficit direction for business concept design. Analysis information forecast. Vector illustration. Diagram financial growth decrease vectors Graph down. Black Icon graph decline with arrow isolated on white background. Hologram deficit direction for business design. Graph down. Black Icon graph decline with arrow isolated on white background. Hologram statistic. Deficit direction for business concept design. Analysis information forecast. Vector illustration
Free with trial Business Chart Down - Black And Golden 3D Illustration - Isolated On White Background. Diagram financial growth decrease illustrations Business Chart Down - Black And Golden 3D Illustration - Isolated On White Background
Free with trial Up and Down sign with golden arrows isolated on a black, vector illustration. Concept of sales bar chart symbol icon with arrow moving down and sales bar chart with gold arrows moving up and down. Diagram financial growth decrease vectors Up and Down sign with golden arrows isolated on a black, vector illustration. Concept of sales bar chart symbol
Free with trial Digital illustration of graph in colour background. Diagram financial growth decrease illustrations Graph
Free with trial A 3D rendered bar chart illustrates a decreasing trend. The bars, colored in a gradient from yellow to purple, represent data points that are diminishing in value. Placed on a simple gray base, the chart is isolated against a white background. This image is suitable for illustrating concepts related to business, finance, statistics, and economic downturns. Diagram financial growth decrease illustrations 3D Bar Chart Decreasing Trend. A 3D rendered bar chart illustrates a decreasing trend. The bars, colored in a gradient from yellow to purple, represent data points that are diminishing in value. Placed on a simple gray base, the chart is isolated against a white background. This image is suitable for illustrating concepts related to business, finance, statistics, and economic downturns.
Free with trial Blue Glass 3D Bar Chart Showing Data Decline. Diagram financial growth decrease illustrations Blue Glass 3D Bar Chart Showing Data Decline
Free with trial Sketch graphs and charts for business presentation. Diagram financial growth decrease vectors Financial chart. Sketch graphs and charts for business presentation
Free with trial Vector image of the Business concept about crisis. Diagram financial growth decrease vectors Business concept about crisis
Free with trial An isometric 3D bar chart composed of blue, gray, and orange blocks of varying heights is arranged on a white background. Diagram financial growth decrease illustrations Isometric 3D bar chart with blue, gray, and orange blocks on a white background graph data. An isometric 3D bar chart composed of blue, gray, and orange blocks of varying heights is arranged on a white background
Free with trial Businessman and stock market arrow presentation. Cheerful businessman with graph indicating increase. The concept of business success. Can be used for workflow layout, banner, diagram, number options, step up options, web design, timeline, infographic template. Vector illustration. Diagram financial growth decrease vectors Businessman and stock market arrow presentation.Cheerful businessman with graph indicating increase.The concept of business
Free with trial Vector image of the Business concept about crisis. Diagram financial growth decrease vectors Business concept about crisis2. Vector image of the Business concept about crisis
Free with trial Vector image of the Business concept about crisis. Diagram financial growth decrease vectors Business concept about crisis3. Vector image of the Business concept about crisis
Free with trial Colorful bar graph with downward trend, business concept illustration. Diagram financial growth decrease vectors Colorful bar graph with downward trend, business concept illustration
Free with trial Several red, blue, and green arrows pointing in different directions are on a light yellow square grid. Some arrows point up, while others point down. This represents various economic trends. Diagram financial growth decrease illustrations Colorful Painted Arrows Move up and Down on Graph Paper Background. Several red, blue, and green arrows pointing in different directions are on a light yellow square grid. Some arrows point up, while others point down. This represents various economic trends.
Free with trial Line graph with a green line and a red dot on top. The red dot is located at the top left corner of the graph. Diagram financial growth decrease illustrations Graph with a green line and a red dot
Free with trial Businessman hand pushing a business graph on a touch screen interface. Hand holding business graph. Isolated on white background. Vector illustration flat design. Diagram financial growth decrease vectors Businessman hand pushing a business graph on a touch screen interface.Hand holding business graph.Isolated on white background.
Free with trial A set of nine minimalist vector icons depicting various types of charts and graphs including bar charts, progress bars, and trend lines for data visualization and analytics. Diagram financial growth decrease vectors Collection of simple black glyph icons representing business charts graphs and data analysis. A set of nine minimalist vector icons depicting various types of. A set of nine minimalist vector icons depicting various types of charts and graphs including bar charts, progress bars, and trend lines for data visualization and analytics
Free with trial A visual representation of a financial downturn, depicted by a bar chart with bars decreasing in height and a prominent red arrow pointing downwards, signifying a negative trend. Diagram financial growth decrease illustrations Bar chart with red arrow showing decline isolated on white background. A visual representation of a financial downturn, depicted by a bar chart with bars decreasing in height and a prominent red arrow pointing downwards, signifying a negative trend
Free with trial Digital illustration of graph in colour background. Diagram financial growth decrease illustrations Graph
Free with trial Digital illustration of graph in colour background. Diagram financial growth decrease illustrations Graph
Free with trial Digital illustration of arrow in colour background. Diagram financial growth decrease illustrations Arrow
Free with trial Digital illustration of graph in colour background. Diagram financial growth decrease illustrations Graph
Free with trial Digital illustration of arrow in colour background. Diagram financial growth decrease illustrations Arrow
Free with trial Digital illustration of graph in colour background. Diagram financial growth decrease illustrations Graph
Free with trial Digital illustration of graph in colour background. Diagram financial growth decrease illustrations Graph
Free with trial Digital illustration of graph in colour background. Diagram financial growth decrease illustrations Graph
Free with trial Digital illustration of graph in colour background. Diagram financial growth decrease illustrations Graph
Free with trial Digital illustration of graph in colour background. Diagram financial growth decrease illustrations Graph
Free with trial Digital illustration of graph in colour background. Diagram financial growth decrease illustrations Graph
Free with trial Digital illustration of graph in colour background. Diagram financial growth decrease illustrations Graph
Free with trial Climate crisis and environment policy, ESG or ecology problem concept, businessman leader watering seedling plant on bar graph with pollution smoke rising up. Pollution crisis, green energy, air. Diagram financial growth decrease vectors Climate crisis and environment policy, ESG or ecology problem concept, businessman leader watering seedling plant on bar
Free with trial Modern and various graph icons, bar chart, pie chart icon for indicating the progress. Diagram financial growth decrease vectors Modern and various graph icons, bar chart, pie chart icon
Free with trial A man is pointing at a stock chart with a sell indicator and a downward arrow, indicating a potential downward trend in the market. Diagram financial growth decrease vectors Man pointing at sell chart with downward arrow indicator. a man is pointing at a stock chart with a sell indicator and a downward arrow, indicating a potential downward trend in the market.
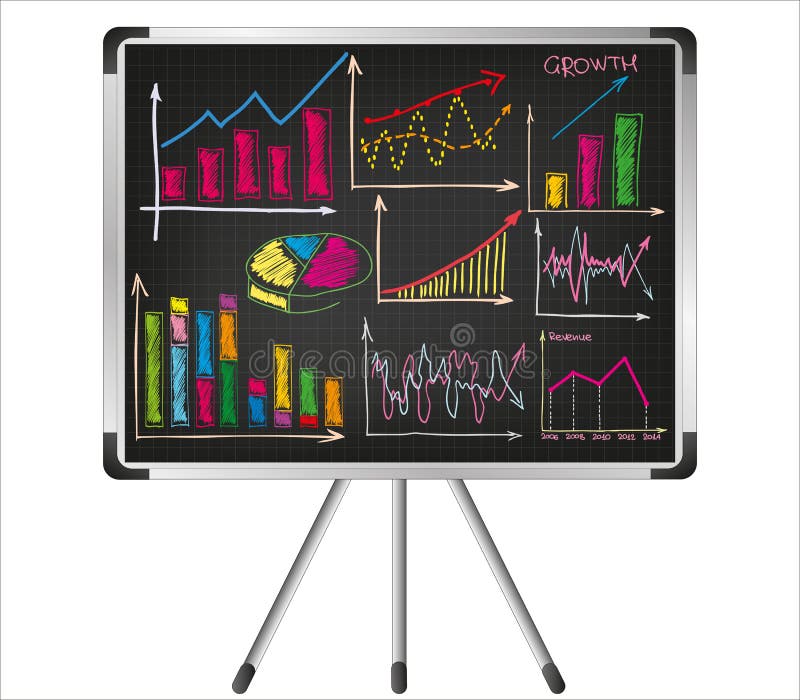
Free with trial Sketch graphs and charts for business presentation. Diagram financial growth decrease vectors Financial charts on the flip chart. Sketch graphs and charts for business presentation
Free with trial A colorful graph with the words Net Income written below it. The graph is made up of many different colored lines and dots. Diagram financial growth decrease illustrations A colorful graph with the words Net Income written below it
Free with trial Simple line graph illustrating data points and trends. Ideal for presentations, reports, and infographics related to business analysis, market research, or financial reporting. Diagram financial growth decrease vectors Simple Line Graph, Data Visualization, Business Chart. Simple line graph illustrating data points and trends. Ideal for presentations, reports, and infographics related to business analysis, market research, or financial reporting.
Free with trial Bright, colorful stock chart on dark screen. Fluctuations lines and grid representing data and trends. Stock photo. Diagram financial growth decrease illustrations Bright, colorful stock chart on dark screen. Fluctuations lines and grid representing data and trends
Free with trial Covid19 virus and red arrow down with data business and stock market or forex trading graph concept with on blue background 3D illustration. Diagram financial growth decrease illustrations Covid19 virus and red arrow down with data business and stock market or forex trading graph concept banner with on blue background. Covid19 virus and red arrow down with data business and stock market or forex trading graph concept with on blue background 3D illustration
Free with trial Wooden toy houses illustrate real estate market trends. Created with the help of Generative AI tools. Diagram financial growth decrease illustrations Wooden toy houses illustrate real estate market trends.
Free with trial Stock market is on sale when market plunge in economic crisis, buy point to make profit in long run concept, businessman investor expertise pointing at lowest with sale price tag on stock market graph. Diagram financial growth decrease illustrations Stock market is on sale when market plunge in economic crisis, buy point to make profit in long run concept, businessman investor
Free with trial A 3D bar chart with a red arrow indicating a significant downward trend, symbolizing financial loss or economic decline. Isolated on a white background. Diagram financial growth decrease illustrations Bar chart showing a downward trend isolated on white background. A 3D bar chart with a red arrow indicating a significant downward trend, symbolizing financial loss or economic decline. Isolated on a white background
Free with trial Percentage with arrow up and down. Percentage arrow with percent sign. Design concept for banking, credit, interest rate, finance and money sphere. Diagram financial growth decrease vectors Percentage with arrow up and down. Percentage arrow with percent sign.
Free with trial Falling bar chart with up and right arrows illustrating declining business trends. Diagram financial growth decrease vectors Falling bar chart with up and right arrows illustrating declining business trends
Free with trial Digital illustration of bussiness arrow in digital background. Diagram financial growth decrease illustrations Bussiness arrow
Free with trial Digital illustration of bussiness arrow in digital background. Diagram financial growth decrease illustrations Bussiness arrow
Free with trial Digital illustration of bussiness arrow in digital background. Diagram financial growth decrease illustrations Bussiness arrow
Free with trial Digital illustration of bussiness arrow in digital background. Diagram financial growth decrease illustrations Bussiness arrow
Free with trial Businessman hand on head and looks up to a downward trending arrow chart. Diagram financial growth decrease illustrations Businessman hand on head and looks up to a downward trending arrow chart
Free with trial Business on falling down chart. Concept business illustration, Fail, Risk, Problem. Diagram financial growth decrease illustrations Chart with red down arrow on abstract background. Falling growth in busines. Business on falling down chart. Concept business illustration, Fail, Risk, Problem.
Free with trial Digital illustration of a business graph. Diagram financial growth decrease illustrations Business graph
Free with trial Digital illustration of business graph in white background. Diagram financial growth decrease illustrations Business graph
Free with trial Digital illustration of business graph in white background. Diagram financial growth decrease illustrations Business graph
Free with trial Digital illustration of business graph in white background. Diagram financial growth decrease illustrations Business graph
Free with trial Digital illustration of Dollar and graph in colour background. Diagram financial growth decrease illustrations Dollar and graph
Free with trial Data analytics ascending icon from user interface outline collection. Thin line data analytics ascending icon isolated on white background. Diagram financial growth decrease vectors Data analytics ascending icon from user interface outline collection. Thin line data analytics ascending icon isolated on white
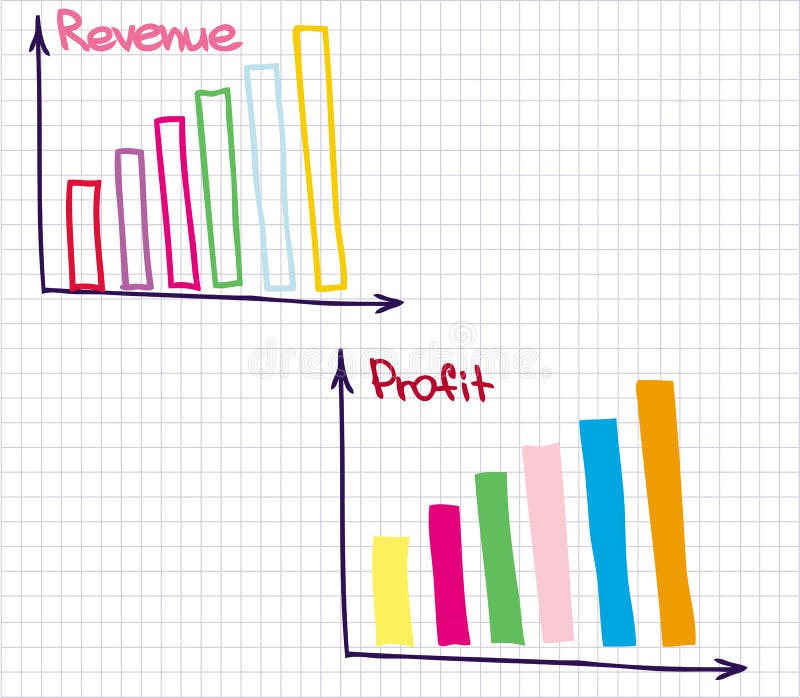
Free with trial Financial chart of revenue and loss. Diagram financial growth decrease vectors Profit Revenue Chart. Financial chart of revenue and loss