Free with trial Minimalist icon of a falling bar chart showing a negative market trend. Graphic showing decrease vectors Negative market trend shown on graph with falling bar chart. Minimalist icon of a falling bar chart showing a negative market trend
Free with trial Illustration shows a man in blue shirt and brown pants with a large red downward arrow symbolizing decline or failure. The mood is somber. Generative AI. Graphic showing decrease vectors Man with downward arrow showing decline or failure in blue and brown clothes vector illustration. Illustration shows a man in blue shirt and brown pants with a large red downward arrow symbolizing decline or failure. The mood is somber. Generative AI
Free with trial Move showing blue circle with white downward arrow icon on a white background. Graphic showing decrease illustrations Blue Circle with White Downward Arrow Icon on a White Background Keywords: arrow, down, download, direction, symbol, icon. Move showing blue circle with white downward arrow icon on a white background
Free with trial A digital graphic depicting a financial chart with two prominent line graphs. A blue line trends upward, representing a rising stock price, while a red line trends downward, indicating a decrease in trading volume. The chart is set against a faint, blurred city background, featuring a grid system on the vertical axis labeled 'Volume' and a horizontal axis labeled 'Time', with a red arrow at the. Graphic showing decrease illustrations A financial line chart showing the inverse relationship between stock price and trading volume data. A digital graphic depicting a financial chart with two prominent line graphs. A blue line trends upward, representing a rising stock price, while a red line trends downward, indicating a decrease in trading volume. The chart is set against a faint, blurred city background, featuring a grid system on the vertical axis labeled 'Volume' and a horizontal axis labeled 'Time', with a red arrow at the
Free with trial Conceptual image showing a declining financial graph on a hand, symbolizing business economy crisis, investment loss, or market crash. It represents negative growth and economic downturn. Graphic showing decrease illustrations Declining financial graph on hand concept for business economy crisis or investment loss and market crash. conceptual image showing a declining financial graph on a hand, symbolizing business economy crisis, investment loss, or market crash. It represents negative growth and economic downturn.
Free with trial Abstract vector showing price decreasing and investment increasing, using blue lines and pink accents. Simple composition, balanced for illustrative purposes. Graphic showing decrease vectors Abstract visual illustrating price reduction, investment, and financial dynamics on a black background. Abstract vector showing price decreasing and investment increasing, using blue lines and pink accents. Simple composition, balanced for illustrative purposes.
Free with trial Collection of black vector icons featuring downward trending charts, magnifying glass over bar graph, document reports, and computer screen data analysis symbols representing financial decline and analytics. Generative AI. Graphic showing decrease vectors Black icons set showing downward trending graphs analysis with document reports magnifying glass and data visualization. Collection of black vector icons featuring downward trending charts, magnifying glass over bar graph, document reports, and computer screen data analysis symbols representing financial decline and analytics. Generative AI
Free with trial Square showing 3d icon of a white downward pointing arrow on a rounded orange square background. Graphic showing decrease illustrations 3D icon of a white downward pointing arrow on a rounded orange square background Keywords: arrow, icon, symbol, download, down. Square showing 3d icon of a white downward pointing arrow on a rounded orange square background
Free with trial Outdoor thermometer weather measurement low temperature heat indicator outdoor, forecast, cool, minus, negative, climate. Graphic showing decrease vectors Thermometer showing 18.5 degrees Celsius with downward arrow indicating cold temperature and decrease concept. Outdoor thermometer weather measurement low temperature heat indicator outdoor, forecast, cool, minus, negative, climate
Free with trial Weather thermometer cold climate temperature reading decrease symbol freezing frost, outdoor,. Graphic showing decrease vectors Red and white thermometer with blue downward arrow showing low temperature for cold weather or freezing point. Weather thermometer cold climate temperature reading decrease symbol freezing frost, outdoor,
Free with trial Financial report with a declining bar graph, suggesting a negative trend in business performance. Graphic showing decrease vectors Financial report showing declining bar graph and statistics. Financial report with a declining bar graph, suggesting a negative trend in business performance
Free with trial Line drawing of a dollar coin and a down arrow symbolizing a financial crisis. Graphic showing decrease illustrations Dollar coin decreasing showing money crisis icon vector outline. Line drawing of a dollar coin and a down arrow symbolizing a financial crisis
Free with trial A graphic illustration depicting the fluctuating value of digital currency, shown with a price performance chart and coins. this visual represents market ups and downs and financial trends. Graphic showing decrease vectors Stylized illustration showing digital currency market volatility and virtual coin price trends on financial growth chart. a graphic illustration depicting the fluctuating value of digital currency, shown with a price performance chart and coins. this visual represents market ups and downs and financial trends
Free with trial A conceptual illustration featuring a red downward trend arrow pointing over stacks of gold coins that decrease in height to symbolize financial crisis, economic recession, market loss, and decreasing business profits or investment value. Graphic showing decrease vectors A red downward arrow showing a financial downturn with stacks of gold coins decreasing in value to represent economic loss. A conceptual illustration featuring a. A conceptual illustration featuring a red downward trend arrow pointing over stacks of gold coins that decrease in height to symbolize financial crisis, economic recession, market loss, and decreasing business profits or investment value
Free with trial Speech bubble with a decreasing interest rate percentage symbol, discussing the economy and finance. Graphic showing decrease illustrations Speech bubble showing decreasing interest rate with percentage symbol overlaid. Speech bubble with a decreasing interest rate percentage symbol, discussing the economy and finance
Free with trial Graph depicting 3D line and bar data visualization in red, white background, financial trends concept. Graphic showing decrease illustrations Graph showing 3D line and bar data visualization in red, white background, financial trends concept
Free with trial Interest growth icon vector logo set collection for web app ui. Graphic showing decrease vectors Interest Growth Icon Showing Financial Increase, Investment Success, and Economic Trends. Interest growth icon vector logo set collection for web app ui
Free with trial Line art vector icon of a hand holding a dollar coin with three arrows pointing down, symbolizing economic decline. Graphic showing decrease vectors Businessman hand holding dollar coin with three arrows pointing down showing economic crisis. Line art vector icon of a hand holding a dollar coin with three arrows pointing down, symbolizing economic decline
Free with trial Three red computer keyboard buttons displaying volume settings from muted to loud, ideal for explaining audio levels. 3D render. Graphic showing decrease illustrations Three red buttons showing volume settings on white background. Three red computer keyboard buttons displaying volume settings from muted to loud, ideal for explaining audio levels. 3D render
Free with trial Abstract graphical representation of data trends, likely showing increases and decreases. The design is composed of a network of connecting points and lines, with a pattern of various shades of gray, white, and red. The texture suggests a digital or technological origin, with a soft focus on the visual elements. The format is suitable for commercial or editorial purposes related to technology,. Graphic showing decrease illustrations Abstract data graph visualization. Abstract graphical representation of data trends, likely showing increases and decreases. The design is composed of a network of connecting points and lines, with a pattern of various shades of gray, white, and red. The texture suggests a digital or technological origin, with a soft focus on the visual elements. The format is suitable for commercial or editorial purposes related to technology,
Free with trial Stacks of gold coins decreasing with a red down arrow, representing economic crisis. Graphic showing decrease vectors Stacks of gold coins decreasing showing economic crisis. Stacks of gold coins decreasing with a red down arrow, representing economic crisis
Free with trial Gold coin with a dollar sign is next to a red arrow pointing down, representing economic decline. Graphic showing decrease illustrations Dollar coin value decreasing showing financial crisis. Gold coin with a dollar sign is next to a red arrow pointing down, representing economic decline
Free with trial Broken circle arrow chart is representing negative growth and failure to meet targets. Graphic showing decrease illustrations Broken circle arrow chart showing negative growth data. Broken circle arrow chart is representing negative growth and failure to meet targets
Free with trial Line icon illustration representing a global wheat crisis with a downward arrow symbolizing decreasing production. Graphic showing decrease illustrations Global wheat crisis icon showing decreasing production. Line icon illustration representing a global wheat crisis with a downward arrow symbolizing decreasing production
Free with trial A simple black and white graphic depicts a bar chart with decreasing bars and a downward trending arrow, indicating a decline. Graphic showing decrease illustrations Bar chart showing downward trend and arrow. A simple black and white graphic depicts a bar chart with decreasing bars and a downward trending arrow, indicating a decline
Free with trial Black and white icon depicting a global wheat crisis with a downward arrow symbolizing decreasing food supply. Graphic showing decrease illustrations Global wheat crisis icon showing decreasing food supply. Black and white icon depicting a global wheat crisis with a downward arrow symbolizing decreasing food supply
Free with trial Yellow briefcase showing loss of capital with three red downward arrows and long shadow. Graphic showing decrease vectors Yellow briefcase losing money with three downward arrows. Yellow briefcase showing loss of capital with three red downward arrows and long shadow
Free with trial Simple vector icon of a thermometer with the mercury level decreasing. Graphic showing decrease illustrations Thermometer showing decreasing temperature icon. Simple vector icon of a thermometer with the mercury level decreasing
Free with trial Business growth presentation with charts and graphs showing progress, statistics, and performance. The image showcases key financial indicators in a clear, concise format. Graphic showing decrease vectors Financial Data Analysis Report on Screen Display. Business growth presentation with charts and graphs showing progress, statistics, and performance. The image showcases key financial indicators in a clear, concise format.
Free with trial A clean, flat design illustration featuring a collection of icons related to social media engagement and data analysis. The set includes a pie chart, bar graphs showing upward trends, a line graph with a heart icon and an upward arrow, another line graph with data points, a speech bubble with the word 'LIKE' and abstract shapes, and a thumbs-up icon with a notification count. These graphics are ideal for representing concepts like growth, popularity, analytics, and user feedback in digital marketing, business reports, and web design. Graphic showing decrease illustrations Social Media Metrics and Data Visualization Icons. A clean, flat design illustration featuring a collection of icons related to social media engagement and data analysis. The set includes a pie chart, bar graphs showing upward trends, a line graph with a heart icon and an upward arrow, another line graph with data points, a speech bubble with the word 'LIKE' and abstract shapes, and a thumbs-up icon with a notification count. These graphics are ideal for representing concepts like growth, popularity, analytics, and user feedback in digital marketing, business reports, and web design.
Free with trial Simple black and white icon showing the exchange rate of bitcoin cryptocurrency increasing while the value of the dollar is decreasing. Graphic showing decrease vectors Bitcoin cryptocurrency increasing while dollar decreasing icon. Simple black and white icon showing the exchange rate of bitcoin cryptocurrency increasing while the value of the dollar is decreasing
Free with trial An abstract, three-dimensional white graph line is depicted against a stark white background. The line features sharp, jagged peaks and valleys, clearly illustrating a significant downward trend or decline. The geometric form casts a subtle shadow, adding depth to the minimalist composition. This visual represents concepts of loss, negative performance, or economic downturn. Graphic showing decrease illustrations Abstract 3D White Graph Line Showing Downward Trend on White Background chart data. An abstract, three-dimensional white graph line is depicted against a stark white background. The line features sharp, jagged peaks and valleys, clearly illustrating a significant downward trend or decline. The geometric form casts a subtle shadow, adding depth to the minimalist composition. This visual represents concepts of loss, negative performance, or economic downturn
Free with trial A vector illustration showing a magnifying glass focused on a bar graph and line chart indicating growth. The magnifying glass has a blue frame and red handle. The chart depicts an upward trend, suggesting positive business performance. This image is suitable for illustrating data analysis, business strategy, market research, and financial growth concepts. Graphic showing decrease vectors Analyzing Growth: Magnifying Glass on Business Chart. A vector illustration showing a magnifying glass focused on a bar graph and line chart indicating growth. The magnifying glass has a blue frame and red handle. The chart depicts an upward trend, suggesting positive business performance. This image is suitable for illustrating data analysis, business strategy, market research, and financial growth concepts.
Free with trial Two circular icons representing plus and minus signs, a basic mathematical concept. Graphic showing decrease vectors A simple illustration showing two black circles one with a plus and one. Two circular icons representing plus and minus signs, a basic mathematical concept.
Free with trial Data graph with warning sign indicating a significant stock market decline. The image visually represents a sudden drop in market value. Graphic showing decrease vectors Urgent Important Data Graph Showing Stock Market Drop. Data graph with warning sign indicating a significant stock market decline. The image visually represents a sudden drop in market value.
Free with trial Decreasing line graph showing a negative trend, perfect for illustrating economic downturn or market decline. Graphic showing decrease vectors Downward Trend Graph, Financial Crisis Icon Illustration. Decreasing line graph showing a negative trend, perfect for illustrating economic downturn or market decline.
Free with trial Line art style icon of a smartphone displaying a decreasing graph, representing negative market trends. Graphic showing decrease vectors Smartphone showing decreasing graph icon outline vector. Line art style icon of a smartphone displaying a decreasing graph, representing negative market trends
Free with trial This icon represents the concept of compressing, condensing, or applying downward pressure. Graphic showing decrease illustrations Three arrows pointing down to three horizontal lines showing compressing concept. This icon represents the concept of compressing, condensing, or applying downward pressure
Free with trial This 3D illustration shows a colorful bar graph with pastel-colored cylinders on a white circular base, representing upward business growth trends. The chart includes a line graph illustrating various data points. Graphic showing decrease illustrations 3D Colorful Cylindrical Bar Graph Chart Showing Business Growth. This 3D illustration shows a colorful bar graph with pastel-colored cylinders on a white circular base, representing upward business growth trends. The chart includes a line graph illustrating various data points.
Free with trial Financial concept image featuring a blue bar chart with a red downward arrow, illustrating decline, recession, or loss over time. Ideal for presentations, reports, infographics, economic forecasts, and business documentation. Clean, clear, and professional visual, created ai. Graphic showing decrease illustrations Business bar chart showing financial decline with downward arrow. Financial concept image featuring a blue bar chart with a red downward arrow, illustrating decline, recession, or loss over time. Ideal for presentations, reports, infographics, economic forecasts, and business documentation. Clean, clear, and professional visual, created ai.
Free with trial Financial crisis, economic downturn, stock market crash, recession, decreasing profits, falling revenue, business loss, investment loss, financial instability, economic decline, money loss. Graphic showing decrease vectors Falling Stock Market Graph Showing Financial Crisis and Recession. Financial crisis, economic downturn, stock market crash, recession, decreasing profits, falling revenue, business loss, investment loss, financial instability, economic decline, money loss.
Free with trial A conceptual infographic visually representing the economic trend of rising prices contrasted with falling income, depicted by upward and downward arrows. Graphic showing decrease illustrations Infographic showing rising prices and falling income. A conceptual infographic visually representing the economic trend of rising prices contrasted with falling income, depicted by upward and downward arrows.
Free with trial A hand holds a glass globe showing CO2 reduction, surrounded by icons representing environmental solutions and. Graphic showing decrease illustrations Hand holding a glass globe with C O2 reduction icons around it earth. A hand holds a glass globe showing CO2 reduction, surrounded by icons representing environmental solutions and
Free with trial This image shows a calculator next to colorful 3D bar charts and pie charts illustrating business growth and financial success. The vibrant colors and upward-trending graph create a visually appealing representation of positive financial results. Graphic showing decrease illustrations Colorful Calculator and 3D Charts Showing Business Growth. This image shows a calculator next to colorful 3D bar charts and pie charts illustrating business growth and financial success. The vibrant colors and upward-trending graph create a visually appealing representation of positive financial results.
Free with trial A 3D bar chart with red and green bars representing financial data trends, isolated on white background. Graphic showing decrease illustrations 3d bar chart showing financial data trends isolated on white background. A 3D bar chart with red and green bars representing financial data trends, isolated on white background
Free with trial A stark visual representing a business decline, featuring a silhouetted businessman standing beside a bar graph showing a sharp downward trend indicated by a red arrow. Graphic showing decrease illustrations Business downturn graphic with silhouetted businessman and falling arrow. A stark visual representing a business decline, featuring a silhouetted businessman standing beside a bar graph showing a sharp downward trend indicated by a red arrow
Free with trial A circle composed of black and blue lines progressively shrinks in size. Small black droplets float away from the edge, suggesting deflation or loss of air. Graphic showing decrease illustrations Deflating circle illustration showing a full circle shrinking with air coming out. A circle composed of black and blue lines progressively shrinks in size. Small black droplets float away from the edge, suggesting deflation or loss of air
Free with trial Business portfolio with three arrows pointing down, representing a decrease in value or career prospects. Graphic showing decrease vectors Portfolio under pressure falling business icon showing decreasing career opportunities. Business portfolio with three arrows pointing down, representing a decrease in value or career prospects
Free with trial Colorful isometric bar chart showing business data and growth with bars of different height, colored blue, yellow and green. Isolated on a transparent background, perfect for business presentations or infographics. Graphic showing decrease vectors Colorful business chart illustration on transparent background AI Generated. Colorful isometric bar chart showing business data and growth with bars of different height, colored blue, yellow and green. Isolated on a transparent background, perfect for business presentations or infographics.
Free with trial Modern digital illustration showing a glowing neon 'Margin Call' alert over financial charts and data analytics interface, symbolizing trading loss and market downturn. Graphic showing decrease illustrations Margin Call Concept with Stock Market Chart and Financial Data Visualization. Modern digital illustration showing a glowing neon 'Margin Call' alert over financial charts and data analytics interface, symbolizing trading loss and market downturn.
Free with trial An illustration of a stylized, downward-pointing arrow zig-zagging across a pale yellow surface. The arrow conveys a sense of decline, loss, or reduction. Simplistic design is suitable for presentations, infographics, or website design needing a visual representation of negative trends. Graphic showing decrease illustrations Downward arrow illustration showing market trend zigzag decline and recession. An illustration of a stylized, downward-pointing arrow zig-zagging across a pale yellow surface. The arrow conveys a sense of decline, loss, or reduction. Simplistic design is suitable for presentations, infographics, or website design needing a visual representation of negative trends
Free with trial A simple vector illustration of a graph showing a sharp downward trend, representing a financial crisis or market decline. Perfect for illustrating economic downturn concepts. Graphic showing decrease vectors Trending Downward Graph Financial Crisis Icon Stock Market Decline Illustration. A simple vector illustration of a graph showing a sharp downward trend, representing a financial crisis or market decline. Perfect for illustrating economic downturn concepts.
Free with trial This 3D rendering showcases a vibrant bar chart illustrating business growth and financial performance. The colorful cylinders represent data points, rising to show increasing success. A line graph adds additional information about trends over time. Graphic showing decrease illustrations Colorful 3D Bar Chart with Growth Graph Showing Business Success and Financial Data. This 3D rendering showcases a vibrant bar chart illustrating business growth and financial performance. The colorful cylinders represent data points, rising to show increasing success. A line graph adds additional information about trends over time.
Free with trial Close-up of a hand holding a blue volume slider with a speaker icon, showing audio control and adjustment for sound levels. Graphic showing decrease illustrations Hand adjusting volume slider with sound waves, symbolizing audio control and settings. Close-up of a hand holding a blue volume slider with a speaker icon, showing audio control and adjustment for sound levels
Free with trial Illustration shows a stock market decline with candlestick charts and downward trending arrow. The design features a light blue background and a simple layout. Useful for financial articles, reports, or any material illustrating loss, recession, or negative trends in commercial sector. Graphic showing decrease illustrations Falling stock market chart showing economic downturn and financial loss. Illustration shows a stock market decline with candlestick charts and downward trending arrow. The design features a light blue background and a simple layout. Useful for financial articles, reports, or any material illustrating loss, recession, or negative trends in commercial sector
Free with trial Simple showing black magnifying glass icon with a minus sign indicating zoom out functionality. Graphic showing decrease illustrations Black Magnifying Glass Icon with a Minus Sign Indicating Zoom Out Functionality Keywords: magnifying glass, zoom out, minus sign. Simple showing black magnifying glass icon with a minus sign indicating zoom out functionality
Free with trial This 3D rendered image showcases three distinct icons on a white background. At the top is a blue marker pen. Below it are two magnifying glasses: one displaying a red plus symbol, indicating zoom in or add, and the other showing a red minus symbol, signifying zoom out or subtract. The icons are clean and stylized, suitable for digital interfaces or educational materials. Graphic showing decrease illustrations 3D Rendered Icons of a Blue Marker Pen, Magnifying Glass with Plus Symbol, and Magnifying Glass with Minus Symbol on a White. This 3D rendered image showcases three distinct icons on a white background. At the top is a blue marker pen. Below it are two magnifying glasses: one displaying a red plus symbol, indicating zoom in or add, and the other showing a red minus symbol, signifying zoom out or subtract. The icons are clean and stylized, suitable for digital interfaces or educational materials
Free with trial This vibrant 3D bar chart illustrates upward trending data, perfect for presentations or reports on financial growth, market analysis, or business success. The colorful blocks represent different data points. Graphic showing decrease illustrations Colorful 3D Bar Chart Showing Business Growth and Success. This vibrant 3D bar chart illustrates upward trending data, perfect for presentations or reports on financial growth, market analysis, or business success. The colorful blocks represent different data points.
Free with trial Sign showing black magnifying glass icon with minus sign on white background. Graphic showing decrease illustrations Black Magnifying Glass Icon with Minus Sign on White Background Keywords: magnifying glass, zoom out, minus, negative, search. Sign showing black magnifying glass icon with minus sign on white background
Free with trial Blue showing 3d blue downward arrow icon on a white background. Graphic showing decrease illustrations 3D Blue Downward Arrow Icon on a White Background Keywords: arrow, down, downward, direction, move, navigation, download, reduce. Blue showing 3d blue downward arrow icon on a white background
Free with trial Icon showing 3d rendered blue downward arrow icon with subtle shadow on white background. Graphic showing decrease illustrations 3D Rendered Blue Downward Arrow Icon with Subtle Shadow on White Background Keywords: arrow, down, direction, symbol, icon, blue. Icon showing 3d rendered blue downward arrow icon with subtle shadow on white background
Free with trial A 3D representation of a document displaying a bar chart and a dotted line graph, indicating data trends and analysis. A small, rounded icon featuring a landscape with mountains and a sun is placed ab. Graphic showing decrease illustrations 3d infographic showing a document with a bar chart and line graph, alongside a small image icon, isolated on white background. A 3D representation of a document displaying a bar chart and a dotted line graph, indicating data trends and analysis. A small, rounded icon featuring a landscape with mountains and a sun is placed ab
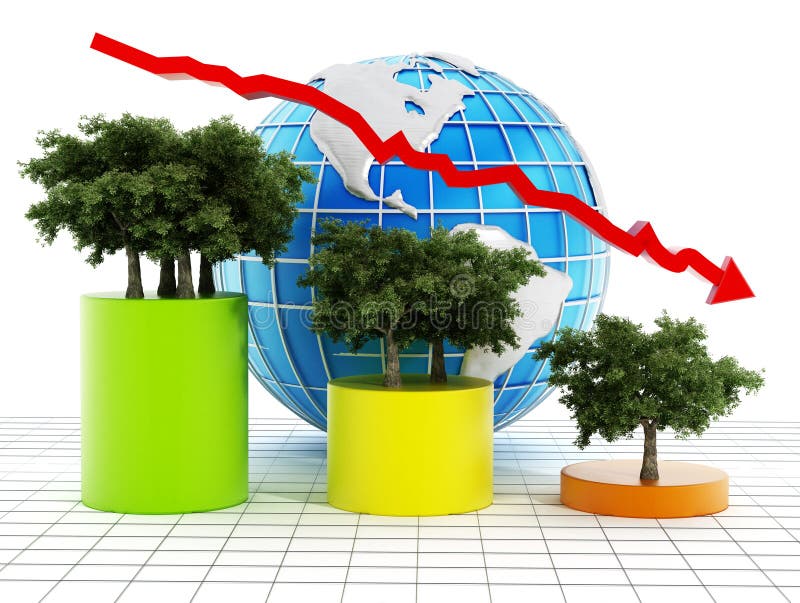
Free with trial Graphic with showing the decrease of tree population on earth. Graphic showing decrease illustrations Graphic showing the decrease of tree population on earth.
Free with trial Illustration showing in LED type graphic with words corona written in red and a downward arrow to show decrease in corona cases. Graphic showing decrease illustrations Illustration showing LED type graphic to depict decrease in corona cases. Illustration showing in LED type graphic with words corona written in red and a downward arrow to show decrease in corona cases
Free with trial Graph showing decrease of ethereum coin value. Cryptocurrency decline graph in vector. Graphic showing decrease illustrations Graph showing decrease of ethereum coin value
Free with trial Arrows, decrease or graphic sign for increase, synergy or icon for growth isolated on white background in studio. Change, action or color design for direction with reverse or different repeat pattern. Graphic showing decrease illustrations Arrows, decrease or graphic sign for increase, synergy or icon for growth isolated on white background in studio. Change
Free with trial Downward trend graphic table. Graphic table. Sketch-like table showing a downward trend or decrease or reduction. Linear sketch like graphictable. Vectorised digitally handdrawn illustration. Black and White illustration. Graphic showing decrease illustrations High to Low graphic table. Downward trend graphic table. Graphic table. Sketch-like table showing a downward trend or decrease or reduction. Linear sketch like graphictable. Vectorised digitally handdrawn illustration. Black and White illustration.
Free with trial Oil price golden design with line graph showing decrease in oil price. Vector illustration. Graphic showing decrease vectors Line graph showing decrease in oil price
Free with trial Concept image showing the increase and decrease in the value of the Turkish lira. Graphic showing decrease vectors Concept image showing the increase and decrease in the value of the Turkish lira
Free with trial Global economic and Financial crisis graphic concept. Decreasing graph, showing bad statistics on dark red background. Graphic showing decrease vectors Global economic and Financial crisis graphic concept
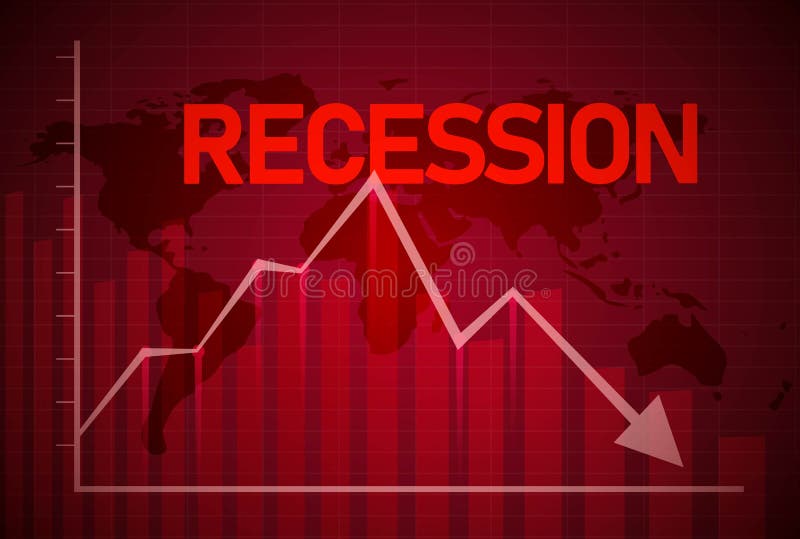
Free with trial Recession background worldwide. Graph showing decrease in recession headline design illustration concept vector. Graphic showing decrease vectors Recession background worldwide. Graph showing decrease in recession headline
Free with trial Graph showing sudden decrease with word panic after long growth. Fear, financial crisis, recession and investment concept. Flat design. EPS 8 vector illustration, no transparency, no gradients. Graphic showing decrease vectors Graph, panic decrease, growth. Graph showing sudden decrease with word panic after long growth. Fear, financial crisis, recession and investment concept. Flat design. EPS 8 vector illustration, no transparency, no gradients
Free with trial Flat hand showing the phone with bitcoin graph going down. Graphic showing decrease illustrations Flat hand showing phone with bitcoin graph going down
Free with trial Flat hand showing phone with bitcoin graph going down. Graphic showing decrease vectors Hand showing phone with bitcoin graph going down
Free with trial Coronavirus. Covid19 chart. Infection bar graph. Vector illustration showing decrease in positive cases for the epidemic. Graphic showing decrease vectors Coronavirus. Infection decrease bar chart. Covid19 graph. Coronavirus. Covid19 chart. Infection bar graph. Vector illustration showing decrease in positive cases for the epidemic.
Free with trial Stat bars and falling arrow showing a downward trend. 3D illustration. Graphic showing decrease illustrations Stat bars and falling arrow showing a downward trend. 3D illustration
Free with trial Silhouette of a man with the different sizes clouds above his head. Two clouds contains a blue graph indicating economic growth The red graph in a grid is showing the economic decrease. All is on a blue gradient background. Graphic showing decrease vectors Economy decrease concept with grid. Silhouette of a man with the different sizes clouds above his head. Two clouds contains a blue graph indicating economic growth The red graph in a grid is showing the economic decrease. All is on a blue gradient background.
Free with trial Economic crisis isometric vector illustration - business analysis graphic with falling trend on mobile phone. Broken red arrow and coin showing fall of economy, financial and banking indicators. Graphic showing decrease vectors Economic crisis isometric vector illustration - business analysis graphic with falling trend on mobile phone.
Free with trial Small place icon showing that the factory is vector work. Graphic showing decrease vectors Small place icon showing that the factory is
Free with trial The fall of bitcoin showing in colourful graph with icon. Bitcoin currency symbol with down arrow illustration. Graphic showing decrease illustrations The fall of bitcoin showing in colourful graph with icon.