Free with trial Dot plot, Air balloon and Pyramid chart icons simple set. Comparison table. Financial documents sign. Presentation graph, Sky travelling, Report analysis. Check docs. Education set. Vector. Infographic financial growth decrease vectors Dot plot, Air balloon and Pyramid chart icons set. Financial documents sign. Vector. Dot plot, Air balloon and Pyramid chart icons simple set. Comparison table. Financial documents sign. Presentation graph, Sky travelling, Report analysis. Check docs. Education set. Vector
Free with trial Set line Search cloud computing Data analysis data Browser with exclamation mark Coal mine trolley Sales funnel chart and Financial growth decrease icon. Vector. Infographic financial growth decrease vectors Set line Search cloud computing, Data analysis, data, Browser with exclamation mark, Coal mine trolley, Sales funnel. Set line Search cloud computing Data analysis data Browser with exclamation mark Coal mine trolley Sales funnel chart and Financial growth decrease icon. Vector.
Free with trial Decrease graph 3d icon model cartoon style concept. render illustrations. Infographic financial growth decrease illustrations Decrease graph 3d icon model cartoon style concept. render illustration
Free with trial Calendar, Report diagram and Presentation board icons simple set. Comparison table. Smartphone statistics sign. Event reminder, Financial market, Growth chart. Mobile business. Education set. Vector. Infographic financial growth decrease vectors Calendar, Report diagram and Presentation board icons set. Smartphone statistics sign. Vector. Calendar, Report diagram and Presentation board icons simple set. Comparison table. Smartphone statistics sign. Event reminder, Financial market, Growth chart. Mobile business. Education set. Vector
Free with trial Set Server security with padlock Mind map infographic Search cloud computing Sales funnel chart Document Pie Cloud and data analysis icon. Vector. Infographic financial growth decrease illustrations Set Server security with padlock, Mind map infographic, Search cloud computing, Sales funnel chart, Document, Pie, Cloud. Set Server security with padlock Mind map infographic Search cloud computing Sales funnel chart Document Pie Cloud and data analysis icon. Vector.
Free with trial Bitcoin pay, Payment received and Pay money signs. Infographic timeline. Bitcoin think, Payment and Analytics graph line icons set. Cryptocurrency head, Finance, Growth report. Vector. Infographic financial growth decrease vectors Bitcoin think, Payment and Analytics graph icons set. Bitcoin pay, Payment received and Pay money signs. Vector. Bitcoin pay, Payment received and Pay money signs. Infographic timeline. Bitcoin think, Payment and Analytics graph line icons set. Cryptocurrency head, Finance, Growth report. Vector
Free with trial Set Calculator Data analysis Browser with exclamation mark Cloud computing lock Document graph chart Mind map infographic Search globe and Financial growth icon. Vector. Infographic financial growth decrease vectors Set Calculator, Data analysis, Browser with exclamation mark, Cloud computing lock, Document graph chart, Mind map. Set Calculator Data analysis Browser with exclamation mark Cloud computing lock Document graph chart Mind map infographic Search globe and Financial growth icon. Vector.
Free with trial Hand Drawn Graphic Chart Showing Initial Growth then Downward Trend to Final State Illustrating Business Cycle. Infographic financial growth decrease vectors Hand Drawn Graphic Chart Showing Initial Growth then Downward Trend to Final State Illustrating Business Cycle
Free with trial Statistics timer, Dj controller and Education line icons set. Infographic chart, financial data graphic. Augmented reality sign. Growth chart, Musical device, Instruction book. Virtual reality. Vector. Infographic financial growth decrease vectors Statistics timer, Dj controller and Education icons set. Augmented reality sign. Vector. Statistics timer, Dj controller and Education line icons set. Infographic chart, financial data graphic. Augmented reality sign. Growth chart, Musical device, Instruction book. Virtual reality. Vector
Free with trial Growth with georgia flag on blue background. Infographic financial growth decrease illustrations Growth with georgia flag on blue
Free with trial Set line Pie chart infographic Data analysis Search cloud computing Server security with padlock Browser stocks market and Coal mine trolley icon. Vector. Infographic financial growth decrease vectors Set line Pie chart infographic, Data analysis, Search cloud computing, Server security with padlock, Browser stocks. Set line Pie chart infographic Data analysis Search cloud computing Server security with padlock Browser stocks market and Coal mine trolley icon. Vector.
Free with trial This vibrant bar chart infographic is a powerful tool for communicating complex data in a clear and engaging way. Ideal for business presentations, reports, and marketing materials, this visually appealing design highlights key performance indicators and trends. The clean, modern aesthetic ensures your message stands out, while the colorful bars and clear labels make understanding the statistics. Infographic financial growth decrease illustrations Colorful Bar Chart Infographic Diagram A Modern Effective Data Visualization Template for Business Presentations. This vibrant bar chart infographic is a powerful tool for communicating complex data in a clear and engaging way. Ideal for business presentations, reports, and marketing materials, this visually appealing design highlights key performance indicators and trends. The clean, modern aesthetic ensures your message stands out, while the colorful bars and clear labels make understanding the statistics
Free with trial Set line Project team base Old hourglass with sand Arrow Delivery tracking Graph chart diagram Shopping bag Sale Clock and Financial growth decrease icon. Vector. Infographic financial growth decrease vectors Set line Project team base, Old hourglass with sand, Arrow, Delivery tracking, Graph, chart, diagram, Shopping bag Sale. Set line Project team base Old hourglass with sand Arrow Delivery tracking Graph chart diagram Shopping bag Sale Clock and Financial growth decrease icon. Vector.
Free with trial Arrows of growth and fall icon. Element of finance illustration. Premium quality graphic design icon. Signs and symbols collection icon for websites, web design, mobile app on white background. Infographic financial growth decrease illustrations Arrows of growth and fall icon. Element of finance illustration. Premium quality graphic design icon. Signs and symbols collection
Free with trial Vector icon infographic, chart isometric. 3d sign isolated on white background. eps. Infographic financial growth decrease illustrations Vector icon infographic, chart isometric. 3d sign isolated on white background. eps
Free with trial Vector icon infographic, chart isometric. 3d sign isolated on white background. eps. Infographic financial growth decrease illustrations Vector icon infographic, chart isometric. 3d sign isolated on white background. eps
Free with trial Vector icon infographic, chart isometric. 3d sign isolated on white background. eps. Infographic financial growth decrease illustrations Vector icon infographic, chart isometric. 3d sign isolated on white background. eps
Free with trial Vector icon infographic, chart isometric. 3d sign isolated on white background. eps. Infographic financial growth decrease illustrations Vector icon infographic, chart isometric. 3d sign isolated on white background. eps
Free with trial Calendar, Report diagram and Presentation board icons simple set. Infographic timeline. Smartphone statistics sign. Event reminder, Financial market, Growth chart. Mobile business. Vector. Infographic financial growth decrease vectors Calendar, Report diagram and Presentation board icons set. Smartphone statistics sign. Vector. Calendar, Report diagram and Presentation board icons simple set. Infographic timeline. Smartphone statistics sign. Event reminder, Financial market, Growth chart. Mobile business. Vector
Free with trial Chart line set. Graph, finance report, income growth, economy statistic, diagram, infographic, mind map, data visualization vector illustration. Outline signs of analytic. Editable Stroke. Infographic financial growth decrease vectors Analytical graphic chart with trend lines, columns set hand drawn ink sketch. Change in time of election results or income, plans. Chart line set. Graph, finance report, income growth, economy statistic, diagram, infographic, mind map, data visualization vector illustration. Outline signs of analytic. Editable Stroke
Free with trial Loan percent, Report document and Graph laptop icons simple set. Comparison table. Hot loan sign. Discount, Growth chart, Mobile report. Discount offer. Finance set. Pricing plan. Vector. Infographic financial growth decrease vectors Loan percent, Report document and Graph laptop icons set. Hot loan sign. Discount, Growth chart, Mobile report. Vector. Loan percent, Report document and Graph laptop icons simple set. Comparison table. Hot loan sign. Discount, Growth chart, Mobile report. Discount offer. Finance set. Pricing plan. Vector
Free with trial Calculator target, Report document and Financial diagram icons simple set. Infographic timeline. Creative painting sign. Audit, Growth chart, Candlestick chart. Graphic art. Education set. Vector. Infographic financial growth decrease vectors Calculator target, Report document and Financial diagram icons set. Creative painting sign. Vector. Calculator target, Report document and Financial diagram icons simple set. Infographic timeline. Creative painting sign. Audit, Growth chart, Candlestick chart. Graphic art. Education set. Vector
Free with trial Medical syringe, Report timer and Sunny weather line icons set. Infographic chart, financial data graphic. Timer sign. Vaccination, Growth chart, Sun. Deadline management. Science set. Vector. Infographic financial growth decrease vectors Medical syringe, Report timer and Sunny weather icons set. Timer sign. Vaccination, Growth chart, Sun. Vector. Medical syringe, Report timer and Sunny weather line icons set. Infographic chart, financial data graphic. Timer sign. Vaccination, Growth chart, Sun. Deadline management. Science set. Vector
Free with trial Online survey, Timer and Report document line icons set. Infographic timeline. Histogram, Artificial intelligence and Keywords signs. Quiz test, Deadline management, Growth chart. Vector. Infographic financial growth decrease vectors Online survey, Timer and Report document icons set. Histogram, Artificial intelligence and Keywords signs. Vector. Online survey, Timer and Report document line icons set. Infographic timeline. Histogram, Artificial intelligence and Keywords signs. Quiz test, Deadline management, Growth chart. Vector
Free with trial Payment received, Cash and No internet icons simple set. Graph chart sign. Money, Banking currency, Bandwidth meter. Growth report. Business set. Infographic timeline. Line payment received icon. Infographic financial growth decrease vectors Payment received, Cash and No internet icons set. Graph chart sign. Money, Banking currency, Bandwidth meter. Vector. Payment received, Cash and No internet icons simple set. Graph chart sign. Money, Banking currency, Bandwidth meter. Growth report. Business set. Infographic timeline. Line payment received icon
Free with trial This AI-generated image depicts a calculator displaying "TAX-2025" alongside a bar graph, illustrating potential tax revenue projections for the year. The graph, generated by AI, shows a projected decrease in tax revenue over time. This visualization is helpful for financial planning and forecastin. Infographic financial growth decrease illustrations Tax Projections 2025. This AI-generated image depicts a calculator displaying "TAX-2025" alongside a bar graph, illustrating potential tax revenue projections for the year. The graph, generated by AI, shows a projected decrease in tax revenue over time. This visualization is helpful for financial planning and forecastin
Free with trial Businessman cartoon working little people with diagram. Vector illustration for business design and infographic. Infographic financial growth decrease vectors Cartoon working little people with diagram. Vector illustration for business design and infographic
Free with trial Creative vector illustration of revenue, profit, expenses diagram showing infographic isolated on transparent background. Art design business planning template. Abstract concept graphic element. Infographic financial growth decrease vectors Creative vector illustration of revenue, profit, expenses diagram showing infographic isolated on transparent background
Free with trial Creative vector illustration of revenue, profit, expenses diagram showing infographic isolated on transparent background. Art design business planning template. Abstract concept graphic element. Infographic financial growth decrease vectors Creative vector illustration of revenue, profit, expenses diagram showing infographic isolated on transparent background
Free with trial Green up and red down 3d arrow graph showing rising, descending trend, business result, profit or loss symbol symbol. Business arrow, goals concept. 3d world money symbols. Financial growth vector isolated. Infographic financial growth decrease vectors Green up and red down 3d arrow graph showing rising, descending trend, business result, profit. world money symbols. Green up and red down 3d arrow graph showing rising, descending trend, business result, profit or loss symbol symbol. Business arrow, goals concept. 3d world money symbols. Financial growth vector isolated
Free with trial Green up and red down 3d arrow graph showing rising, descending trend, business result, profit or loss symbol symbol. Business arrow, goals concept. 3d world money symbols. Financial growth vector isolated. Infographic financial growth decrease vectors Green up and red down 3d arrow graph showing rising, descending trend, business result, profit. world money symbols. Green up and red down 3d arrow graph showing rising, descending trend, business result, profit or loss symbol symbol. Business arrow, goals concept. 3d world money symbols. Financial growth vector isolated
Free with trial Green up and red down 3d arrow graph showing rising, descending trend, business result, profit or loss symbol symbol. Business arrow, goals concept. 3d world money symbols. Financial growth vector isolated. Infographic financial growth decrease vectors Green up and red down 3d arrow graph showing rising, descending trend, business result, profit. world money symbols. Green up and red down 3d arrow graph showing rising, descending trend, business result, profit or loss symbol symbol. Business arrow, goals concept. 3d world money symbols. Financial growth vector isolated
Free with trial Green up and red down 3d arrow graph showing rising, descending trend, business result, profit or loss symbol symbol. Business arrow, goals concept. 3d world money symbols. Financial growth vector isolated. Infographic financial growth decrease vectors Green up and red down 3d arrow graph showing rising, descending trend, business result, profit. world money symbols. Green up and red down 3d arrow graph showing rising, descending trend, business result, profit or loss symbol symbol. Business arrow, goals concept. 3d world money symbols. Financial growth vector isolated
Free with trial Green up and red down 3d arrow graph showing rising, descending trend, business result, profit or loss symbol symbol. Business arrow, goals concept. 3d world money symbols. Financial growth vector isolated. Infographic financial growth decrease vectors Green up and red down 3d arrow graph showing rising, descending trend, business result, profit. world money symbols. Green up and red down 3d arrow graph showing rising, descending trend, business result, profit or loss symbol symbol. Business arrow, goals concept. 3d world money symbols. Financial growth vector isolated
Free with trial Green up and red down 3d arrow graph showing rising, descending trend, business result, profit or loss symbol symbol. Business arrow, goals concept. 3d world money symbols. Financial growth vector isolated. Infographic financial growth decrease vectors Green up and red down 3d arrow graph showing rising, descending trend, business result, profit. world money symbols. Green up and red down 3d arrow graph showing rising, descending trend, business result, profit or loss symbol symbol. Business arrow, goals concept. 3d world money symbols. Financial growth vector isolated
Free with trial Falling Sales Chart with Arrow and Flag, Financial Decline Concept, Losses. Infographic financial growth decrease vectors Falling Sales Chart with Arrow and Flag, Financial Decline Concept, Losses
Free with trial Set line Percent up arrow, Mountains with flag, Light bulb, Pie chart infographic, Arrow, and icon. Vector. Infographic financial growth decrease illustrations Set line Percent up arrow, Mountains with flag, Light bulb, Pie chart infographic, Arrow, and icon. Vector
Free with trial An llustration 3D of a decrease on a graph with an arrow. Infographic financial growth decrease illustrations Illustration 3D of a decrease on a graph with an arrow
Free with trial Set chart graph icon positive, negative infographic, layered. Infographic financial growth decrease vectors Set chart graph positive, negative infographic. Set chart graph icon positive, negative infographic, layered.
Free with trial Chart of development and decrease of the activity in work of the company or market (red and green schedules). Infographic financial growth decrease illustrations Green schedule of growth and red - falling. Chart of development and decrease of the activity in work of the company or market (red and green schedules)
Free with trial Minimalist vector illustration showing a black diagram with a downward arrow symbolizing economic decline, financial loss, recession, or negative business performance. Clean and modern design isolated on a white background, ideal for business presentations, financial reports, infographics, websites, mobile apps, and marketing materials related to economics, finance, investment, and analytics. Infographic financial growth decrease vectors . Minimalist vector illustration showing a black diagram with a downward arrow symbolizing economic decline, financial loss, recession, or negative business performance. Clean and modern design isolated on a white background, ideal for business presentations, financial reports, infographics, websites, mobile apps, and marketing materials related to economics, finance, investment, and analytics.
Free with trial Shiny graph positive infographic icon. Isolated from background. Layered. Infographic financial growth decrease vectors Shiny graph positive infographic
Free with trial A minimalist, black and white vector illustration depicting a financial graph with a clear downward trend. The graph features a jagged line representing fluctuating data, leading into a bold, thick arrow pointing downwards and to the right. This icon symbolizes decline, loss, recession, or negative performance in various contexts, such as business, economics, or stock markets. Its clean design makes it versatile for presentations, websites, and infographics. Infographic financial growth decrease vectors Downward Trend Graph with Arrow Icon. A minimalist, black and white vector illustration depicting a financial graph with a clear downward trend. The graph features a jagged line representing fluctuating data, leading into a bold, thick arrow pointing downwards and to the right. This icon symbolizes decline, loss, recession, or negative performance in various contexts, such as business, economics, or stock markets. Its clean design makes it versatile for presentations, websites, and infographics.
Free with trial Futuristic Declining Bar Graph with Downward Arrow on Dark Blue Background, Business Loss and Negative Growth Concept. Infographic financial growth decrease vectors Business Loss and Negative Growth Concept
Free with trial Vibrant vector illustration featuring business data charts and graphs, including bar graphs, line graphs, pie charts, and a roller coaster metaphor for market trends. This eye-catching design is perfect for presentations, infographics, and financial reports. Infographic financial growth decrease illustrations Business Data Charts Graphs Vector Illustration, Statistics. Vibrant vector illustration featuring business data charts and graphs, including bar graphs, line graphs, pie charts, and a roller coaster metaphor for market trends. This eye-catching design is perfect for presentations, infographics, and financial reports.
Free with trial A vibrant graphic of a bar graph illustrating a downward trend, accented by a gear with a dollar sign, implying financial issues or market decline. Infographic financial growth decrease vectors Dollar rate decrease icon. Currency decrease icon. Dollar sign symbol, USD currency. A vibrant graphic of a bar graph illustrating a downward trend, accented by a gear with a dollar sign, implying financial issues or market decline.
Free with trial Business audit round composition with financial elements and icons in hand drawn style isolated vector illustration. Infographic financial growth decrease vectors Business Audit Round Composition
Free with trial Icon set depicting financial growth and decline with upward and downward arrows over bar charts, perfect for business analytics and presentations. Infographic financial growth decrease vectors Bar charts with curved arrows showing trends. Icon set depicting financial growth and decline with upward and downward arrows over bar charts, perfect for business analytics and presentations
Free with trial Wavy green arrows visualizing market movement, trend fluctuation, and economic volatility, depicting both growth and decline, ideal for financial data and business analytics concepts. Infographic financial growth decrease illustrations Wavy arrows showing up and down fluctuation trend. Wavy green arrows visualizing market movement, trend fluctuation, and economic volatility, depicting both growth and decline, ideal for financial data and business analytics concepts
Free with trial Downward Trend Line Graph Icons for Financial Data vol 34820. Infographic financial growth decrease vectors Downward Trend Line Graph Icons for Financial Data
Free with trial Circular percentage icon indicating a decrease or reduction, useful for financial concepts like interest rate changes, sales, discounts, and data analysis in business and economics. Infographic financial growth decrease vectors Decreasing percentage rate circular icon illustration. Circular percentage icon indicating a decrease or reduction, useful for financial concepts like interest rate changes, sales, discounts, and data analysis in business and economics
Free with trial A flat design vector illustration showing a graph with rising and falling bars, marked by green and red arrows indicating increase and decrease. Ideal for financial concepts. Infographic financial growth decrease vectors Bar chart showing positive and negative data trends. A flat design vector illustration showing a graph with rising and falling bars, marked by green and red arrows indicating increase and decrease. Ideal for financial concepts
Free with trial 3D graph going up and down with red arrows, blue bar chart icon vector, sales chart with 3D arrow down and arrow up, financial analytics symbol, EPS 10. Infographic financial growth decrease vectors 3D graph going up and down with red arrows, blue bar chart icon vector, sales chart symbol. 3D graph going up and down with red arrows, blue bar chart icon vector, sales chart with 3D arrow down and arrow up, financial analytics symbol, EPS 10
Free with trial A simplified flat style icon displays a declining bar graph with arrow. Focuses on business and financial themes. Infographic financial growth decrease vectors Flat icon illustration showing bar chart trending downwards. A simplified flat style icon displays a declining bar graph with arrow. Focuses on business and financial themes.
Free with trial Flat style illustration showcasing business financial data analysis via a magnifying glass and graph chart visualization, isolated on black. Infographic financial growth decrease vectors Analyzing Financial Data with Magnifying Glass and Graph Chart. Flat style illustration showcasing business financial data analysis via a magnifying glass and graph chart visualization, isolated on black.
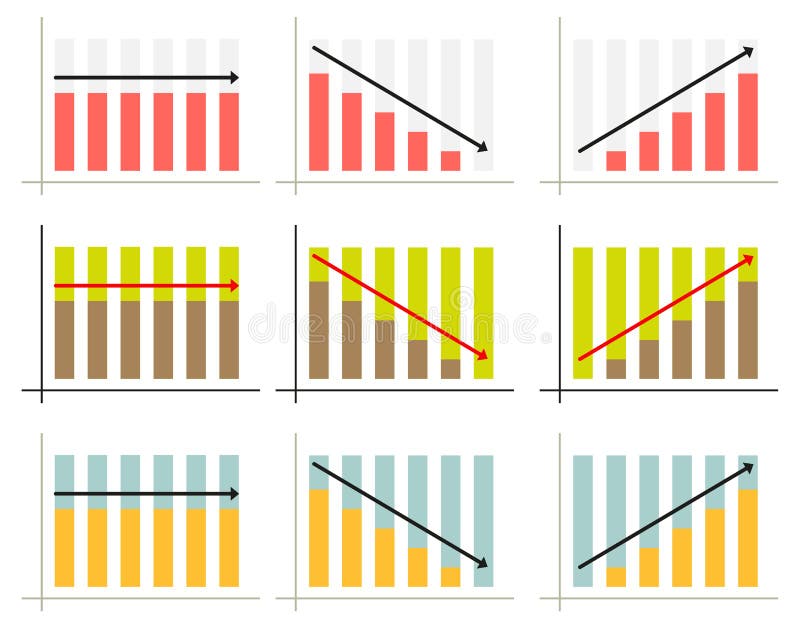
Free with trial Set of 3 infographic graphs for3 different situations in 3 color schemes. Infographic financial growth decrease vectors Graph set. Set of 3 infographic graphs for3 different situations in 3 color schemes
Free with trial Six simple line graphs showcase various data trends, including upward, downward, and fluctuating patterns. Each graph features key data points marked with letters. Infographic financial growth decrease illustrations Six Line Graph Charts Data Visualization, Trends, Growth, Analysis. Six simple line graphs showcase various data trends, including upward, downward, and fluctuating patterns. Each graph features key data points marked with letters
Free with trial Economic crisis and money loss icons, downturn and bankruptcy symbols, line vector. World financial crisis and global economy recession icons of business bankruptcy, finance downturn and unemployment. Infographic financial growth decrease vectors Economic crisis and money loss icons of downturn. Economic crisis and money loss icons, downturn and bankruptcy symbols, line vector. World financial crisis and global economy recession icons of business bankruptcy, finance downturn and unemployment
Free with trial Circular chart icon presenting a bar graph visualizing statistical data, analytics, and business reports, symbolizing financial decline, data analysis, and market trends. Infographic financial growth decrease vectors Circular chart icon showing declining bar graph. Circular chart icon presenting a bar graph visualizing statistical data, analytics, and business reports, symbolizing financial decline, data analysis, and market trends
Free with trial A clean and minimalist illustration featuring a set of fundamental mathematical symbols in black against a pure white background. The symbols include plus (+), minus (-), division (�), multiplication (�), and equals ( ). This versatile graphic is ideal for educational materials, financial reports, business presentations, technology interfaces, or any design requiring clear representation of arithmetic operations, problem-solving, or logical concepts. Its simple design ensures high readability and adaptability across various media. Infographic financial growth decrease illustrations Basic Mathematical Symbols Set on White Background. A clean and minimalist illustration featuring a set of fundamental mathematical symbols in black against a pure white background. The symbols include plus (+), minus (-), division (�), multiplication (�), and equals ( ). This versatile graphic is ideal for educational materials, financial reports, business presentations, technology interfaces, or any design requiring clear representation of arithmetic operations, problem-solving, or logical concepts. Its simple design ensures high readability and adaptability across various media.
Free with trial A 3D bar chart rendered in a vibrant pink color illustrates a downward trend. The bars decrease in height from left to right, representing a decline in data or performance. A thick pink arrow with a sharp point follows the descending path of the bars, reinforcing the concept of a decrease. The chart is presented in isolation against a clean white background, making the visual elements stand out. Infographic financial growth decrease illustrations Pink Bar Chart with a Downward Trending Arrow Symbolizing Decline graph magenta. A 3D bar chart rendered in a vibrant pink color illustrates a downward trend. The bars decrease in height from left to right, representing a decline in data or performance. A thick pink arrow with a sharp point follows the descending path of the bars, reinforcing the concept of a decrease. The chart is presented in isolation against a clean white background, making the visual elements stand out
Free with trial The laptop with stock quote graphs on the screen. The drop and the growth in the shares price trends. The broker`s laptop, selling and buying buttons. Business flat isometric concept illustration. Infographic financial growth decrease vectors The broker`s laptop with stock quote graphs on the screen. The laptop with stock quote graphs on the screen. The drop and the growth in the shares price trends. The broker`s laptop, selling and buying buttons. Business flat isometric concept illustration.
Free with trial 3D chart illustration showing a red arrow and decreasing blue bars on a light background, representing loss, decline or negative trend. Infographic financial growth decrease illustrations . 3D chart illustration showing a red arrow and decreasing blue bars on a light background, representing loss, decline or negative trend
Free with trial A clean, minimalist icon representing the stock market. The image features a bull and a bear, symbolizing market trends, with a rising green arrow indicating an upward trend. The design is enclosed in a circular frame, suitable for financial reports, investment presentations, or business infographics. The simple line art style makes it versatile for various applications. Infographic financial growth decrease illustrations Stock Market Bull and Bear Trend Icon. A clean, minimalist icon representing the stock market. The image features a bull and a bear, symbolizing market trends, with a rising green arrow indicating an upward trend. The design is enclosed in a circular frame, suitable for financial reports, investment presentations, or business infographics. The simple line art style makes it versatile for various applications.
Free with trial A magnifying glass focuses on a declining bar graph and a file folder, symbolizing a decrease in sales and the need for. Infographic financial growth decrease illustrations Declining Sales Analysis Magnifying Glass, Downward Graph. A magnifying glass focuses on a declining bar graph and a file folder, symbolizing a decrease in sales and the need for.
Free with trial A bold outline illustration of a computer screen displaying a downward trending line, representing financial loss or negative growth. Infographic financial growth decrease vectors Bold Outline Computer Screen with Falling Trend Line Icon Illustration. A bold outline illustration of a computer screen displaying a downward trending line, representing financial loss or negative growth.
Free with trial Abstract 3d bar charts illustrating data visualization, financial statistics, and business analysis, presenting growth and decline trends in a report format. Infographic financial growth decrease illustrations Business data visualization showing 3d bar graphs. Abstract 3d bar charts illustrating data visualization, financial statistics, and business analysis, presenting growth and decline trends in a report format
Free with trial A pair of arrows represented increase profit and recession business. Flat thin line infographic template. Red progress arrow and blue recession arrow. Increase decrease graphs concept diagram chart. Infographic financial growth decrease vectors Progress and recession. A pair of arrows represented increase profit and recession business. Flat thin line infographic template. Red progress arrow and blue recession arrow. Increase decrease graphs concept diagram chart.
Free with trial Displaying purple world map with rising red bars, red line graph on slide with green grid. Infographic, analytics, digital, technology, finance, strategic, modern. Infographic financial growth decrease illustrations Displaying purple world map with rising red bars, red line graph on slide with green grid
Free with trial A vibrant and modern illustration of a bar graph, featuring four bars of varying heights and colors: blue, green, orange, and red. The bars are positioned on a gray horizontal line, creating a sense of data comparison and visual hierarchy. This image is ideal for representing data, statistics, business reports, financial analysis, or any concept requiring visual data representation. The clean design and bright colors make it suitable for presentations, websites, and marketing materials. Infographic financial growth decrease illustrations Colorful Bar Graph Illustration. A vibrant and modern illustration of a bar graph, featuring four bars of varying heights and colors: blue, green, orange, and red. The bars are positioned on a gray horizontal line, creating a sense of data comparison and visual hierarchy. This image is ideal for representing data, statistics, business reports, financial analysis, or any concept requiring visual data representation. The clean design and bright colors make it suitable for presentations, websites, and marketing materials.
Free with trial Flat vector illustration of a dollar sign in a blue circle between orange and blue arrows pointing up and down. Conceptual icon for currency exchange, stock market volatility, and financial profit. Infographic financial growth decrease vectors Flat vector illustration of a dollar sign in a blue circle between orange and blue arrows pointing up and down. Conceptual icon. For currency exchange, stock. Flat vector illustration of a dollar sign in a blue circle between orange and blue arrows pointing up and down. Conceptual icon for currency exchange, stock market volatility, and financial profit
Free with trial Red 3d arrow going down stock icon on white background. Bankruptcy, financial market crash icon for your web site design. chart going down sign. 3d rendering. Vector illustration. Infographic financial growth decrease vectors 3d arrow going down stock icon
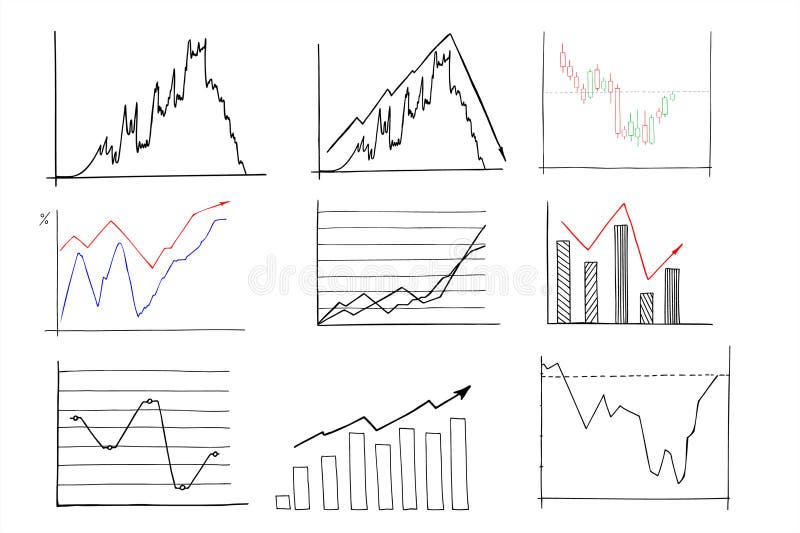
Free with trial A vibrant collection of hand-drawn business charts and graphs, rendered in blue tones. The set includes various types of visualizations like bar charts, line graphs, and a pie chart, all with a sketchy, illustrative style. These visuals are ideal for presentations, reports, and infographics related to finance, data analysis, growth, and business performance. Infographic financial growth decrease illustrations Hand-Drawn Business Charts and Graphs Collection. A vibrant collection of hand-drawn business charts and graphs, rendered in blue tones. The set includes various types of visualizations like bar charts, line graphs, and a pie chart, all with a sketchy, illustrative style. These visuals are ideal for presentations, reports, and infographics related to finance, data analysis, growth, and business performance.
Free with trial A cartoon Bitcoin character is presenting a chart showing cryptocurrency market trends. The image is suitable for illustrating financial news, investment advice, or educational materials about Bitcoin and the crypto market. Infographic financial growth decrease illustrations Bitcoin Cartoon Character Explaining Crypto Market Trends. A cartoon Bitcoin character is presenting a chart showing cryptocurrency market trends. The image is suitable for illustrating financial news, investment advice, or educational materials about Bitcoin and the crypto market.
Free with trial A striking 3D rendering features an abstract bar graph composed of numerous translucent blue rectangular blocks against a dark, almost black, background. The varying heights of the blocks create a dynamic visual representation of data, statistics, or growth trends. This modern and futuristic design is ideal for illustrating concepts related to business, finance, technology, analytics, market research, or digital information in presentations, reports, websites, and corporate media. Infographic financial growth decrease illustrations Abstract 3D Blue Bar Graph Visualization. A striking 3D rendering features an abstract bar graph composed of numerous translucent blue rectangular blocks against a dark, almost black, background. The varying heights of the blocks create a dynamic visual representation of data, statistics, or growth trends. This modern and futuristic design is ideal for illustrating concepts related to business, finance, technology, analytics, market research, or digital information in presentations, reports, websites, and corporate media.
Free with trial Simple line graph illustrating a negative trend, representing a decrease or decline in data. Perfect for presentations, reports, or website design. Infographic financial growth decrease vectors Downward Trending Line Graph, Showing Negative Growth or Decline. Simple line graph illustrating a negative trend, representing a decrease or decline in data. Perfect for presentations, reports, or website design.
Free with trial Business graph data in a bar chart showing increase and decrease with blue line illustration on plain background. Infographic financial growth decrease vectors Business graph data in a bar chart showing increase and decrease with blue line illustration on plain background
Free with trial Bitcoin Up Down Graph. Vector Illustration with Financial Diagram isolated over White. Infographic financial growth decrease vectors Bitcoin Up Down Graph
Free with trial Ai-Generated. a collection of twentyone minimalistic graph chart icons these icons illustrate different types of data trends suitable for representing business information, statistical analysis, and financial reports each icon features a unique line graph, bar chart, or diagram style. Infographic financial growth decrease vectors Collection of minimalistic graph chart icons presenting different types of business data trends. Ai-Generated. a collection of twentyone minimalistic graph chart icons these icons illustrate different types of data trends suitable for representing business information, statistical analysis, and financial reports each icon features a unique line graph, bar chart, or diagram style
Free with trial A set of black icons representing percentage changes, including arrows and circular symbols. The icons depict various concepts such as decrease, increase, and rotation, all incorporating percentage signs. The simple design makes them versatile for use in financial, statistical, or educational materials. Infographic financial growth decrease illustrations Black percentage icons set. A set of black icons representing percentage changes, including arrows and circular symbols. The icons depict various concepts such as decrease, increase, and rotation, all incorporating percentage signs. The simple design makes them versatile for use in financial, statistical, or educational materials.