Free with trial A simple illustration of a bar chart with a downward arrow showing decline, loss, negative growth, or decreasing business and financial performance. Infographic financial growth decrease vectors Downward Trend Analytics Icon. A simple illustration of a bar chart with a downward arrow showing decline, loss, negative growth, or decreasing business and financial performance
Free with trial Decrease and Growing graph Icon. Chart with bars declining Raster icon. Finance graph symbol. Raster on white background. Infographic financial growth decrease illustrations Decrease and Growing graph Icon. Chart with bars declining Raster icon. Finance graph symbol.
Free with trial A simple illustration of a bar chart with a downward arrow showing decline, loss, negative growth, or decreasing business and financial performance. Infographic financial growth decrease vectors Business Decline Chart Illustration. A simple illustration of a bar chart with a downward arrow showing decline, loss, negative growth, or decreasing business. A simple illustration of a bar chart with a downward arrow showing decline, loss, negative growth, or decreasing business and financial performance
Free with trial Infographic banner with 4 arrows pointing down. Can be used for diagram, graph, chart, report, web design. Vector illustration. Infographic financial growth decrease vectors Infographic banner with 4 arrows pointing down. Can be used for diagram, graph, chart, report, web design.
Free with trial Business decline. Bar chart falling growth levels, paired with a sad face icon negative outcomes. Ideal for business reports, marketing, finance, corporate strategy, data visualization. Infographic financial growth decrease illustrations Declining Business Growth Concept with Negative Emotional Impact Icon. Business decline. Bar chart falling growth levels, paired with a sad face icon negative outcomes. Ideal for business reports, marketing, finance, corporate strategy, data visualization
Free with trial Simple black icons representing financial growth and decline, perfect for business analytics and reporting. This scalable vector graphic is versatile for web and print. Infographic financial growth decrease vectors Bar charts with arrows indicating growth or decline. Simple black icons representing financial growth and decline, perfect for business analytics and reporting. This scalable vector graphic is versatile for web and print
Free with trial Isometric banner template showing inflation concept. Vector illustration of financial crisis, rising prices, and money value decrease. Data analysis report with charts and upward arrow for web design. Infographic financial growth decrease vectors Inflation And Economic Crisis Data Analysis Isometric Banner Template Vector Illustration. Isometric banner template showing inflation concept. Vector illustration of financial crisis, rising prices, and money value decrease. Data analysis report with charts and upward arrow for web design
Free with trial A comprehensive set of vector line icons depicting bull and bear market trends. This collection features various combinations of bull and bear silhouettes integrated with financial charts, including rising and falling line graphs and bar graphs. Each icon clearly symbolizes either a bullish market (growth, upward trend) or a bearish market (decline, downward trend). Ideal for financial websites, trading applications, investment presentations, economic reports, infographics, and educational materials illustrating stock market dynamics and investment strategies. Infographic financial growth decrease vectors Bull and Bear Market Stock Trading Line Icons Set. A comprehensive set of vector line icons depicting bull and bear market trends. This collection features various combinations of bull and bear silhouettes integrated with financial charts, including rising and falling line graphs and bar graphs. Each icon clearly symbolizes either a bullish market (growth, upward trend) or a bearish market (decline, downward trend). Ideal for financial websites, trading applications, investment presentations, economic reports, infographics, and educational materials illustrating stock market dynamics and investment strategies.
Free with trial Uptrend and downtrend business chart icon vector. Economic growth and decline arrow symbol in black circle. Infographic financial growth decrease vectors Uptrend and downtrend business chart icon. Economic growth and decline arrow symbol in black circle
Free with trial A simple and clean line art icon of a graph, isolated on a white background. This vector illustration features a line chart with axes, showing a fluctuating trend with distinct data points. The minimalist design makes it perfect for various applications related to business, finance, and data analysis. Ideal for use in presentations, infographics, websites, mobile apps, and user interfaces to represent concepts like statistics, growth, market trends, performance reports, and financial analytics. A versatile symbol for progress and data visualization. Infographic financial growth decrease illustrations Analytics Line Graph Vector Icon. A simple and clean line art icon of a graph, isolated on a white background. This vector illustration features a line chart with axes, showing a fluctuating trend with distinct data points. The minimalist design makes it perfect for various applications related to business, finance, and data analysis. Ideal for use in presentations, infographics, websites, mobile apps, and user interfaces to represent concepts like statistics, growth, market trends, performance reports, and financial analytics. A versatile symbol for progress and data visualization.
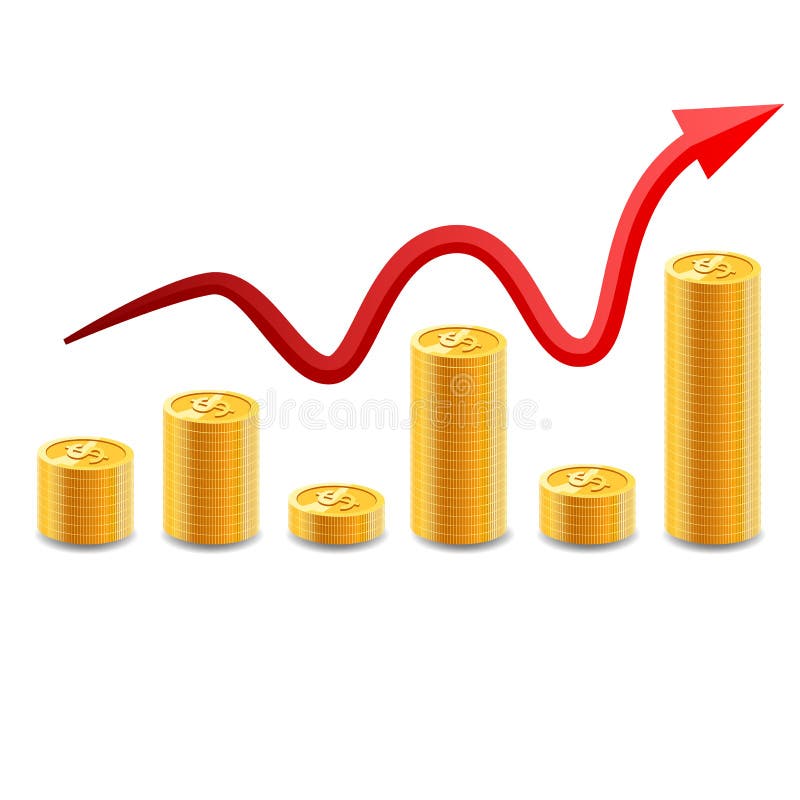
Free with trial Increasing piles of coins with going up graph. Concept for financial growth. illustration. Infographic financial growth decrease vectors Increasing piles of coins with going up graph.
Free with trial The image showcases a smartphone displaying financial data visualizations, including line graphs and bar charts. Additional icons and graphics related to data analysis and finance surround the phone, emphasizing the digital and analytical nature of the content. This composition was generated by AI,. Infographic financial growth decrease illustrations Mobile Financial Data. The image showcases a smartphone displaying financial data visualizations, including line graphs and bar charts. Additional icons and graphics related to data analysis and finance surround the phone, emphasizing the digital and analytical nature of the content. This composition was generated by AI,
Free with trial A simple and clean line graph icon illustration, perfect for illustrating financial data, growth charts, and statistical analysis. Ideal for use in presentations, reports, and websites. Infographic financial growth decrease vectors Minimalist Line Graph Icon Design for Financial Data Analysis Presentation. A simple and clean line graph icon illustration, perfect for illustrating financial data, growth charts, and statistical analysis. Ideal for use in presentations, reports, and websites.
Free with trial Infographic template with 3 arrows pointing down. Can be used for diagram, graph, chart, report, web design. Vector illustration. Infographic financial growth decrease vectors Infographic template with 3 arrows pointing down
Free with trial Diagram Graph And Financial Charts icons set with white background. Thin Line Style stock vector. Infographic financial growth decrease vectors Diagram Graph And Financial Charts icons set with white background.
Free with trial Decreasing graphs concept, financial strategy, low return on investment, the balance sheet of money and gold, long-term investment decline, reduced revenue, interest rate, credit money. Paper style vector. Infographic financial growth decrease vectors Decreasing graphs concept, financial strategy. Paper cut style vector. Decreasing graphs concept, financial strategy, low return on investment, the balance sheet of money and gold, long-term investment decline, reduced revenue, interest rate, credit money. Paper style vector.
Free with trial Growth and decline chart icon in flat design. Business trend arrow symbol illustration. Profit and loss concept. Infographic financial growth decrease vectors Growth and decline chart icon in flat design. Business trend arrow symbol. Profit and loss concept
Free with trial Infographic template with 5 arrows pointing down. Can be used for diagram, graph, chart, report, web design. Vector illustration. Infographic financial growth decrease vectors Infographic template with 5 arrows pointing down. Can be used for diagram, graph, chart, report, web design.
Free with trial Chart graph. Black Icon growth and downward with arrow isolated on background. Hologram positive, fall percentage. Design business concept direction growth, recession. Analysis. Vector illustration. Infographic financial growth decrease vectors Chart graph. Black Icon growth and downward with arrow. Hologram positive, fall percentage. Design business. Vector illustration. Chart graph. Black Icon growth and downward with arrow isolated on background. Hologram positive, fall percentage. Design business concept direction growth, recession. Analysis. Vector illustration
Free with trial A comprehensive collection of flat line design icons representing key concepts in business, finance, and data analytics. The set includes various charts (bar, line, pie), a speedometer, a magnifying glass with a graph, financial documents with checkmarks, a target with an arrow, a dollar sign, a percentage symbol, and directional arrows for growth and decline. These versatile vector elements are ideal for presentations, reports, websites, and applications focused on statistics, performance, strategy, and financial insights. Infographic financial growth decrease illustrations Business and Data Analytics Flat Line Icons Set. A comprehensive collection of flat line design icons representing key concepts in business, finance, and data analytics. The set includes various charts (bar, line, pie), a speedometer, a magnifying glass with a graph, financial documents with checkmarks, a target with an arrow, a dollar sign, a percentage symbol, and directional arrows for growth and decline. These versatile vector elements are ideal for presentations, reports, websites, and applications focused on statistics, performance, strategy, and financial insights.
Free with trial A comprehensive vector icon set featuring essential symbols for business, finance, and data analysis. This collection includes various arrows for indicating growth and decline, wavy lines representing market trends, checkmarks for success or approval, X marks for errors or rejection, stopwatches for time management and efficiency, and stacks of coins with dollar signs for financial concepts. Ideal for presentations, infographics, web design, and reports to visually communicate progress, status, and economic indicators. Infographic financial growth decrease vectors Business, Finance, and Data Analytics Vector Icon Set. A comprehensive vector icon set featuring essential symbols for business, finance, and data analysis. This collection includes various arrows for indicating growth and decline, wavy lines representing market trends, checkmarks for success or approval, X marks for errors or rejection, stopwatches for time management and efficiency, and stacks of coins with dollar signs for financial concepts. Ideal for presentations, infographics, web design, and reports to visually communicate progress, status, and economic indicators.
Free with trial A financial report document lies flat on a white surface, displaying the text "FINANCIAL REPORT". Rising from the document are several translucent 3D bars in shades of purple, blue, and green, arranged in ascending order. To the right of the bars is a colorful 3D pie chart with segments in yellow, red, orange, and blue. Infographic financial growth decrease illustrations Financial Report with 3D Bar Graph and Pie Chart on White Background document paper. A financial report document lies flat on a white surface, displaying the text "FINANCIAL REPORT". Rising from the document are several translucent 3D bars in shades of purple, blue, and green, arranged in ascending order. To the right of the bars is a colorful 3D pie chart with segments in yellow, red, orange, and blue
Free with trial Data analytics dashboard illustrating a mix of line graphs, bar charts, and data summaries, representing business growth, financial trends, and statistical insights for market analysis. Infographic financial growth decrease vectors Data analytics dashboard showing business growth and decline. Data analytics dashboard illustrating a mix of line graphs, bar charts, and data summaries, representing business growth, financial trends, and statistical insights for market analysis
Free with trial Decrease and Growing graph Icon. Chart with bars declining vector icon. Finance graph symbol. Vector on white background. Infographic financial growth decrease vectors Decrease and Growing graph Icon. Chart with bars declining vector icon. Finance graph symbol.
Free with trial A circular icon containing a stylized representation of financial data. The icon features a series of black vertical bars of varying heights, suggesting a bar chart. Overlaid on the bars are two thin lines, one black and one grey, depicting line graphs with peaks and troughs, indicating fluctuating trends. The overall design is minimalist and symbolic, suitable for representing business analytics. Infographic financial growth decrease illustrations Circular Graph Icon with Bar and Line Charts Representing Financial Data and Trends business. A circular icon containing a stylized representation of financial data. The icon features a series of black vertical bars of varying heights, suggesting a bar chart. Overlaid on the bars are two thin lines, one black and one grey, depicting line graphs with peaks and troughs, indicating fluctuating trends. The overall design is minimalist and symbolic, suitable for representing business analytics
Free with trial A vibrant, hand-drawn doodle illustration centered around a large percentage sign. This creative sketch features various financial and business icons, including bar graphs, pie charts, stacks of coins, dollar signs, and arrows indicating growth and decline. The colorful, cartoonish style makes it perfect for illustrating concepts like interest rates, economic trends, business analytics, and financial reports. Ideal for use in presentations, infographics, websites, and educational materials, this vector art is isolated on a white background for versatile application. Infographic financial growth decrease illustrations Finance and Economy Doodle Illustration. A vibrant, hand-drawn doodle illustration centered around a large percentage sign. This creative sketch features various financial and business icons, including bar graphs, pie charts, stacks of coins, dollar signs, and arrows indicating growth and decline. The colorful, cartoonish style makes it perfect for illustrating concepts like interest rates, economic trends, business analytics, and financial reports. Ideal for use in presentations, infographics, websites, and educational materials, this vector art is isolated on a white background for versatile application.
Free with trial A stylized, flat design illustration of a bar chart depicting a downward trend. The bars are colored red, yellow, and blue, arranged in decreasing height from left to right. A prominent red arrow points downwards across the chart, emphasizing the decline. The graphic is set against a clean white background, making it ideal for presentations, reports, and financial concepts related to loss, decrease, or negative performance. Infographic financial growth decrease illustrations Declining Bar Chart with Downward Arrow. A stylized, flat design illustration of a bar chart depicting a downward trend. The bars are colored red, yellow, and blue, arranged in decreasing height from left to right. A prominent red arrow points downwards across the chart, emphasizing the decline. The graphic is set against a clean white background, making it ideal for presentations, reports, and financial concepts related to loss, decrease, or negative performance.
Free with trial Bar chart icon representing data visualization, financial growth, business analytics, and market trends, indicating increasing and decreasing values for decision making. Infographic financial growth decrease vectors Bar chart icon showing data analysis and statistics. Bar chart icon representing data visualization, financial growth, business analytics, and market trends, indicating increasing and decreasing values for decision making
Free with trial Infographic template with 3 arrows pointing down. Can be used for diagram, graph, chart, report, web design. Vector illustration. Infographic financial growth decrease vectors Infographic template with 3 arrows pointing down.
Free with trial A clean and minimalist black outline icon of a percentage symbol, isolated on a pure white background. This versatile graphic represents discounts, sales, interest rates, financial calculations, and statistical data. Ideal for web design, mobile applications, business presentations, marketing materials, infographics, and educational content. Its simple, modern aesthetic makes it perfect for conveying concepts of proportion, growth, and change in a clear and concise manner. Infographic financial growth decrease illustrations Minimalist Percentage Symbol Outline Icon. A clean and minimalist black outline icon of a percentage symbol, isolated on a pure white background. This versatile graphic represents discounts, sales, interest rates, financial calculations, and statistical data. Ideal for web design, mobile applications, business presentations, marketing materials, infographics, and educational content. Its simple, modern aesthetic makes it perfect for conveying concepts of proportion, growth, and change in a clear and concise manner.
Free with trial Bar chart representation of data increase growth and finance. Data analysis. Infographic financial growth decrease vectors Bar chart representation of data increase growth and finance. Data analysis
Free with trial This image depicts a bar graph with a clear downward trend. Blue bars decrease in height from left to right, representing a decline in value. A bold red arrow overlays the bars, visually emphasizing the negative trend. A blue line also shows a downward trend. The image conveys a sense of loss, recession, or negative performance and is suitable for illustrating financial or economic concepts. Infographic financial growth decrease illustrations Declining Bar Graph with Downward Trend Lines. This image depicts a bar graph with a clear downward trend. Blue bars decrease in height from left to right, representing a decline in value. A bold red arrow overlays the bars, visually emphasizing the negative trend. A blue line also shows a downward trend. The image conveys a sense of loss, recession, or negative performance and is suitable for illustrating financial or economic concepts.
Free with trial A flat depicting two distinct financial charts against a white background. The left chart a bar graph with bars in shades of green and blue, topped by a jagged blue line graph ascending towards a green percentage symbol and an upward arrow. The right chart a bar graph with bars in yellow, orange, and red, with a red line graph descending from a yellow dollar sign. Infographic financial growth decrease illustrations Upward and downward financial charts with percentage and dollar symbols. A flat depicting two distinct financial charts against a white background. The left chart a bar graph with bars in shades of green and blue, topped by a jagged blue line graph ascending towards a green percentage symbol and an upward arrow. The right chart a bar graph with bars in yellow, orange, and red, with a red line graph descending from a yellow dollar sign
Free with trial This image features a minimalist and modern vector icon of a jagged downward trending line graph, sharply declining from left to right, symbolizing financial loss, economic downturn, or market decline, set against a clean and uncluttered white background suitable for use in presentations, reports, infographics, or digital media to visually communicate negative trends or decreasing performance. Infographic financial growth decrease illustrations Sharp downward trending line graph icon isolated on white background representing financial loss or market decline vector. This image features a minimalist and modern vector icon of a jagged downward trending line graph, sharply declining from left to right, symbolizing financial loss, economic downturn, or market decline, set against a clean and uncluttered white background suitable for use in presentations, reports, infographics, or digital media to visually communicate negative trends or decreasing performance
Free with trial A comprehensive collection of hand-drawn business and data visualization icons. This doodle-style set features a variety of essential elements, including different types of arrows, bar graphs, line charts, and pie charts. The sketchy, black and white illustrations are perfect for infographics, presentations, financial reports, and marketing materials. Each icon is isolated on a white background, representing concepts like growth, statistics, process flow, and direction. This versatile vector set is ideal for adding a creative, hand-made touch to any project related to analytics, finance, or strategy. Infographic financial growth decrease illustrations Hand Drawn Business and Finance Doodle Icon Set. A comprehensive collection of hand-drawn business and data visualization icons. This doodle-style set features a variety of essential elements, including different types of arrows, bar graphs, line charts, and pie charts. The sketchy, black and white illustrations are perfect for infographics, presentations, financial reports, and marketing materials. Each icon is isolated on a white background, representing concepts like growth, statistics, process flow, and direction. This versatile vector set is ideal for adding a creative, hand-made touch to any project related to analytics, finance, or strategy.
Free with trial Dynamic teal graph visually represents financial data. Professional design elements provide an ideal visual for business reports and presentations , dreamy concept. Infographic financial growth decrease illustrations Abstract Digital Financial Graph with Teal Data. Dynamic teal graph visually represents financial data. Professional design elements provide an ideal visual for business reports and presentations , dreamy concept
Free with trial Green up and red down 3d arrow graph showing rising, descending trend, business result, profit or loss symbol symbol. Business arrow, goals concept. 3d world money symbols. Financial growth vector isolated. Infographic financial growth decrease vectors Green up and red down 3d arrow graph showing rising, descending trend, business result, profit. world money symbols. Green up and red down 3d arrow graph showing rising, descending trend, business result, profit or loss symbol symbol. Business arrow, goals concept. 3d world money symbols. Financial growth vector isolated
Free with trial Green up and red down 3d arrow graph showing rising, descending trend, business result, profit or loss symbol symbol. Business arrow, goals concept. 3d world money symbols. Financial growth vector isolated. Infographic financial growth decrease vectors Green up and red down 3d arrow graph showing rising, descending trend, business result, profit. world money symbols. Green up and red down 3d arrow graph showing rising, descending trend, business result, profit or loss symbol symbol. Business arrow, goals concept. 3d world money symbols. Financial growth vector isolated
Free with trial Green up and red down 3d arrow graph showing rising, descending trend, business result, profit or loss symbol symbol. Business arrow, goals concept. 3d world money symbols. Financial growth vector isolated. Infographic financial growth decrease vectors Green up and red down 3d arrow graph showing rising, descending trend, business result, profit. world money symbols. Green up and red down 3d arrow graph showing rising, descending trend, business result, profit or loss symbol symbol. Business arrow, goals concept. 3d world money symbols. Financial growth vector isolated
Free with trial Green up and red down 3d arrow graph showing rising, descending trend, business result, profit or loss symbol symbol. Business arrow, goals concept. 3d world money symbols. Financial growth vector isolated. Infographic financial growth decrease vectors Green up and red down 3d arrow graph showing rising, descending trend, business result, profit. world money symbols. Green up and red down 3d arrow graph showing rising, descending trend, business result, profit or loss symbol symbol. Business arrow, goals concept. 3d world money symbols. Financial growth vector isolated
Free with trial Green up and red down 3d arrow graph showing rising, descending trend, business result, profit or loss symbol symbol. Business arrow, goals concept. 3d world money symbols. Financial growth vector isolated. Infographic financial growth decrease vectors Green up and red down 3d arrow graph showing rising, descending trend, business result, profit. world money symbols. Green up and red down 3d arrow graph showing rising, descending trend, business result, profit or loss symbol symbol. Business arrow, goals concept. 3d world money symbols. Financial growth vector isolated
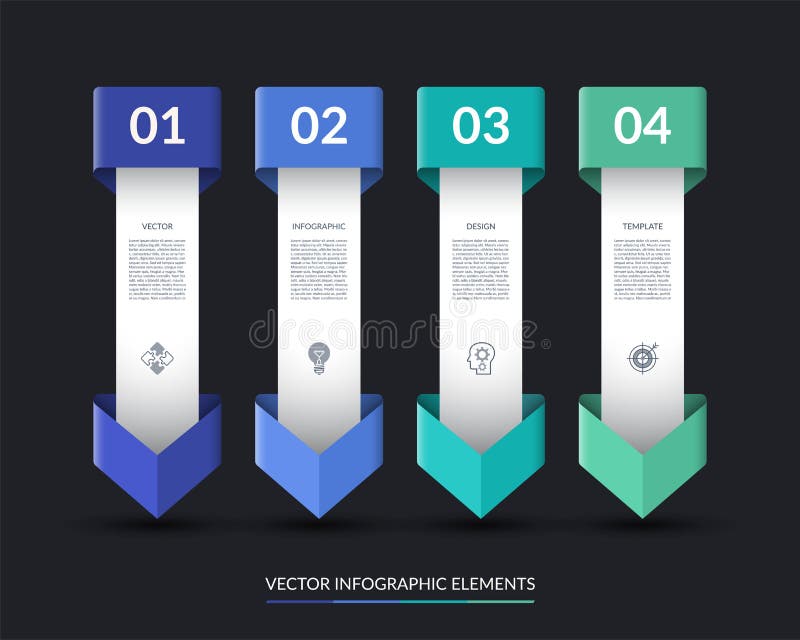
Free with trial Infographic template with 4 arrows pointing down. Can be used for diagram, graph, chart, report, web design. Vector illustration. Infographic financial growth decrease vectors Infographic template with 4 arrows pointing down. Can be used for diagram, graph, chart, report, web design.
Free with trial Red 3D zigzag arrow is trending downward on plain white background, casting faint shadow. Business decline, financial analysis, data visualization, modern design, digital marketing, growth reduction, minimalistic style. Infographic financial growth decrease illustrations Red 3D zigzag arrow is trending downward on plain white background, casting faint shadow
Free with trial A vibrant red arrow graph dramatically depicts a downward trend, ideal for illustrating concepts of decline, loss, recession, or negative growth. The transparent background allows for seamless integration into various designs, presentations, and reports. This vector graphic is perfect for financial reports, presentations, websites, and social media posts. Infographic financial growth decrease illustrations Red Downward Trending Arrow Graph on Transparent Background. A vibrant red arrow graph dramatically depicts a downward trend, ideal for illustrating concepts of decline, loss, recession, or negative growth. The transparent background allows for seamless integration into various designs, presentations, and reports. This vector graphic is perfect for financial reports, presentations, websites, and social media posts.
Free with trial Modern collection of business and finance elements. Contains data, charts,diagrams. Use it for presentation, report and infographic projects. Infographic financial growth decrease vectors Set of Business and Finance Infographic Elements on Transparent Background Vectors. Modern collection of business and finance elements. Contains data, charts,diagrams. Use it for presentation, report and infographic projects
Free with trial Illustration showing financial data analysis with charts, idea lightbulb, and location pins, perfect for finance and business concepts. Infographic financial growth decrease illustrations Analyzing Financial Data and Performance Charts Illustration. Illustration showing financial data analysis with charts, idea lightbulb, and location pins, perfect for finance and business concepts
Free with trial This image showcases a comprehensive collection of blue bar graphs and line graphs, presented in a grid format. Each graph depicts various data trends, including upward and downward movements, fluctuating patterns, and steady growth. The clean, modern design makes these icons ideal for representing financial data, market analysis, performance metrics, and business growth in presentations, reports, and websites. Infographic financial growth decrease illustrations Collection of Blue Bar and Line Graphs for Business Analytics. This image showcases a comprehensive collection of blue bar graphs and line graphs, presented in a grid format. Each graph depicts various data trends, including upward and downward movements, fluctuating patterns, and steady growth. The clean, modern design makes these icons ideal for representing financial data, market analysis, performance metrics, and business growth in presentations, reports, and websites.
Free with trial This image features a bold 2. 29% percentage symbol in metallic blue on a black background, ideal for financial presentations and business reports. Infographic financial growth decrease illustrations Metallic Blue Percentage Symbol 229 on Black Background for Financial and Business Concepts. This image features a bold 2.29% percentage symbol in metallic blue on a black background, ideal for financial presentations and business reports
Free with trial A black silhouette of a financial graph with bars and jagged lines is shown on white. Infographic financial growth decrease illustrations Black silhouette of a financial graph with bars and jagged lines on white chart business. A black silhouette of a financial graph with bars and jagged lines is shown on white
Free with trial Bar graph displays a colorful representation of business growth and financial success with bars increasing in height and vibrant colors on a reflective surface indicating positive trends. Infographic financial growth decrease illustrations Colorful bar graph showing growth and success in business and finance on a reflective surface. Bar graph displays a colorful representation of business growth and financial success with bars increasing in height and vibrant colors on a reflective surface indicating positive trends.
Free with trial Abstract 3D Bar Chart Showing Data Growth. Infographic financial growth decrease illustrations Abstract 3D Bar Chart Showing Data Growth
Free with trial Colorful bar graph with stacked segments illustrating growth and data analysis. Infographic financial growth decrease vectors Colorful bar graph with stacked segments illustrating growth and data analysis
Free with trial A conceptual vector illustration depicting business analysis and market research. A hand holds a magnifying glass, focusing on a colorful financial chart with bar and line graphs labeled 'Market Trends'. Surrounding icons represent key business metrics like growth, decline, market share, and innovation. This flat design graphic is ideal for presentations, reports, and web content related to data analytics, strategic planning, and financial performance evaluation, symbolizing the scrutiny of data to identify opportunities and understand market dynamics. Infographic financial growth decrease illustrations Business Analysis and Market Trends Concept with Magnifying Glass. A conceptual vector illustration depicting business analysis and market research. A hand holds a magnifying glass, focusing on a colorful financial chart with bar and line graphs labeled 'Market Trends'. Surrounding icons represent key business metrics like growth, decline, market share, and innovation. This flat design graphic is ideal for presentations, reports, and web content related to data analytics, strategic planning, and financial performance evaluation, symbolizing the scrutiny of data to identify opportunities and understand market dynamics.
Free with trial This vibrant image, generated by AI, depicts a cityscape with a dynamic graph illustrating growth and potential decline. The color transition symbolizes economic fluctuations, offering a visual representation of urban development and market trends. Infographic financial growth decrease illustrations AI-Generated Cityscape Growth Chart. This vibrant image, generated by AI, depicts a cityscape with a dynamic graph illustrating growth and potential decline. The color transition symbolizes economic fluctuations, offering a visual representation of urban development and market trends.
Free with trial Growth and decline chart icon. Green upward and red downward arrow symbol illustration. Infographic financial growth decrease vectors Growth and decline chart icon. Green upward and red downward arrow symbol
Free with trial Increasing piles of coins with going up graph. Concept for financial growth. illustration. Infographic financial growth decrease vectors Increasing piles of coins with going up graph.
Free with trial Bar chart with a declining arrow, representing decrease, business, finance, economic recession. Infographic financial growth decrease vectors Bar chart with a declining arrow, representing decrease, business, finance, economic recession
Free with trial A minimalist, black and white vector icon representing a bar chart or graph. The icon features a series of vertical bars of varying heights, set against a base of horizontal lines. This clean and modern design is ideal for representing data, statistics, progress, growth, or financial information in digital and print media. Its simple aesthetic makes it versatile for use in presentations, websites, apps, and infographics. Infographic financial growth decrease vectors Abstract Bar Chart Icon. A minimalist, black and white vector icon representing a bar chart or graph. The icon features a series of vertical bars of varying heights, set against a base of horizontal lines. This clean and modern design is ideal for representing data, statistics, progress, growth, or financial information in digital and print media. Its simple aesthetic makes it versatile for use in presentations, websites, apps, and infographics.
Free with trial Abstract 3D render of a descending bar chart made of blue glass rectangles. The bars are reflected on a glossy surface, creating a clean and modern aesthetic. The image can be used to represent data visualization, financial trends, business performance, or concepts like decline, recession, or negative growth. The cool blue color palette adds a sense of calm and professionalism. Infographic financial growth decrease illustrations Abstract Blue Glass Bar Chart. Abstract 3D render of a descending bar chart made of blue glass rectangles. The bars are reflected on a glossy surface, creating a clean and modern aesthetic. The image can be used to represent data visualization, financial trends, business performance, or concepts like decline, recession, or negative growth. The cool blue color palette adds a sense of calm and professionalism.
Free with trial A clean and modern vector illustration of a line graph, isolated on a white background. This flat design icon features two distinct lines, one blue and one brown, plotting various data points to show trends and comparisons over time. It's a versatile graphic representing concepts like data analysis, business analytics, financial statistics, market research, and performance tracking. Ideal for use in presentations, infographics, websites, business reports, and marketing materials to visualize progress, growth, or economic fluctuations. Infographic financial growth decrease vectors Data Analysis Line Graph Icon. A clean and modern vector illustration of a line graph, isolated on a white background. This flat design icon features two distinct lines, one blue and one brown, plotting various data points to show trends and comparisons over time. It's a versatile graphic representing concepts like data analysis, business analytics, financial statistics, market research, and performance tracking. Ideal for use in presentations, infographics, websites, business reports, and marketing materials to visualize progress, growth, or economic fluctuations.
Free with trial Bar graphs with various upward and downward trending arrows and a stylized dollar sign indicating financial growth and decline. Infographic financial growth decrease vectors Bar graphs with various upward and downward trending arrows and a stylized dollar sign
Free with trial A clean, minimalist illustration featuring a combined line graph and bar chart on a white background. The line graph, with circular data points, shows an upward trend with fluctuations. It is overlaid on a series of vertical bars, alternating in black and white, representing discrete data values. The grid lines behind the charts suggest a data analysis or financial context. This graphic is ideal for presentations, reports, and websites related to statistics, business growth, market trends, and data visualization. Infographic financial growth decrease vectors Line and Bar Chart Combination. A clean, minimalist illustration featuring a combined line graph and bar chart on a white background. The line graph, with circular data points, shows an upward trend with fluctuations. It is overlaid on a series of vertical bars, alternating in black and white, representing discrete data values. The grid lines behind the charts suggest a data analysis or financial context. This graphic is ideal for presentations, reports, and websites related to statistics, business growth, market trends, and data visualization.
Free with trial Growth development graph rise icon. Vector graphic design. Infographic financial growth decrease vectors Graph up down growth development icon. Growth development graph rise icon. Vector graphic design.
Free with trial A comprehensive overview of financial data is presented through various charts and graphs. The scene includes line graphs, bar charts, pie charts, and donut charts, accompanied by stacks of coins. The color palette is muted, featuring shades of beige, brown, and gray, creating a professional and clean aesthetic. This image is suitable for illustrating finance, business, investment, and data analysis concepts. Infographic financial growth decrease illustrations Financial Data and Charts Overview. A comprehensive overview of financial data is presented through various charts and graphs. The scene includes line graphs, bar charts, pie charts, and donut charts, accompanied by stacks of coins. The color palette is muted, featuring shades of beige, brown, and gray, creating a professional and clean aesthetic. This image is suitable for illustrating finance, business, investment, and data analysis concepts.
Free with trial A clean, minimalist vector illustration of a bar chart featuring three distinct columns. The columns are colored in vibrant orange, teal, and yellow, representing different data points or categories. The chart is set against a white background with a dark blue axis line, making it ideal for presentations, reports, and infographics focused on data visualization, business growth, or financial analysis. Infographic financial growth decrease vectors Simple Bar Chart with Three Columns. A clean, minimalist vector illustration of a bar chart featuring three distinct columns. The columns are colored in vibrant orange, teal, and yellow, representing different data points or categories. The chart is set against a white background with a dark blue axis line, making it ideal for presentations, reports, and infographics focused on data visualization, business growth, or financial analysis.
Free with trial A 3D rendered bar chart encased in clear glass, displaying year-end business performance. The chart features three vertical bars in blue, pink, and yellow, representing 61%, 24%, and 35% respectively. The clean, modern design and transparent material create a sophisticated visual suitable for presentations, reports, and data visualization concepts related to business growth, financial analysis, and success metrics. Infographic financial growth decrease illustrations Year End Business Performance Chart. A 3D rendered bar chart encased in clear glass, displaying year-end business performance. The chart features three vertical bars in blue, pink, and yellow, representing 61%, 24%, and 35% respectively. The clean, modern design and transparent material create a sophisticated visual suitable for presentations, reports, and data visualization concepts related to business growth, financial analysis, and success metrics.
Free with trial A minimalist black line graph icon on a clean white background, clearly illustrating a downward trend. The zigzagging line culminates in a sharp arrow pointing downwards, symbolizing decline, decrease, or negative performance. This versatile vector illustration is ideal for representing financial losses, economic downturns, sales drops, market crashes, or any data indicating a negative trajectory. Perfect for business reports, presentations, websites, apps, and infographics requiring a clear visual indicator of reduction or poor results. Infographic financial growth decrease vectors Downward Trend Graph with Arrow Icon. A minimalist black line graph icon on a clean white background, clearly illustrating a downward trend. The zigzagging line culminates in a sharp arrow pointing downwards, symbolizing decline, decrease, or negative performance. This versatile vector illustration is ideal for representing financial losses, economic downturns, sales drops, market crashes, or any data indicating a negative trajectory. Perfect for business reports, presentations, websites, apps, and infographics requiring a clear visual indicator of reduction or poor results.
Free with trial Set of 16 black and white graph icons in a 4x4 grid. Each icon depicts variations of bar charts with upward and downward arrows, suggesting growth or decline. Some include additional elements like magnifying glasses, checkmarks, and data points connected by lines. Icons vary slightly in design, representing different data trends with simple, bold lines on a white background, ideal for business and statistical representation. Infographic financial growth decrease vectors Graph icon set. Increase and decrease graph icon. Growth icon. Graph chart icons. Icon set. 16 icons. Set of 16 black and white graph icons in a 4x4 grid. Each icon depicts variations of bar charts with upward and downward arrows, suggesting growth or decline. Some include additional elements like magnifying glasses, checkmarks, and data points connected by lines. Icons vary slightly in design, representing different data trends with simple, bold lines on a white background, ideal for business and statistical representation.
Free with trial Colorful Charts and Graphs Data Visualization Infographic. Infographic financial growth decrease illustrations Colorful Charts and Graphs Data Visualization Infographic
Free with trial Red bar chart depicting a downward trend on a white background. The bars progressively decrease in height from left to right. An upward-pointing arrow emerges from the first bar, indicating initial growth. A curved, downward-pointing arrow overlays the bars, emphasizing the overall decline. The clear design conveys concepts of financial loss, decreasing statistics, or declining data points. Infographic financial growth decrease vectors Red bar chart showing a downward trend with an upward arrow and a falling arrow isolated on white background. Red bar chart depicting a downward trend on a white background. The bars progressively decrease in height from left to right. An upward-pointing arrow emerges from the first bar, indicating initial growth. A curved, downward-pointing arrow overlays the bars, emphasizing the overall decline. The clear design conveys concepts of financial loss, decreasing statistics, or declining data points.
Free with trial This image presents a clean, minimalist graphic illustrating economic trends. It features two distinct charts: a line graph on the left showing fluctuating data points over time, and a bar chart on the right comparing values across categories. The charts use a simple black and white color scheme with grayscale elements, making them versatile for various business and financial contexts. Labels like 'ECONOMIC', 'PARCTIRUM', and 'PLACTIRUM' suggest analysis of economic performance and market data. The overall design emphasizes clarity and data visualization. Infographic financial growth decrease vectors Economic Growth Trends: Line and Bar Charts. This image presents a clean, minimalist graphic illustrating economic trends. It features two distinct charts: a line graph on the left showing fluctuating data points over time, and a bar chart on the right comparing values across categories. The charts use a simple black and white color scheme with grayscale elements, making them versatile for various business and financial contexts. Labels like 'ECONOMIC', 'PARCTIRUM', and 'PLACTIRUM' suggest analysis of economic performance and market data. The overall design emphasizes clarity and data visualization.
Free with trial This vibrant vector illustration showcases a collection of red and orange gradient arrows, all pointing downwards. The set includes both straight and dynamically curved arrows, effectively symbolizing various forms of decline, decrease, or negative trends. Perfect for use in business presentations, financial reports, infographics, or any design requiring a clear visual representation of falling statistics, market drops, recession, loss, or a general downward movement. The clean, modern flat design ensures versatility and impact. Infographic financial growth decrease vectors Downward Trend Red Gradient Arrows Vector Set. This vibrant vector illustration showcases a collection of red and orange gradient arrows, all pointing downwards. The set includes both straight and dynamically curved arrows, effectively symbolizing various forms of decline, decrease, or negative trends. Perfect for use in business presentations, financial reports, infographics, or any design requiring a clear visual representation of falling statistics, market drops, recession, loss, or a general downward movement. The clean, modern flat design ensures versatility and impact.
Free with trial A set of three distinct candlestick chart icons, rendered in a clean, flat vector style against a white background. The green candle typically represents a bullish trend or price increase, the red candle signifies a bearish trend or price decrease, and the gray candle can denote neutrality or indecision in the market. These versatile symbols are ideal for illustrating financial concepts, stock market analysis, trading platforms, investment apps, economic reports, and educational materials related to forex, cryptocurrency, and general business trends. Infographic financial growth decrease vectors Candlestick Chart Icons for Financial Analysis. A set of three distinct candlestick chart icons, rendered in a clean, flat vector style against a white background. The green candle typically represents a bullish trend or price increase, the red candle signifies a bearish trend or price decrease, and the gray candle can denote neutrality or indecision in the market. These versatile symbols are ideal for illustrating financial concepts, stock market analysis, trading platforms, investment apps, economic reports, and educational materials related to forex, cryptocurrency, and general business trends.
Free with trial A 3D visualization of financial data, featuring a colorful pie chart and a series of bar graphs placed on top of a financial report document. The document also includes line graphs, illustrating various data trends and analyses. The composition is set against a white background. Infographic financial growth decrease illustrations 3D Bar Chart and Pie Chart on Financial Report with Line Graphs data statistics. A 3D visualization of financial data, featuring a colorful pie chart and a series of bar graphs placed on top of a financial report document. The document also includes line graphs, illustrating various data trends and analyses. The composition is set against a white background
Free with trial This image showcases a variety of modern, flat-design charts and graphs commonly used in business, finance, and data analysis. It includes bar charts, pie charts, and line graphs, presented in a clean, minimalist style with teal and gray color accents. These visual representations are ideal for illustrating trends, statistics, performance, and financial data in presentations, reports, and web content. Infographic financial growth decrease illustrations Collection of Business and Financial Charts and Graphs. This image showcases a variety of modern, flat-design charts and graphs commonly used in business, finance, and data analysis. It includes bar charts, pie charts, and line graphs, presented in a clean, minimalist style with teal and gray color accents. These visual representations are ideal for illustrating trends, statistics, performance, and financial data in presentations, reports, and web content.
Free with trial Unemployment line icon of unemployed man on labor market, vector symbol. Economic crisis, global financial downturn and bankruptcy icon of economy recession and unemployment problem. Infographic financial growth decrease vectors Unemployment line icon, economic financial crisis. Unemployment line icon of unemployed man on labor market, vector symbol. Economic crisis, global financial downturn and bankruptcy icon of economy recession and unemployment problem
Free with trial Career growth conceptual icon. Graph vector design. Chart illustration. Infographic financial growth decrease vectors Career growth conceptual icon. Graph vector design
Free with trial Bar chart is showing growth and decline with blue and purple bars. Infographic financial growth decrease vectors Blue and purple bar chart showing growth and decline. Bar chart is showing growth and decline with blue and purple bars
Free with trial A colorful, hand-drawn illustration depicting a large percentage symbol surrounded by various financial and statistical icons. This doodle-style artwork includes bar graphs, pie charts, stacks of coins, dollar signs, and arrows indicating growth and decline. The sketch effectively visualizes concepts like interest rates, economic trends, business analytics, investment returns, and market data. Isolated on a white background, this versatile image is perfect for presentations, infographics, financial reports, and educational materials related to business, finance, and statistics. Infographic financial growth decrease illustrations Hand Drawn Finance and Percentage Concept Illustration. A colorful, hand-drawn illustration depicting a large percentage symbol surrounded by various financial and statistical icons. This doodle-style artwork includes bar graphs, pie charts, stacks of coins, dollar signs, and arrows indicating growth and decline. The sketch effectively visualizes concepts like interest rates, economic trends, business analytics, investment returns, and market data. Isolated on a white background, this versatile image is perfect for presentations, infographics, financial reports, and educational materials related to business, finance, and statistics.
Free with trial Simple Bar Chart Showing Business Growth and Data Trends. Infographic financial growth decrease vectors Simple Bar Chart Showing Business Growth and Data Trends