Free with trial This illustration, generated by AI, depicts a modern workspace with a computer displaying financial charts and graphs, surrounded by icons representing money, calculations, and productivity. It symbolizes financial analysis and data-driven decision-making. Infographic financial growth decrease illustrations AI-Generated Financial Data Visualization. This illustration, generated by AI, depicts a modern workspace with a computer displaying financial charts and graphs, surrounded by icons representing money, calculations, and productivity. It symbolizes financial analysis and data-driven decision-making.
Free with trial Red cube with arrow up. Business and market growth concept. Close-up. Infographic financial growth decrease illustrations Red cube with arrow up. Business and market growth concept
Free with trial Red cube with arrow up. Business and market growth concept. Close-up. Infographic financial growth decrease illustrations Red cube with arrow up. Business and market growth concept
Free with trial Red cube with arrow up. Business and market growth concept. Close-up. Infographic financial growth decrease illustrations Red cube with arrow up. Business and market growth concept
Free with trial This is an isometric 3D illustration depicting a dynamic data visualization. It features a combination of bar charts and a line graph, showcasing rising trends and fluctuating data points. The color palette includes shades of blue, teal, and coral, creating a modern and professional aesthetic. This graphic is ideal for representing financial reports, business analytics, market trends, growth, and performance metrics in a visually engaging and easy-to-understand format. Infographic financial growth decrease illustrations Isometric 3D Bar and Line Graph with Data Visualization. This is an isometric 3D illustration depicting a dynamic data visualization. It features a combination. This is an isometric 3D illustration depicting a dynamic data visualization. It features a combination of bar charts and a line graph, showcasing rising trends and fluctuating data points. The color palette includes shades of blue, teal, and coral, creating a modern and professional aesthetic. This graphic is ideal for representing financial reports, business analytics, market trends, growth, and performance metrics in a visually engaging and easy-to-understand format.
Free with trial A detailed data visualization illustrating market trends over time. The infographic combines a line chart, which shows fluctuating values and percentages, with a bar chart representing data for specific time intervals. The line chart highlights key data points, such as peaks annotated with values like '1. 24%' and '500K'. The x-axis represents a timeline from January to March, while the y-axis. Infographic financial growth decrease illustrations A modern market trend analysis visualization combining a bar and line chart for financial data isolated on white background. A detailed data visualization illustrating market trends over time. The infographic combines a line chart, which shows fluctuating values and percentages, with a bar chart representing data for specific time intervals. The line chart highlights key data points, such as peaks annotated with values like '1.24%' and '500K'. The x-axis represents a timeline from January to March, while the y-axis
Free with trial Chart icon and graph for statistic line or bar diagram with growth pie and graphic data. Use for analysis trend and pictogram by profit algorithm report. Business infographic title. Vector. Infographic financial growth decrease vectors Chart icon and graph for statistic line or bar diagram with growth pie and graphic data. Use for analysis trend and
Free with trial Green cube with arrow up. Business and market growth concept. Close-up. Infographic financial growth decrease illustrations Green cube with arrow up. Business and market growth concept
Free with trial Green cube with arrow up. Business and market growth concept. Close-up. Infographic financial growth decrease illustrations Green cube with arrow up. Business and market growth concept
Free with trial Green cube with arrow up. Business and market growth concept. Close-up. Infographic financial growth decrease illustrations Green cube with arrow up. Business and market growth concept
Free with trial Green cube with arrow up. Business and market growth concept. Close-up. Infographic financial growth decrease illustrations Green cube with arrow up. Business and market growth concept
Free with trial Dual trend line graph bar business growth and decline visualization. Infographic financial growth decrease vectors Profit growth and loss decline business graph bar. Dual trend line graph bar business growth and decline visualization
Free with trial Declining Bar Graph with Downward Arrow Showing Loss or Decrease. Infographic financial growth decrease vectors Declining Bar Graph with Downward Arrow Showing Loss or Decrease
Free with trial Colorful line chart is fluctuating, showing market volatility and growth. Infographic financial growth decrease vectors Gradient line chart showing market volatility and growth. Colorful line chart is fluctuating, showing market volatility and growth
Free with trial A line drawing depicts a money bag, a downward trending graph, and a magnifying glass, symbolizing financial loss. Infographic financial growth decrease illustrations Financial Loss Analysis Money Bag, Downward Graph, Magnifying Glass. A line drawing depicts a money bag, a downward trending graph, and a magnifying glass, symbolizing financial loss.
Free with trial A comprehensive set of icons representing various aspects of business, finance, data analysis, growth, and strategy. Infographic financial growth decrease vectors Collection of Business and Finance Icons for Data Analysis and Growth. A comprehensive set of icons representing various aspects of business, finance, data analysis, growth, and strategy
Free with trial Unemployment line icon of unemployed man on labor market, vector symbol. Economic crisis, global financial downturn and bankruptcy icon of economy recession and unemployment problem. Infographic financial growth decrease vectors Unemployment line icon, economic financial crisis. Unemployment line icon of unemployed man on labor market, vector symbol. Economic crisis, global financial downturn and bankruptcy icon of economy recession and unemployment problem
Free with trial Colorful bar chart visualizing business data, financial growth, and market analysis with a retro aesthetic. Infographic financial growth decrease illustrations Colorful geometric bar chart displaying data visualization progress. Colorful bar chart visualizing business data, financial growth, and market analysis with a retro aesthetic
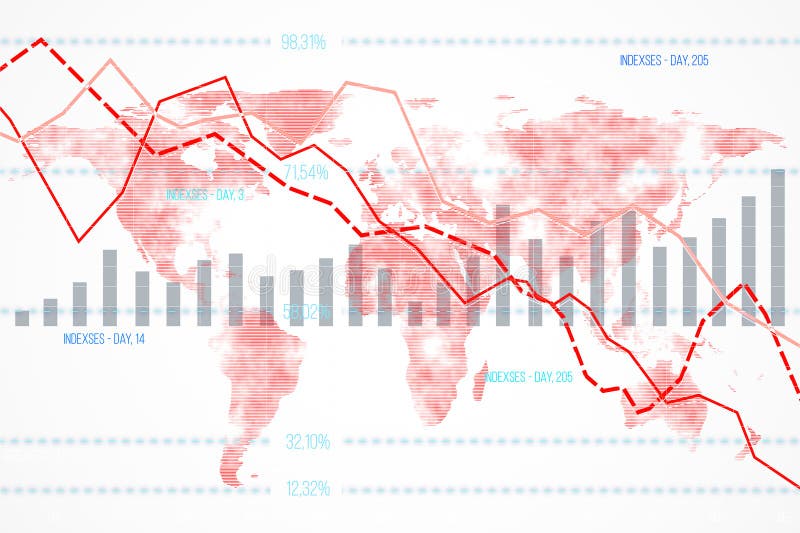
Free with trial Financial data chart featuring declining indexes and bar graphs overlaid on a world map background. Concept of global economic downturn. 3D Rendering. Infographic financial growth decrease illustrations Financial data chart with declining indexes on a world map background. 3D Rendering. Financial data chart featuring declining indexes and bar graphs overlaid on a world map background. Concept of global economic downturn. 3D Rendering
Free with trial Collection of various business and financial chart icons in a modern, flat style, set against a dark blue background. Perfect for infographics, presentations, and websites requiring data visualization elements. Infographic financial growth decrease illustrations Business and Financial Icons Set on Dark Blue Background for Design Elements. Collection of various business and financial chart icons in a modern, flat style, set against a dark blue background. Perfect for infographics, presentations, and websites requiring data visualization elements
Free with trial A visually appealing bar graph illustration against a sleek black background, showcasing business growth, data analysis, and statistical trends. The illustration is suitable for presentations, reports, and web content related to finance, marketing, and technology. Infographic financial growth decrease illustrations Bar Graph Illustration Business Growth, Data Analysis, and Statistics. A visually appealing bar graph illustration against a sleek black background, showcasing business growth, data analysis, and statistical trends. The illustration is suitable for presentations, reports, and web content related to finance, marketing, and technology.
Free with trial Pink bar graph showing a downward trend on a pink background, financial concept. Infographic financial growth decrease illustrations Pink bar graph showing a downward trend on a pink background, financial concept
Free with trial Simple and clean blue gradient line graph is going up and down showing growth and decline over a period of time. Infographic financial growth decrease vectors Blue gradient line graph showing growth and decline over time. Simple and clean blue gradient line graph is going up and down showing growth and decline over a period of time
Free with trial Minimalist vector icons illustrating financial growth, savings, ice cream treat, and energy efficiency. Ideal for business presentations, infographics, and educational materials on economics or sustainability. Infographic financial growth decrease vectors Flat design icons for financial trends and energy consumption concepts. Minimalist vector icons illustrating financial growth, savings, ice cream treat, and energy efficiency. Ideal for business presentations, infographics, and educational materials on economics or sustainability
Free with trial Financial crisis concept with red descending arrow. AI generative. Infographic financial growth decrease illustrations Financial crisis concept with red descending arrow.
Free with trial Financial crisis concept with red descending arrow. AI generative. Infographic financial growth decrease illustrations Financial crisis concept with red descending arrow.
Free with trial Financial crisis concept with red descending arrow. AI generative. Infographic financial growth decrease illustrations Financial crisis concept with red descending arrow.
Free with trial Financial crisis concept with red descending arrow. AI generative. Infographic financial growth decrease illustrations Financial crisis concept with red descending arrow.
Free with trial Financial crisis concept with red descending arrow. AI generative. Infographic financial growth decrease illustrations Financial crisis concept with red descending arrow.
Free with trial Financial crisis concept with red descending arrow. AI generative. Infographic financial growth decrease illustrations Financial crisis concept with red descending arrow.
Free with trial Marketing. A vibrant and modern bar graph with glowing neon colors represents data and business growth. Infographic financial growth decrease illustrations Glowing Bar Graph Data Visualization, Business Growth, Statistics, marketing. marketing. A vibrant and modern bar graph with glowing neon colors represents data and business growth.
Free with trial Minimalist black cloud icon with a bold downward arrow, representing financial loss, market crash, or negative growth. Ideal for business, finance, and economic reports. Infographic financial growth decrease vectors Black cloud with downward arrow symbolizing decline or downturn in business. Minimalist black cloud icon with a bold downward arrow, representing financial loss, market crash, or negative growth. Ideal for business, finance, and economic reports
Free with trial Colorful bar graph showing market growth and success over time. Infographic financial growth decrease vectors Colorful bar graph showing market growth and success
Free with trial A businessman examines a declining cost graph on a laptop, indicating financial analysis and planning Generative AI. Infographic financial growth decrease illustrations Businessman analyzing cost graph on laptop with financial data visualization. A businessman examines a declining cost graph on a laptop, indicating financial analysis and planning Generative AI
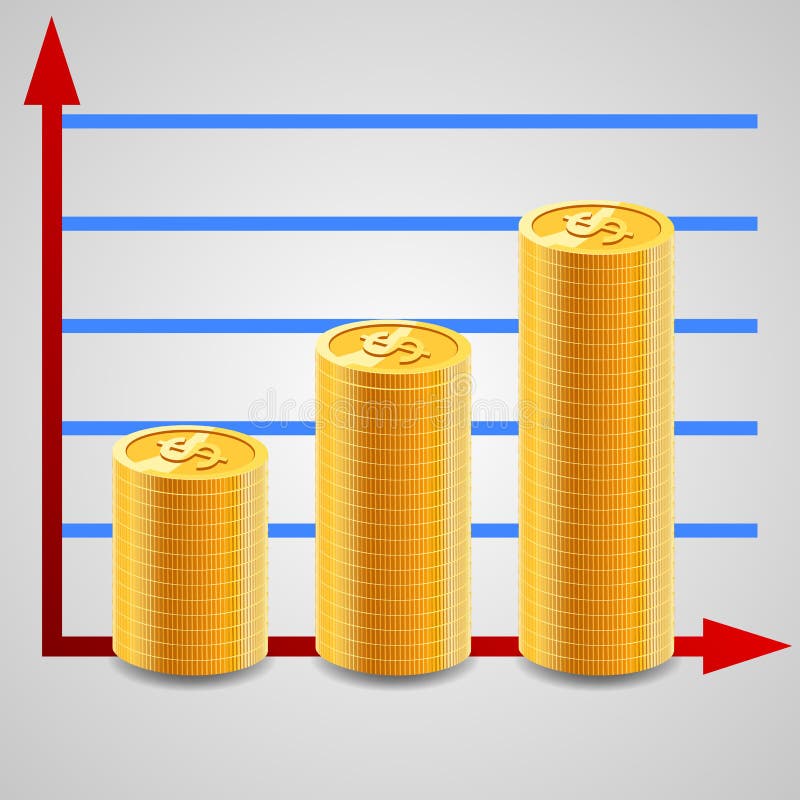
Free with trial Increasing piles of coins with going up graph. Concept for financial growth. illustration. Infographic financial growth decrease vectors Increasing piles of coins with going up graph.
Free with trial The image shows a central upward-pointing red arrow with a percent sign, indicating an increase, flanked by two downward-pointing red arrows on either side, symbolizing decreases or fluctuations in percentage values. This visual metaphor is often used to represent changes in metrics, financial trends, or statistical variations. Infographic financial growth decrease illustrations Graphic illustrating percentage increase and decrease with directional arrows. The image shows a central upward-pointing red arrow with a percent sign, indicating an increase, flanked by two downward-pointing red arrows on either side, symbolizing decreases or fluctuations in percentage values. This visual metaphor is often used to represent changes in metrics, financial trends, or statistical variations
Free with trial Detailed collection of linear icons representing various business trends, financial growth metrics, and candlestick market data. Infographic financial growth decrease vectors Financial business graph and chart line icons for data analysis and kpi tracking. detailed collection of linear icons representing various business trends, financial growth metrics, and candlestick market data
Free with trial A person analyzes a pie chart representing different aspects of the music industry with currency symbols and icons for digital media streaming and content management while a pair of scissors cuts into a segment labeled DECREASE symbolizing financial review and cost cutting measures. Infographic financial growth decrease vectors Business Analysis Evaluating Music Industry Finances and Identifying Cost Reductions. A person analyzes a pie chart representing different aspects of the music industry with currency symbols and icons for digital media streaming and content management while a pair of scissors cuts into a segment labeled DECREASE symbolizing financial review and cost cutting measures
Free with trial A downward trending bar graph in shades of blue, illustrating a financial decline with sleek, minimalistic lines and a clear visual impact. Generative AI. Infographic financial growth decrease vectors Downward trending bar graph in flat design style showcasing financial decline vector illustration. A downward trending bar graph in shades of blue, illustrating a financial decline with sleek, minimalistic lines and a clear visual impact. Generative AI
Free with trial An illustration of a bar graph showing a decline with descending arrow indicating business downturn and financial loss using flat style. Infographic financial growth decrease vectors Financial decline graph with a descending arrow showing losses and market downturns. An illustration of a bar graph showing a decline with descending arrow indicating business downturn and financial loss using flat style
Free with trial Stylized business chart icon depicting financial growth, percentage, and decline. Flat design, blue outline with light blue fill, minimalistic style. Infographic financial growth decrease vectors Business chart icon showing growth, percentage, and decline in a simple outlined style. Stylized business chart icon depicting financial growth, percentage, and decline. Flat design, blue outline with light blue fill, minimalistic style.
Free with trial This is an detailed set of clean line icons for infographic design, corporate data analysis, and finance. Infographic financial growth decrease vectors Clean infographic symbols for corporate data analysis and financial tracking applications. This is an detailed set of clean line icons for infographic design, corporate data analysis, and finance
Free with trial A set of black and white icons representing different types of business and financial charts including bar graphs line graphs and pie charts. Infographic financial growth decrease vectors Collection of various business and financial chart icons including bar graphs line graphs and pie charts. A set of black and white icons representing different types of business and financial charts including bar graphs line graphs and pie charts
Free with trial A striking 3D percentage symbol rendered in an intricate wireframe or mesh design, showcasing a vibrant rainbow gradient. The colors transition smoothly from cool blues and greens to warm reds and purples, creating a dynamic and modern visual. Set against a clean, pure white background, the symbol casts a subtle shadow, adding depth. This eye-catching graphic is ideal for conveying concepts of discounts, sales, growth, statistics, data analysis, financial progress, or any topic requiring a modern, dynamic, and colorful representation of percentages. Perfect for business, marketing, technology, or educational designs. Infographic financial growth decrease illustrations Vibrant Rainbow Wireframe Percentage Symbol on White. A striking 3D percentage symbol rendered in an intricate wireframe or mesh design, showcasing a vibrant rainbow gradient. The colors transition smoothly from cool blues and greens to warm reds and purples, creating a dynamic and modern visual. Set against a clean, pure white background, the symbol casts a subtle shadow, adding depth. This eye-catching graphic is ideal for conveying concepts of discounts, sales, growth, statistics, data analysis, financial progress, or any topic requiring a modern, dynamic, and colorful representation of percentages. Perfect for business, marketing, technology, or educational designs.
Free with trial Close-up view of computer screen with colorful graphs, charts, representing financial, economic data visualization. Stock market analysis, business statistics investment data displayed. Infographic financial growth decrease illustrations Close-up view of computer screen with colorful graphs, charts, representing financial, economic data visualization. Stock market
Free with trial Vibrant financial chart illustrates stock market trends and trading activity. Showcasing investment dynamics with percentage values command signals and statistic data display. Infographic financial growth decrease illustrations Vibrant financial chart illustrates stock market trends and trading activity. Showcasing investment dynamics with percentage
Free with trial Stylized graphics depict market trends with up and down arrows. Flat design with simple shapes for business and financial presentations. Infographic financial growth decrease vectors Stylized infographics illustrating growth and decline with upward and downward arrows on black background. Stylized graphics depict market trends with up and down arrows. Flat design with simple shapes for business and financial presentations.
Free with trial Financial Capability Month Colorful graphs and charts representing financial data analysis on desk. Infographic financial growth decrease illustrations Financial Capability Month Colorful graphs and charts representing financial data analysis on desk
Free with trial Dynamic percentage symbol with circular arrows representing financial change discount or interest rate calculation. Infographic financial growth decrease vectors Dynamic percentage symbol with circular arrows representing financial change discount or interest rate calculation
Free with trial Financial report with a declining bar graph, suggesting a negative trend in business performance. Infographic financial growth decrease vectors Financial report showing declining bar graph and statistics. Financial report with a declining bar graph, suggesting a negative trend in business performance
Free with trial Green up and red down 3d arrow graph showing rising, descending trend, business result, profit or loss symbol symbol. Business arrow, goals concept. 3d world money symbols. Financial growth vector isolated. Infographic financial growth decrease vectors Green up and red down 3d arrow graph showing rising, descending trend, business result, profit. world money symbols. Green up and red down 3d arrow graph showing rising, descending trend, business result, profit or loss symbol symbol. Business arrow, goals concept. 3d world money symbols. Financial growth vector isolated
Free with trial Green up and red down 3d arrow graph showing rising, descending trend, business result, profit or loss symbol symbol. Business arrow, goals concept. 3d world money symbols. Financial growth vector isolated. Infographic financial growth decrease vectors Green up and red down 3d arrow graph showing rising, descending trend, business result, profit. world money symbols. Green up and red down 3d arrow graph showing rising, descending trend, business result, profit or loss symbol symbol. Business arrow, goals concept. 3d world money symbols. Financial growth vector isolated
Free with trial Percent decrease vector design. Consist of down arrow and percent sign, icon or symbol. Concept for percentage of interest rate, loss profit, stock price or discount. Editable line stroke 48x48 px. n. Infographic financial growth decrease vectors Percent decrease vector design, 48x48 pixel perfect and editable stroke. Percent decrease vector design. Consist of down arrow and percent sign, icon or symbol. Concept for percentage of interest rate, loss profit, stock price or discount. Editable line stroke 48x48 px.n
Free with trial Visualize complex market trends and strategy using this metallic, AI-generated bar chart illustration. Perfect for financial reports, planning presentations, and investor materials that require a sophisticated, high-impact visual representation of business growth, decline, and future success. Infographic financial growth decrease illustrations Conceptual 3D business bar chart illustrating market performance, showing initial decline followed by upward growth. Visualize complex market trends and strategy using this metallic, AI-generated bar chart illustration. Perfect for financial reports, planning presentations, and investor materials that require a sophisticated, high-impact visual representation of business growth, decline, and future success.
Free with trial A detailed data visualization illustrating market trends over time. The infographic combines a line chart, which shows fluctuating values and percentages, with a bar chart representing data for specific time intervals. The line chart highlights key data points, such as peaks annotated with values like '1. 24%' and '500K'. The x-axis represents a timeline from January to March, while the y-axis. Infographic financial growth decrease illustrations A modern market trend analysis visualization combining a bar and line chart for financial data isolated on white background. A detailed data visualization illustrating market trends over time. The infographic combines a line chart, which shows fluctuating values and percentages, with a bar chart representing data for specific time intervals. The line chart highlights key data points, such as peaks annotated with values like '1.24%' and '500K'. The x-axis represents a timeline from January to March, while the y-axis
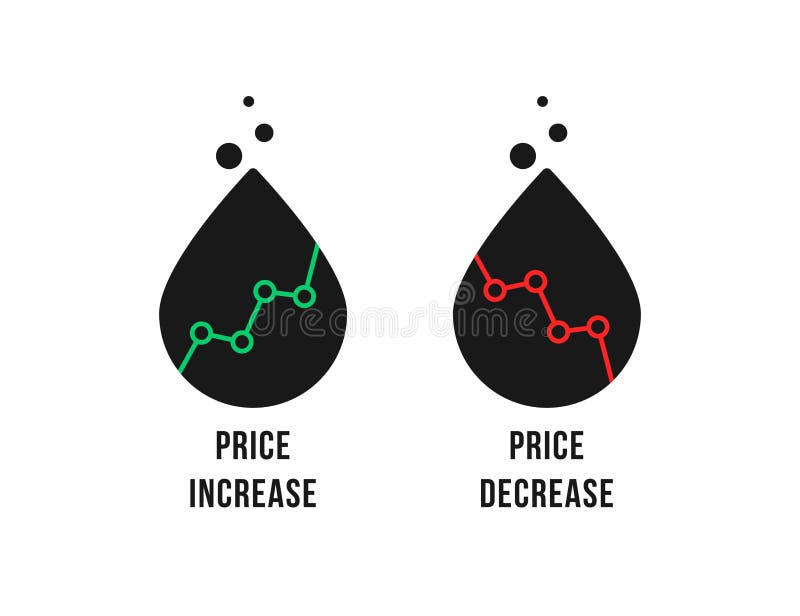
Free with trial Increase and decrease oil price like drops. concept of financial speculation and global glut by opec. flat simple modern logotype graphic infographic design illustration element isolated on white. Infographic financial growth decrease vectors Increase and decrease oil price like drops
Free with trial Linear increase and decrease oil price drops. flat outline modern logotype graphic infographic design illustration element isolated on white. concept of financial speculation and global glut by opec. Infographic financial growth decrease vectors Linear increase and decrease oil price drops
Free with trial These clean, isolated upward and downward green and red arrows are ideal for illustrating various data visualization concepts. Perfect for presentations, reports, infographics, and marketing materials, they effectively communicate growth and decline trends in business, finance, or any field requiring visual representation of progress. The simple, modern design ensures the focus remains on the. Infographic financial growth decrease illustrations Simple Green and Red Arrows Isolated Vector Graphics for Visualizing Growth and Decline Trends in Business Data. These clean, isolated upward and downward green and red arrows are ideal for illustrating various data visualization concepts. Perfect for presentations, reports, infographics, and marketing materials, they effectively communicate growth and decline trends in business, finance, or any field requiring visual representation of progress. The simple, modern design ensures the focus remains on the
Free with trial Sale, discounts, price decrease icon. Tablet pc with arrow and euro sign. Flat design vector illustration. Infographic financial growth decrease vectors Sale, discounts, price decrease icon. Tablet pc with arrow and euro sign. Flat design vector illustration
Free with trial Declining bar graph with trend line symbolizing financial loss or business decrease. Infographic financial growth decrease illustrations Declining Bar Chart with Downward Trend Line Illustration. Declining bar graph with trend line symbolizing financial loss or business decrease.
Free with trial Generative AI, This 3D rendered image depicts a concept of financial decline, showcasing a descending trend of stacked gold coins against a blue background. The image features multiple stacks of gold coins, decreasing in height from left to right, symbolizing a decline in value or profit. A gold arrow graph follows the descending trend, visually representing the downward trajectory. The blue background with a. Infographic financial growth decrease illustrations Financial decline concept - gold coins stacked in a descending trend with a falling arrow graph on blue background. Generative AI, This 3D rendered image depicts a concept of financial decline, showcasing a descending trend of stacked gold coins against a blue background. The image features multiple stacks of gold coins, decreasing in height from left to right, symbolizing a decline in value or profit. A gold arrow graph follows the descending trend, visually representing the downward trajectory. The blue background with a
Free with trial Bearish down economy with red arrow and device open laptop 3D perspective isometric. data infographic data visualization with chart and stats. Infographic financial growth decrease illustrations Bearish down economy with red arrow and device open laptop 3D perspective isometric. infographic data visualization. Bearish down economy with red arrow and device open laptop 3D perspective isometric. data infographic data visualization with chart and stats
Free with trial Money coin decrease vector design. That icon, sign or symbol. Consist of round circle coin, dollars currency sign and drop down arrow. Crisis concept for financial, economy, stock or salary. 48x48 px. Infographic financial growth decrease vectors Money coin decrease vector design. 48x48 pixel perfect and editable line stroke. Money coin decrease vector design. That icon, sign or symbol. Consist of round circle coin, dollars currency sign and drop down arrow. Crisis concept for financial, economy, stock or salary. 48x48 px.
Free with trial Infographic diagram declining trend bar chart,illustration can be used as template in presentation,web banner design,business, economy,statistic flyer and slide. Infographic financial growth decrease illustrations Infographic diagram declining trend bar chart,illustration can be used as template in presentation,web banner design,business
Free with trial Disease growth graph Coronavirus. chart decline in patients. Schedule of recovering and pandemic deaths COVID-19. Infographic financial growth decrease vectors Disease growth graph Coronavirus. chart decline in patients. Schedule of recovering and pandemic deaths COVID-19
Free with trial Disease growth graph Coronavirus. chart decline in patients. Schedule of recovering and pandemic deaths COVID-19. Infographic financial growth decrease vectors Disease growth graph Coronavirus. chart decline in patients. Schedule of recovering and pandemic deaths COVID-19
Free with trial Graph chart infographic report set with statistic arrow data elements for financial market analysis and planning in business performance research for your illustration. Infographic financial growth decrease vectors Graph chart infographic report set
Free with trial Graph chart infographic report set with statistic arrow data elements for financial market analysis and planning in business performance research for your illustration. Infographic financial growth decrease vectors Graph chart infographic report set
Free with trial Graph chart infographic report set with statistic arrow data elements for financial market analysis and planning in business performance research for your illustration. Infographic financial growth decrease vectors Graph chart infographic report set
Free with trial Business investment graph up and down symbol on white background. stock market trend increase and decrease. vector illustration flat design. Infographic financial growth decrease vectors Business investment graph up and down symbol on white background. stock market trend increase and decrease. vector illustration
Free with trial Data analysis, Document and Graph chart line icons set. Infographic timeline. Cashback sign. Magnifying glass, File with diagram, Growth report. Financial transfer. Finance set. Vector. Infographic financial growth decrease vectors Data analysis, Document and Graph chart icons set. Cashback sign. Vector. Data analysis, Document and Graph chart line icons set. Infographic timeline. Cashback sign. Magnifying glass, File with diagram, Growth report. Financial transfer. Finance set. Vector
Free with trial Percent decrease vector design. Consist of down arrow and percent sign, icon or symbol. Concept for percentage of interest rate, loss profit, stock price or discount. Editable line stroke 48x48 px. n. Infographic financial growth decrease vectors Percent decrease vector design, 48x48 pixel perfect and editable stroke. Percent decrease vector design. Consist of down arrow and percent sign, icon or symbol. Concept for percentage of interest rate, loss profit, stock price or discount. Editable line stroke 48x48 px.n
Free with trial Dollar fall and growth icon design. Vector illustration, flat design. Isolated. Infographic financial growth decrease vectors Dollar fall and growth icon design. Vector illustration, flat design. Isolated.
Free with trial Bearish down economy with red arrow and device computer desktop 3D perspective isometric. data infographic data visualization with chart and stats. Infographic financial growth decrease vectors Bearish down economy with red arrow and device computer desktop 3D perspective isometric. data infographic data visualization with
Free with trial Add purchase, Graph chart and Contactless payment icons simple set. Button with halftone dots. Bitcoin project sign. Shopping order, Growth report, Financial payment. Cryptocurrency startup. Vector. Infographic financial growth decrease vectors Add purchase, Graph chart and Contactless payment icons set. Bitcoin project sign. Vector. Add purchase, Graph chart and Contactless payment icons simple set. Button with halftone dots. Bitcoin project sign. Shopping order, Growth report, Financial payment. Cryptocurrency startup. Vector
Free with trial This image shows a financial report with bar graphs and numerical data, generated by AI, suggesting business performance or investment analysis. The document rests on a wooden desk, with coins blurred in the background, hinting at financial matters. Infographic financial growth decrease illustrations Financial Report Analysis. This image shows a financial report with bar graphs and numerical data, generated by AI, suggesting business performance or investment analysis. The document rests on a wooden desk, with coins blurred in the background, hinting at financial matters.
Free with trial Increases growth turquoise concept icon. Savings and deposits. Effect of inflation abstract idea thin line illustration. Isolated outline drawing. Editable stroke. Arial, Myriad Pro-Bold fonts used. Infographic financial growth decrease vectors Increases growth turquoise concept icon
Free with trial Increases growth light blue concept icon. Savings and deposits. Effect of inflation abstract idea thin line illustration. Isolated outline drawing. Editable stroke. Arial, Myriad Pro-Bold fonts used. Infographic financial growth decrease vectors Increases growth light blue concept icon
Free with trial 3D illustration of a bar graph showing a declining trend. Red bars of decreasing height are set against a backdrop of a light gray frame. The image is perfect for presentations, reports, or any visual representation of negative growth, decline, or decrease in data. Suitable for use in business, finance, and educational contexts. Infographic financial growth decrease vectors Declining Trend Bar Graph. 3D illustration of a bar graph showing a declining trend. Red bars of decreasing height are set against a backdrop of a light gray frame. The image is perfect for presentations, reports, or any visual representation of negative growth, decline, or decrease in data. Suitable for use in business, finance, and educational contexts.
Free with trial Finance increase and decrease chart outline and solid icon vector design illustration. Stock market symbol. Infographic financial growth decrease vectors Finance increase and decrease chart outline and solid icon vector