Free with trial A red arrow with a zigzag line falls downward illustrating decrease or loss on a light blue background to represent financial or economic decline. Line decrease illustrations Red Arrow Falling Zigzag Chart. A red arrow with a zigzag line falls downward illustrating decrease or loss on a light blue background to represent financial or economic decline
Free with trial An outline vector icon of a line graph showing a sharp decline, symbolizing falling stock prices or negative market performance. Represents financial downturns, losses, or economic decline. Useful for finance, business analysis, or reporting on market volatility. Emphasizes a significant decrease, vector design Generative AI. Line decrease vectors Falling Stock Market Graph Vector Outline Icon, vector design Generative AI. An outline vector icon of a line graph showing a sharp decline, symbolizing falling stock prices or negative market performance. Represents financial downturns, losses, or economic decline. Useful for finance, business analysis, or reporting on market volatility. Emphasizes a significant decrease, vector design Generative AI
Free with trial Abstract digital illustration of a financial chart. A glowing white line graph rises and falls against a blue background with a grid pattern made of dots. The image conveys concepts of market trends, stock analysis, investment, and economic fluctuations. Suitable for illustrating financial reports, business presentations, and technology-related articles. Line decrease illustrations Abstract Financial Chart with Glowing Line. Abstract digital illustration of a financial chart. A glowing white line graph rises and falls against a blue background with a grid pattern made of dots. The image conveys concepts of market trends, stock analysis, investment, and economic fluctuations. Suitable for illustrating financial reports, business presentations, and technology-related articles.
Free with trial 2D editable blue resenteeism icon, monochromatic isolated vector, thin line illustration representing workplace trends. Line decrease vectors Thin line simple blue resenteeism icon concept. 2D editable blue resenteeism icon, monochromatic isolated vector, thin line illustration representing workplace trends.
Free with trial Upward rightward, downward leftward, upward leftward, and downward rightward icon vector in line style. Line decrease vectors Upward rightward, downward leftward, upward leftward, and downward rightward icon in line style
Free with trial Visualization shifting line graph illustration fluctuation increase, movement change, axis scale visualization shifting line graph. Line decrease illustrations Visualization shifting line graph
Free with trial A simple and clear line icon representing the action of turning the volume down. Line decrease vectors Minimalist Volume Down Line Icon. A simple and clear line icon representing the action of turning the volume down
Free with trial A clean, minimalist 3D render of a blue bar chart with a blue trend line connecting circular data points. The bars vary in height, illustrating growth and fluctuations. The background is a bright, clean white, emphasizing the chart's elements. This graphic is ideal for representing financial data, business growth, market trends, statistics, and performance analysis in a modern and professional style. Line decrease illustrations 3D Blue Bar Chart with Trend Line. A clean, minimalist 3D render of a blue bar chart with a blue trend line connecting circular data points. The bars vary in height, illustrating growth and fluctuations. The background is a bright, clean white, emphasizing the chart's elements. This graphic is ideal for representing financial data, business growth, market trends, statistics, and performance analysis in a modern and professional style.
Free with trial Upward and downward zigzag arrow line icon vector with long shadow. Line decrease vectors Upward and downward zigzag arrow line icon with long shadow
Free with trial Money loss and economic crisis, money market crash and global financial downturn, vector line icons. Economic crisis icons of bankruptcy, price decrease with money inflation and unemployment growth. Line decrease vectors Money loss and economic crisis, money market crash
Free with trial Create a set of 16 vector icons related to finance and business. The style should be simple line art with a minimalist approach. Use a color palette of red and off-white/beige. The icons should include: shopping cart with upward arrow, various bar graphs (increasing and decreasing), piggy bank with coin, upward trending arrows, coins stack with upward arrow, dollar sign with gear, dollar sign in gear, calculator, bank building (classical style), torn dollar bill, credit card, cash money, and currency exchange (dollar and euro). Ensure clean lines and consistent spacing between icons. Line decrease vectors Finance Icons: Vector Line Art Set. Create a set of 16 vector icons related to finance and business. The style should be simple line art with a minimalist approach. Use a color palette of red and off-white/beige. The icons should include: shopping cart with upward arrow, various bar graphs (increasing and decreasing), piggy bank with coin, upward trending arrows, coins stack with upward arrow, dollar sign with gear, dollar sign in gear, calculator, bank building (classical style), torn dollar bill, credit card, cash money, and currency exchange (dollar and euro). Ensure clean lines and consistent spacing between icons.
Free with trial Download line icon. Neumorphic, Orange gradient, 3d pin buttons. Down arrow sign. Discount symbol. Line icons. Neumorphic buttons with outline signs. Vector. Line decrease illustrations Download line icon. Down arrow sign. Line icons. Vector. Download line icon. Neumorphic, Orange gradient, 3d pin buttons. Down arrow sign. Discount symbol. Line icons. Neumorphic buttons with outline signs. Vector
Free with trial Ecology and Environment Line Icons. Line decrease vectors Chemical line icons. Pixel perfect. Ecology and Environment Line Icons
Free with trial 2D editable multicolor resenteeism icon, simple isolated vector, thin line illustration representing workplace trends. Line decrease vectors Thin line simple colorful resenteeism icon concept. 2D editable multicolor resenteeism icon, simple isolated vector, thin line illustration representing workplace trends.
Free with trial Icon flat line colors ribbon discount ten percent, half price,seventy percent and ninety percent, label tag price off. Editable file. Line decrease illustrations Icon flat line colors ribbon discount
Free with trial Trend Line and Candlestick Chart vector Crypto Trading concept colored seamless pattern. Line decrease vectors Trend Line and Candlestick Chart vector Crypto Trading colored seamless pattern
Free with trial A simple and modern black silhouette icon of a business graph, isolated on a white background. This flat vector illustration combines a bar chart with an overlaid line graph, showing a fluctuating trend with a general decline. The graphic symbolizes concepts such as data analysis, financial reporting, market statistics, economic downturn, and business performance metrics. It's an ideal visual element for presentations, infographics, websites, and applications related to finance, economics, and analytics, representing concepts of decrease, loss, or market volatility. Line decrease vectors Business Data Analytics Chart Icon. A simple and modern black silhouette icon of a business graph, isolated on a white background. This flat vector illustration. A simple and modern black silhouette icon of a business graph, isolated on a white background. This flat vector illustration combines a bar chart with an overlaid line graph, showing a fluctuating trend with a general decline. The graphic symbolizes concepts such as data analysis, financial reporting, market statistics, economic downturn, and business performance metrics. It's an ideal visual element for presentations, infographics, websites, and applications related to finance, economics, and analytics, representing concepts of decrease, loss, or market volatility.
Free with trial Abstract graph with zigzag pattern, 3 data points connected by line, hand pointing upwards Generative AI. Line decrease illustrations Abstract graph with zigzag pattern, 3 data points connected by line, hand pointing upwards
Free with trial Abstract graph with zigzag pattern, 3 data points connected by line, hand pointing upwards Vertical Mobile Wallpaper. Line decrease illustrations Abstract graph with zigzag pattern, 3 data points connected by line, hand pointing upwards
Free with trial Abstract graph with zigzag pattern, 3 data points connected by line, hand pointing upwards Vertical Mobile Wallpaper. Line decrease illustrations Abstract graph with zigzag pattern, 3 data points connected by line, hand pointing upwards
Free with trial Abstract graph with zigzag pattern, 3 data points connected by line, hand pointing upwards Vertical Mobile Wallpaper. Line decrease illustrations Abstract graph with zigzag pattern, 3 data points connected by line, hand pointing upwards
Free with trial Abstract graph with zigzag pattern, 3 data points connected by line, hand pointing upwards For Social Media Post Size. Line decrease illustrations Abstract graph with zigzag pattern, 3 data points connected by line, hand pointing upwards
Free with trial Checklist line icon. Neumorphic, Green gradient, 3d pin buttons. Graph chart sign. Growth diagram symbol. Line icons. Neumorphic buttons with outline signs. Vector. Line decrease vectors Checklist line icon. Graph chart sign. Line icons. Vector. Checklist line icon. Neumorphic, Green gradient, 3d pin buttons. Graph chart sign. Growth diagram symbol. Line icons. Neumorphic buttons with outline signs. Vector
Free with trial Icon line ribbon discount ten percent, half price,seventy percent and ninety percent, label tag price off. Editable file. Line decrease illustrations Icon line ribbon discount
Free with trial Co2, carbon emission reducing line icon, eps 10 file, easy to edit. Line decrease vectors Co2, carbon emission reducing line icon
Free with trial Line graph is representing market trend with data points. Line decrease vectors Line graph showing market trend with data points. Line graph is representing market trend with data points
Free with trial A colored outline vector icon of a line graph showing a downward trend, indicating a decrease or decline. Represents financial trends, statistics, losses, or negative performance. Useful for finance, business reports, or data visualization showing reduction. Illustrates a declining value over time, vector design Generative AI. Line decrease vectors Decreasing Trend Stock Market Graph Vector, vector design Generative AI. A colored outline vector icon of a line graph showing a downward trend, indicating a decrease or decline. Represents financial trends, statistics, losses, or negative performance. Useful for finance, business reports, or data visualization showing reduction. Illustrates a declining value over time, vector design Generative AI
Free with trial Downward thick arrow white linear icon for dark theme. Pointer symbolizing direction or download. Falling down. Decrease. Thin line illustration. Isolated symbol for night mode. Editable stroke. Line decrease vectors Downward thick arrow white linear icon for dark theme
Free with trial Web report line icon. Neumorphic, Red gradient, 3d pin buttons. Column graph sign. Growth diagram symbol. Line icons. Neumorphic buttons with outline signs. Vector. Line decrease illustrations Web report line icon. Column graph sign. Line icons. Vector. Web report line icon. Neumorphic, Red gradient, 3d pin buttons. Column graph sign. Growth diagram symbol. Line icons. Neumorphic buttons with outline signs. Vector
Free with trial Simple up and down arrow line icon vector on black circle. Line decrease vectors Simple up and down arrow line icon on black circle
Free with trial Upward and downward zigzag arrow line icon vector on square background. Line decrease vectors Upward and downward zigzag arrow line icon on square background
Free with trial Upward and downward zigzag arrow line icon vector on circle background. Line decrease vectors Upward and downward zigzag arrow line icon on circle background
Free with trial Co2, carbon offset line icon, eps 10 file, easy to edit. Line decrease vectors Co2, carbon offset line icon
Free with trial This simple icon depicts a line graph with one line trending upwards and one trending downwards. Line decrease vectors Line graph showing upward and downward trends icon. This simple icon depicts a line graph with one line trending upwards and one trending downwards
Free with trial A red line graph with an arrow is trending downward, signifying loss or failure for financial reporting. Line decrease illustrations Red Line Graph Decreasing. A red line graph with an arrow is trending downward, signifying loss or failure for financial reporting
Free with trial Graph phone line icon. Neumorphic, Red gradient, 3d pin buttons. Column chart sign. Growth diagram symbol. Line icons. Neumorphic buttons with outline signs. Vector. Line decrease vectors Graph phone line icon. Column chart sign. Line icons. Vector. Graph phone line icon. Neumorphic, Red gradient, 3d pin buttons. Column chart sign. Growth diagram symbol. Line icons. Neumorphic buttons with outline signs. Vector
Free with trial Arrow down icon Black line art vector in black and white outline set collection sign. Line decrease vectors Arrow down icon Thin line flat illustration. Arrow down icon Black line art vector in black and white outline set collection sign
Free with trial Reducing waste line icon with a trash bin, eps 10 file, easy to edit. Line decrease vectors Reducing waste line icon with a trash bin
Free with trial A yellow downward trending line is depicted on a dark background, suggesting a negative trend or decline in data presentation. Line decrease illustrations Downward Chart Line on Black Background. A yellow downward trending line is depicted on a dark background, suggesting a negative trend or decline in data presentation
Free with trial Graph laptop line icon. Neumorphic, Purple gradient, 3d pin buttons. Column chart sign. Growth diagram symbol. Line icons. Neumorphic buttons with outline signs. Vector. Line decrease vectors Graph laptop line icon. Column chart sign. Line icons. Vector. Graph laptop line icon. Neumorphic, Purple gradient, 3d pin buttons. Column chart sign. Growth diagram symbol. Line icons. Neumorphic buttons with outline signs. Vector
Free with trial Growth chart line icon. Neumorphic, Blue gradient, 3d pin buttons. Column graph sign. Market analytics symbol. Line icons. Neumorphic buttons with outline signs. Vector. Line decrease vectors Growth chart line icon. Column graph sign. Line icons. Vector. Growth chart line icon. Neumorphic, Blue gradient, 3d pin buttons. Column graph sign. Market analytics symbol. Line icons. Neumorphic buttons with outline signs. Vector
Free with trial Trend Line and Candlestick Chart vector Crypto Trading concept colored icon or design element. Line decrease vectors Trend Line and Candlestick Chart vector Crypto Trading colored icon or design element
Free with trial 100 commerce icons set. Color line set of commerce vector icons thin line color flat on white. Line decrease vectors 100 commerce icons set, color line style. 100 commerce icons set. Color line set of commerce vector icons thin line color flat on white
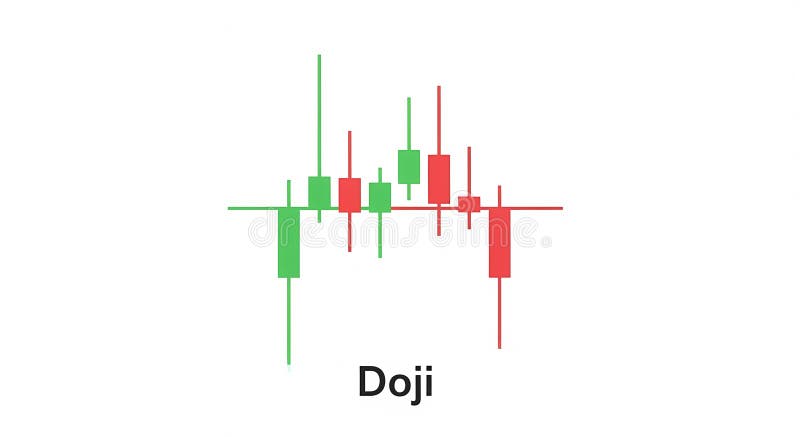
Free with trial The image depicts a candlestick chart pattern, specifically showcasing the "doji" formation. the chart consists of several candlesticks, some green (indicating a price increase) and some red (indicating a price decrease). a horizontal line runs through the center of the candlesticks, representing the opening and closing prices being nearly equal. the candlesticks have wicks or shadows extending above and below the body, showing the high and low prices for the period. the overall pattern suggests indecision in the market, where buyers and sellers are in equilibrium. Line decrease illustrations Candlestick chart pattern: doji formation. the image depicts a candlestick chart pattern, specifically showcasing the "doji" formation. the chart consists of several candlesticks, some green (indicating a price increase) and some red (indicating a price decrease). a horizontal line runs through the center of the candlesticks, representing the opening and closing prices being nearly equal. the candlesticks have wicks or shadows extending above and below the body, showing the high and low prices for the period. the overall pattern suggests indecision in the market, where buyers and sellers are in equilibrium.
Free with trial A simple vector icon of a horizontal line, representing a minus button or subtraction function. Ideal for quantity adjustments, removing items, scaling down, or decreasing values in digital interfaces. Provides an intuitive control for reduction, enhancing user interaction with precise adjustments, vector design Generative AI. Line decrease vectors Subtract Button Icon, Quantity Decrease, vector design Generative AI. A simple vector icon of a horizontal line, representing a minus button or subtraction function. Ideal for quantity adjustments, removing items, scaling down, or decreasing values in digital interfaces. Provides an intuitive control for reduction, enhancing user interaction with precise adjustments, vector design Generative AI
Free with trial Multiple line charts showing data trends over months on a grid background. Concept of data analysis and financial growth. 3D Rendering. Line decrease illustrations Multiple line charts showing data trends over months on grid background. 3D Rendering. Multiple line charts showing data trends over months on a grid background. Concept of data analysis and financial growth. 3D Rendering
Free with trial Economic crisis line icons of global financial downturn and business bankruptcy, vector banner. Money loss and banking crisis icons of depreciation, unemployment and price decrease of pandemic crisis. Line decrease vectors Economic crisis icons of global financial downturn. Economic crisis line icons of global financial downturn and business bankruptcy, vector banner. Money loss and banking crisis icons of depreciation, unemployment and price decrease of pandemic crisis
Free with trial Methane, CH4 emissions reduction line icon, eps 10 file, easy to edit. Line decrease vectors Methane, CH4 emissions reduction line icon
Free with trial Hand drawn down arrow featuring a squiggly line, pointing downwards in a simple and minimalistic vector illustration set against a clean white background. Line decrease vectors Hand drawn down arrow featuring a squiggly line, pointing downwards in a simple and minimalistic vector illustration set
Free with trial Colourful decrease arrow chart icon template. Business icon. Line decrease vectors Colourful decrease arrow chart icon template
Free with trial A downward-trending red line graph overlays a dark screen displaying financial data with glowing red and green numbers. Image. Line decrease illustrations Stock Market Ticker with Red Decline Line. A downward-trending red line graph overlays a dark screen displaying financial data with glowing red and green numbers. Image
Free with trial A clear red minus sign icon, symbolizing decrease, negative value, subtraction, or removal. This graphic is suitable for data visualization, financial reports, or interactive user interfaces. High-quality vector, vector design Generative AI. Line decrease vectors Red minus sign, decrease negative symbol, vector design Generative AI. A clear red minus sign icon, symbolizing decrease, negative value, subtraction, or removal. This graphic is suitable for data visualization, financial reports, or interactive user interfaces. High-quality vector, vector design Generative AI
Free with trial Up and down direction arrow icon set on circle line. Upward and downward concept. Line decrease vectors Up and down direction arrow icon set on circle line
Free with trial This icon represents a decrease trend with multiple arrows pointing down. Line decrease vectors Arrows pointing down representing decrease trend icon. This icon represents a decrease trend with multiple arrows pointing down
Free with trial Line graph is representing a market trend with decreasing values. Line decrease vectors Line graph showing market trend with decreasing values. Line graph is representing a market trend with decreasing values
Free with trial Bitcoin chart icons set outline vector. Benefit fintech. Cash coin thin line color flat on white. Line decrease vectors Bitcoin chart icons set vector color line. Bitcoin chart icons set outline vector. Benefit fintech. Cash coin thin line color flat on white
Free with trial A clear vector icon of a minus sign with a magnifying glass, symbolizing zoom out, decrease view, or subtract function. Ideal for image editing, map navigation, and data analysis, this design allows users to reduce magnification or remove elements, providing versatile control over content display, vector design Generative AI. Line decrease vectors Zoom Out: Decrease View and Subtract Icon, vector design Generative AI. A clear vector icon of a minus sign with a magnifying glass, symbolizing zoom out, decrease view, or subtract function. Ideal for image editing, map navigation, and data analysis, this design allows users to reduce magnification or remove elements, providing versatile control over content display, vector design Generative AI
Free with trial Economic Loss icon Black line art vector in black and white outline set collection sign. Line decrease vectors Economic Loss icon Black line art vector logo set. Economic Loss icon Black line art vector in black and white outline set collection sign
Free with trial A simple line icon illustration of an arrow pointing down to a coin with a dollar sign on it. Represents money deposit, investment, or savings. Line decrease vectors Simple Line Arrow Coin Dollar Currency Icon. A simple line icon illustration of an arrow pointing down to a coin with a dollar sign on it. Represents money deposit, investment, or savings.
Free with trial Coupon with discount showing graph going down, simple black line vector icon. Line decrease illustrations Coupon with discount showing graph going down line icon. Coupon with discount showing graph going down, simple black line vector icon
Free with trial A simple flat design vector icon featuring a white minus symbol on a blue circle. Represents subtraction, reduction, removal, or negative value. A fundamental graphic for calculations, quantity adjustments, or UI elements indicating decrease or removal of items, vector design Generative AI. Line decrease vectors Minus Symbol Icon Vector, Decrease Remove Symbol in Flat Design, vector design Generative AI. A simple flat design vector icon featuring a white minus symbol on a blue circle. Represents subtraction, reduction, removal, or negative value. A fundamental graphic for calculations, quantity adjustments, or UI elements indicating decrease or removal of items, vector design Generative AI
Free with trial A hand in a black suit sleeve points downward against a red background. The hand is prominently featured in the foreground, emphasizing direction. Behind it, a red zigzag line graph with an arrow points downward, symbolizing decline or reduction. The red background accentuates the theme of loss or decrease, commonly associated with financial or performance downturns. The image combines elements of business attire with graphical data representation, conveying a message of falling trends or negative outcomes. Line decrease illustrations A hand in a black suit sleeve points downward against a red background. The hand
Free with trial Pyramid chart line icon. Neumorphic, Orange gradient, 3d pin buttons. Analytics graph sign. Market analytics symbol. Line icons. Neumorphic buttons with outline signs. Vector. Line decrease vectors Pyramid chart line icon. Analytics graph sign. Line icons. Vector. Pyramid chart line icon. Neumorphic, Orange gradient, 3d pin buttons. Analytics graph sign. Market analytics symbol. Line icons. Neumorphic buttons with outline signs. Vector
Free with trial Decreasing graph line icon. Neumorphic, Green gradient, 3d pin buttons. Column chart sign. Crisis diagram symbol. Line icons. Neumorphic buttons with outline signs. Vector. Line decrease illustrations Decreasing graph line icon. Crisis chart sign. Line icons. Vector. Decreasing graph line icon. Neumorphic, Green gradient, 3d pin buttons. Column chart sign. Crisis diagram symbol. Line icons. Neumorphic buttons with outline signs. Vector
Free with trial Reduction chart icon Black line art vector in black and white outline set collection sign. Line decrease vectors Reduction chart icon Thin line flat illustration. Reduction chart icon Black line art vector in black and white outline set collection sign
Free with trial Decreasing graph line icon. Neumorphic, Purple gradient, 3d pin buttons. Column chart sign. Market analytics symbol. Line icons. Neumorphic buttons with outline signs. Vector. Line decrease vectors Decreasing graph line icon. Column chart sign. Line icons. Vector. Decreasing graph line icon. Neumorphic, Purple gradient, 3d pin buttons. Column chart sign. Market analytics symbol. Line icons. Neumorphic buttons with outline signs. Vector
Free with trial Decrease graph icon in generic style. Statistic illustration concept. Line decrease vectors Decrease graph icon in generic style. Statistic concept. Decrease graph icon in generic style. Statistic illustration concept
Free with trial A minimalist line drawing of a bar chart, representing data, statistics and growth. Simple, bold and clean graphic icon. Line decrease vectors Simple Line Chart Bar Statistic Graphic Icon. A minimalist line drawing of a bar chart, representing data, statistics and growth. Simple, bold and clean graphic icon.
Free with trial The image shows a downward trending line, illuminated with a bright blue glow, resembling a graph or chart. the line starts high on the left and descends diagonally to the lower right, ending in an arrow pointing downwards. the background is a dark, metallic texture, lit by several spotlights from above, creating a dramatic effect. the floor reflects the blue light, adding depth to the scene. the overall impression is one of decline or failure, possibly related to business or finance. Line decrease illustrations Declining trend line with arrow in spotlight. the image shows a downward trending line, illuminated with a bright blue glow, resembling a graph or chart. the line starts high on the left and descends diagonally to the lower right, ending in an arrow pointing downwards. the background is a dark, metallic texture, lit by several spotlights from above, creating a dramatic effect. the floor reflects the blue light, adding depth to the scene. the overall impression is one of decline or failure, possibly related to business or finance.
Free with trial Report statistics line icon. Neumorphic, Green gradient, 3d pin buttons. Column graph sign. Growth diagram symbol. Line icons. Neumorphic buttons with outline signs. Vector. Line decrease vectors Report statistics line icon. Column graph sign. Line icons. Vector. Report statistics line icon. Neumorphic, Green gradient, 3d pin buttons. Column graph sign. Growth diagram symbol. Line icons. Neumorphic buttons with outline signs. Vector
Free with trial Upward rightward, downward leftward, upward leftward, and downward rightward arrow line icon vector on black circle. Line decrease vectors Upward rightward, downward leftward, upward leftward, and downward rightward arrow line icon on black circle
Free with trial Dollar arrow up and down icon on circle line. USD growth and decline concept vector. Line decrease vectors Dollar arrow up and down icon on circle line. USD growth and decline concept
Free with trial Icon showing a laptop with a downward zigzag arrow on the screen, symbolizing a decline or decrease. Black outline design with a shadow extending to the left on a white background. Minimalistic and modern style. Line decrease vectors Icon showing a laptop with a downward zigzag arrow on the screen, symbolizing a decline or decrease
Free with trial A red line graph trends downward against a dark background, suggesting a decline or negative trend, which can be used in business presentations or financial reports. Line decrease illustrations Decreasing Red Line Graph on Black Background. A red line graph trends downward against a dark background, suggesting a decline or negative trend, which can be used in business presentations or financial reports
Free with trial 100 cryptocurrency icons set. Color line set of cryptocurrency vector icons thin line color flat on white. Line decrease illustrations 100 cryptocurrency icons set, color line style. 100 cryptocurrency icons set. Color line set of cryptocurrency vector icons thin line color flat on white
Free with trial A simple horizontal bar icon in flat design, typically representing minus, remove, decrease, or subtraction. Used in numerical inputs, quantity controls, or editing interfaces to reduce a value or item. Clear and intuitive for user adjustments, vector design Generative AI. Line decrease vectors Minus Bar Remove Decrease Flat Design UI UX Element, vector design Generative AI. A simple horizontal bar icon in flat design, typically representing minus, remove, decrease, or subtraction. Used in numerical inputs, quantity controls, or editing interfaces to reduce a value or item. Clear and intuitive for user adjustments, vector design Generative AI