Free with trial Illustration of up and down percentage arrow line icon. Percentage arrow with percent sign. Design concept for banking, credit, interest rates, finance and financial fields. isolated white background. Line decrease illustrations Illustration of up and down percentage arrow line icon.
Free with trial This image shows a house with a dollar sign inside and downward arrows, symbolizing a decrease in property value. It represents financial loss in real estate market. Line decrease vectors Vector art of house with dollar sign and downward arrows, indicating property value decrease. This image shows a house with a dollar sign inside and downward arrows, symbolizing a decrease in property value. It represents financial loss in real estate market
Free with trial Grey line Property and housing market collapse icon isolated seamless pattern on white background. Falling property prices. Real estate stock risk or economic recession. Vector. Line decrease illustrations Grey line Property and housing market collapse icon isolated seamless pattern on white background. Falling property
Free with trial Illustration of up and down percentage arrow line icon. Percentage arrow with percent sign. Design concept for banking, credit, interest rates, finance and financial fields. isolated white background. Line decrease illustrations Illustration of up and down percentage arrow line icon.
Free with trial Illustration of up and down percentage arrow line icon. Percentage arrow with percent sign. Design concept for banking, credit, interest rates, finance and financial fields. isolated white background. Line decrease illustrations Illustration of up and down percentage arrow line icon.
Free with trial Illustration of up and down percentage arrow line icon. Percentage arrow with percent sign. Design concept for banking, credit, interest rates, finance and financial fields. isolated white background. Line decrease illustrations Illustration of up and down percentage arrow line icon.
Free with trial Illustration of up and down percentage arrow line icon. Percentage arrow with percent sign. Design concept for banking, credit, interest rates, finance and financial fields. isolated white background. Line decrease illustrations Illustration of up and down percentage arrow line icon.
Free with trial Illustration of up and down percentage arrow line icon. Percentage arrow with percent sign. Design concept for banking, credit, interest rates, finance and financial fields. isolated white background. Line decrease illustrations Illustration of up and down percentage arrow line icon.
Free with trial Illustration of up and down percentage arrow line icon. Percentage arrow with percent sign. Design concept for banking, credit, interest rates, finance and financial fields. isolated white background. Line decrease illustrations Illustration of up and down percentage arrow line icon.
Free with trial Illustration of up and down percentage arrow line icon. Percentage arrow with percent sign. Design concept for banking, credit, interest rates, finance and financial fields. isolated white background. Line decrease illustrations Illustration of up and down percentage arrow line icon.
Free with trial Illustration of up and down percentage arrow line icon. Percentage arrow with percent sign. Design concept for banking, credit, interest rates, finance and financial fields. isolated white background. Line decrease illustrations Illustration of up and down percentage arrow line icon.
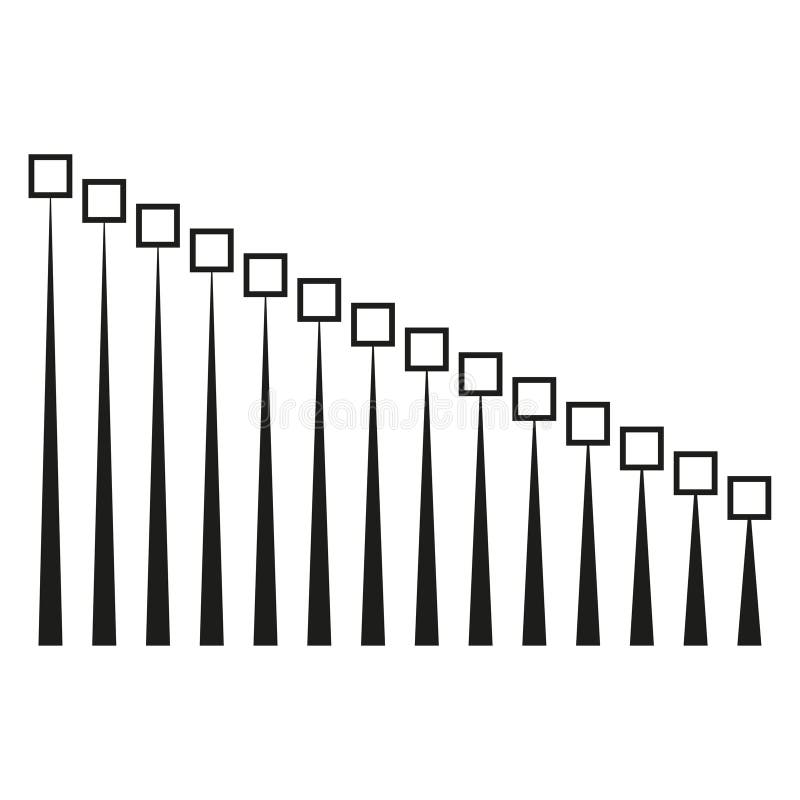
Free with trial Decreasing line graphic. Square point Vector. Minimalist progress chart. Data sequence illustration. EPS 10. Line decrease vectors Decreasing line graphic. Square point Vector. Minimalist progress chart. Data sequence illustration.
Free with trial Loan interest rate doodle icon set. Hand drawn sketch doodle line style bank money loan interest rate icon for house, car discount percentage concept. Trendy cute element. Vector illustration. Line decrease vectors Loan interest rate doodle icon set. Hand drawn sketch doodle line style bank money loan interest rate icon for house
Free with trial Loan interest rate doodle icon set. Hand drawn sketch doodle line style bank money loan interest rate icon for house, car discount percentage concept. Trendy cute element. Vector illustration. Line decrease vectors Loan interest rate doodle icon set. Hand drawn sketch doodle line style bank money loan interest rate icon for house
Free with trial Loan interest rate doodle icon set. Hand drawn sketch doodle line style bank money loan interest rate icon for house, car discount percentage concept. Trendy cute element. Vector illustration. Line decrease vectors Loan interest rate doodle icon set. Hand drawn sketch doodle line style bank money loan interest rate icon for house
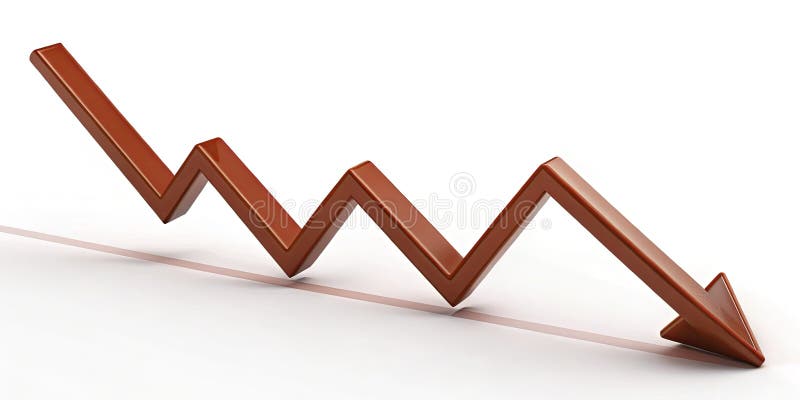
Free with trial This compelling red zigzag line graph vividly illustrates a downward market trend, offering a concise yet insightful representation of declining stock prices. The dynamic zigzag pattern clearly highlights fluctuations and sharp drops in the data, making it an ideal tool for visualizing market analysis and economic indicators. The falling red line graph effectively communicates the negative. Line decrease illustrations Analyzing a Declining Market Trend Visualizing Falling Stock Prices with a Red Zigzag Line Graph. This compelling red zigzag line graph vividly illustrates a downward market trend, offering a concise yet insightful representation of declining stock prices. The dynamic zigzag pattern clearly highlights fluctuations and sharp drops in the data, making it an ideal tool for visualizing market analysis and economic indicators. The falling red line graph effectively communicates the negative
Free with trial Loan interest rate doodle icon set. Hand drawn sketch doodle line style bank money loan interest rate icon for house, car discount percentage concept. Trendy cute element. Vector illustration. Line decrease vectors Loan interest rate doodle icon set. Hand drawn sketch doodle line style bank money loan interest rate icon for house
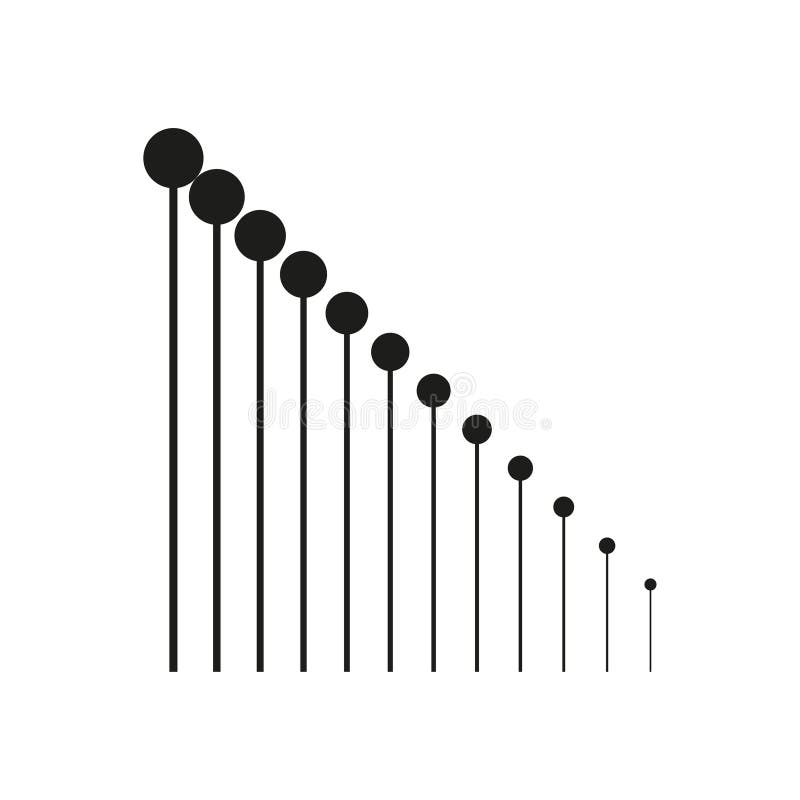
Free with trial Decreasing line graphic. Circle point Vector. Minimalist growth chart. Data progression illustration. EPS 10. Line decrease vectors Decreasing line graphic. Circle point Vector. Minimalist growth chart. Data progression illustration.
Free with trial Clock With Up And Down Arrows Line And Solid Icon Set. Time Management, Scheduling, And Priority Adjustment Symbol Collection. Efficiency And Productivity Enhancement. Isolated Vector Illustration. Line decrease vectors Clock With Up And Down Arrows Line And Solid Icon Set. Time Management, Scheduling, And Priority Adjustment Symbol
Free with trial Set line Old hourglass with sand, Arrow, Location, Layers, Clock, Intersection point and icon. Vector. Line decrease illustrations Set line Old hourglass with sand, Arrow, Location, Layers, Clock, Intersection point and icon. Vector
Free with trial Percentage arrow up and down icon on circle line. Percent growth and decline sign symbol vector. Line decrease vectors Percentage arrow up and down icon on circle line. Percent growth and decline sign symbol
Free with trial This image shows a falling graph behind a diamond, representing the decrease in the value of precious stones. It's suitable for illustrating financial losses. Line decrease vectors Illustration of a falling graph behind a diamond, symbolizing a decrease in the value of precious stones. This image shows a falling graph behind a diamond, representing the decrease in the value of precious stones. It's suitable for illustrating financial losses
Free with trial Percent up and down icon on circle line. Percentage arrow growth and decline sign symbol vector. Line decrease vectors Percent up and down icon on circle line. Percentage arrow growth and decline sign symbol
Free with trial Next economic recession forecast or prediction, stock market decline or revenue decrease, low performance or GDP falling down concept, businessman investor look through telescope to see despair graph. Line decrease vectors Next economic recession forecast or prediction, stock market decline or revenue decrease, low performance or GDP falling down
Free with trial Next economic recession forecast or prediction, stock market decline or revenue decrease, low performance or GDP falling down concept, businesswoman investor look through telescope to see despair graph. Line decrease vectors Next economic recession forecast or prediction, stock market decline or revenue decrease, low performance or GDP falling down
Free with trial Growth chart line icon. Halftone dotted pattern. Gradient icon with grain shadow. Column graph sign. Market analytics symbol. Line growth chart icon. Various designs. Vector. Line decrease vectors Growth chart line icon. Column graph sign. Halftone dotted pattern. Vector. Growth chart line icon. Halftone dotted pattern. Gradient icon with grain shadow. Column graph sign. Market analytics symbol. Line growth chart icon. Various designs. Vector
Free with trial Percent arrow up and down icon on circle line. Percentage growth and decline sign symbol vector. Line decrease vectors Percent arrow up and down icon on circle line. Percentage growth and decline sign symbol
Free with trial Inventory cart, Snowflake and 3d chart minimal line icons. Neon laser 3d lights. People icons. For web, application, printing. Warehouse goods, Snow, Presentation column. Support job. Vector. Line decrease vectors Inventory cart, Snowflake and 3d chart minimal line icons. For web application, printing. Neon laser 3d lights. Vector. Inventory cart, Snowflake and 3d chart minimal line icons. Neon laser 3d lights. People icons. For web, application, printing. Warehouse goods, Snow, Presentation column. Support job. Vector
Free with trial The image is a digital illustration of a stock market chart. The chart is blue in color and has a line graph in the center. The line graph shows a downward trend, indicating a decrease in the stock market. On the top left corner of the chart, there is a white text that reads "10. 03570". The background of the image is made up of small white dots, which are scattered across the chart. Line decrease illustrations The image is a digital illustration of a stock market chart. The chart is blue in color and has a line graph in the center.
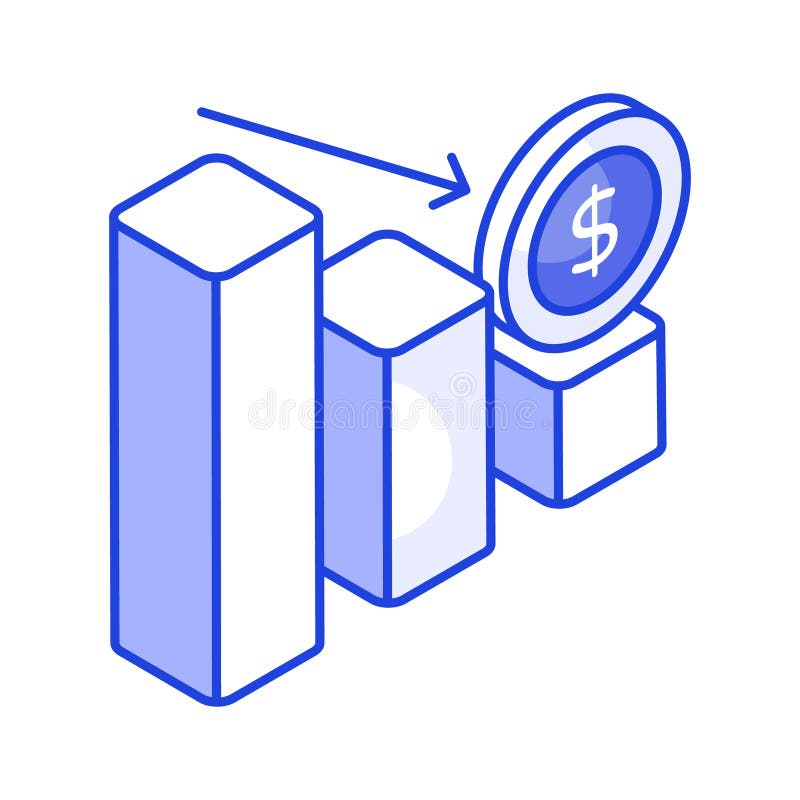
Free with trial Down chart, financial loss, decrease chart isometric vector design. Line decrease vectors Down chart, financial loss, decrease chart isometric vector design
Free with trial Minus sign icon in flat design style with long shadow representing removal subtraction or decrease. Line decrease vectors Minus sign icon in flat design style with long shadow representing removal subtraction or decrease
Free with trial Down chart, financial loss, decrease chart isometric vector design. Line decrease vectors Down chart, financial loss, decrease chart isometric vector design
Free with trial Diagram graph line icon. Halftone dotted pattern. Gradient icon with grain shadow. Column chart sign. Market analytics symbol. Line diagram graph icon. Various designs. Vector. Line decrease illustrations Diagram graph line icon. Column chart sign. Halftone dotted pattern. Vector. Diagram graph line icon. Halftone dotted pattern. Gradient icon with grain shadow. Column chart sign. Market analytics symbol. Line diagram graph icon. Various designs. Vector
Free with trial Diagram graph line icon. Halftone dotted pattern. Gradient icon with grain shadow. Column chart sign. Market analytics symbol. Line diagram graph icon. Various designs. Vector. Line decrease illustrations Diagram graph line icon. Column chart sign. Halftone dotted pattern. Vector. Diagram graph line icon. Halftone dotted pattern. Gradient icon with grain shadow. Column chart sign. Market analytics symbol. Line diagram graph icon. Various designs. Vector
Free with trial Diagram chart line icon. Halftone dotted pattern. Gradient icon with grain shadow. Column graph sign. Market analytics symbol. Line diagram chart icon. Various designs. Vector. Line decrease vectors Diagram chart line icon. Column graph sign. Halftone dotted pattern. Vector. Diagram chart line icon. Halftone dotted pattern. Gradient icon with grain shadow. Column graph sign. Market analytics symbol. Line diagram chart icon. Various designs. Vector
Free with trial Chart icons for data analysis vector art design, Minimalist business charts icons bar graphs, line graphs, and pie charts vector illustration on white background the image is generated using AI. Line decrease vectors Chart icons for data analysis vector art design, Minimalist business charts icons bar graphs, line graphs, and pie charts vector
Free with trial Inflation or interest rate falling down, decrease or reduction, profit fall in economic recession, stock market value loss, FED reduce interest rate, businessman on percentage sign with falling down. Line decrease vectors Inflation or interest rate falling down, decrease or reduction, profit fall in economic recession, stock market value loss, FED
Free with trial Inflation or interest rate falling down, decrease or reduction, profit fall in economic recession, stock market value loss, FED reduce interest rate, businessman on percentage sign with falling down. Line decrease vectors Inflation or interest rate falling down, decrease or reduction, profit fall in economic recession, stock market value loss, FED
Free with trial Business Analytics And Data Visualization Line Icon Set. Financial Growth, Market Trends, And Performance Analysis Outline Symbol Collection. Editable Stroke. Isolated Vector Illustration. Line decrease vectors Business Analytics And Data Visualization Line Icon Set. Financial Growth, Market Trends, And Performance Analysis
Free with trial Set line Global economic crisis, and Calculation of expenses on seamless pattern. Vector. Line decrease illustrations Set line Global economic crisis, and Calculation of expenses on seamless pattern. Vector
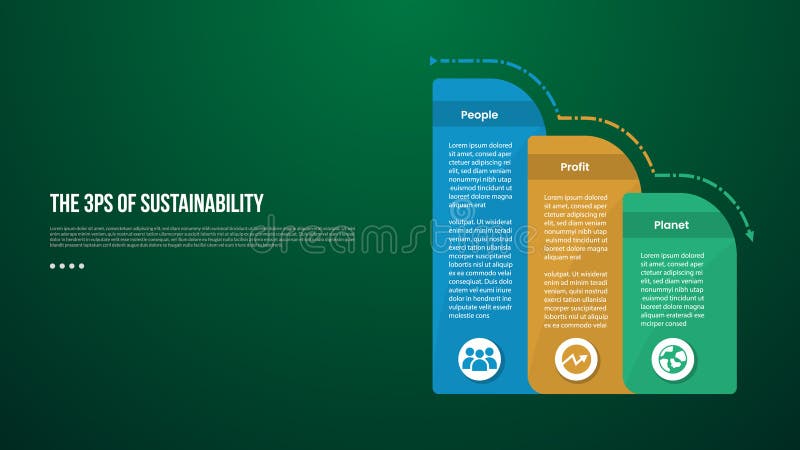
Free with trial The 3 Ps of Sustainability infographic template with round box container decrease gradually with dark background style with 3 point for slide presentation vector. Line decrease illustrations The 3 Ps of Sustainability infographic template with round box container decrease gradually with dark background style with 3
Free with trial Percentage growth and decline icons set. Percent arrow up and down flat and line style symbols collection - stock vector. Line decrease illustrations Percentage growth and decline icons set. Percent arrow up and down flat and line style symbols collection - stock vector
Free with trial Reduction chart icon Black line art vector in black and white outline set collection sign. Line decrease vectors Decline Chart Icon Illustrating Decrease in Performance, Economic Downturn, and Analytical Data. Reduction chart icon Black line art vector in black and white outline set collection sign
Free with trial Control line icon. Touchscreen interface, intuitive operation, increase, decrease, collapse, expand. Neomorphism style. Vector line icon for business and advertising. Line decrease vectors Control line icon. Touchscreen interface, intuitive operation, increase, decrease, collapse, expand. Neomorphism style. Vector
Free with trial Declining bar graph illustrating business recession trend or financial downturn with line chart overlay. Line decrease vectors Declining bar graph illustrating business recession trend or financial downturn with line chart overlay
Free with trial Set Isometric line Global economic crisis, Mobile stock trading, and Briefcase icon. Vector. Line decrease illustrations Set Isometric line Global economic crisis, Mobile stock trading, and Briefcase icon. Vector
Free with trial Set line Casino win, Slot machine, chips, Online sports betting, with dollar, and Hand holding casino icon. Vector. Line decrease vectors Set line Casino win, Slot machine, chips, Online sports betting, with dollar, and Hand holding casino icon. Vector
Free with trial Charts and graphs, Presentation and Report. Graph line icons. Analytics linear icon set. Line icons set. Vector. Line decrease illustrations Graph line icons. Charts and graphs, Presentation and Report. Linear icon set. Line icons. Vector. Charts and graphs, Presentation and Report. Graph line icons. Analytics linear icon set. Line icons set. Vector
Free with trial Charts and graphs, Presentation and Report. Graph line icons. Analytics linear icon set. Line icons set. Vector. Line decrease illustrations Graph line icons. Charts and graphs, Presentation and Report. Linear icon set. Line icons. Vector. Charts and graphs, Presentation and Report. Graph line icons. Analytics linear icon set. Line icons set. Vector
Free with trial Set line Bank building, Global economic crisis, Pie chart infographic and Shutdown of factory icon. Vector. Line decrease vectors Set line Bank building, Global economic crisis, Pie chart infographic and Shutdown of factory icon. Vector
Free with trial Hand drawn falling graph line over declining bar chart representing economic recession and business loss. Line decrease vectors Hand drawn falling graph line over declining bar chart representing economic recession and business loss
Free with trial Bar Chart Growth And Decline Line And Solid Icon Set. Financial Performance, Economic Trends, Business Analysis Symbol Collection. Data Visualization And Market Trends. Isolated Vector Illustration. Line decrease vectors Bar Chart Growth And Decline Line And Solid Icon Set. Financial Performance, Economic Trends, Business Analysis Symbol
Free with trial Scissors cutting, Artificial intelligence icons. Chef hat, Customer survey, Approved application line icons. Interest rate, gluten free. Linear set. Line icons set. Vector. Line decrease illustrations Chef hat, Customer survey, Approved application line icons. Scissors cutting, Artificial intelligence Vector. Scissors cutting, Artificial intelligence icons. Chef hat, Customer survey, Approved application line icons. Interest rate, gluten free. Linear set. Line icons set. Vector
Free with trial Set line Server, Data, Web Hosting, Cost reduction, Location with sales funnel and security lock icon. Vector. Line decrease vectors Set line Server, Data, Web Hosting, Cost reduction, Location with sales funnel and security lock icon. Vector
Free with trial Line Graph Chart Solid Icon. Data Analysis, Trend Visualization, And Statistical Representation Silhouette Symbol. Business And Financial Insights. Isolated Vector Illustration. Line decrease vectors Line Graph Chart Solid Icon. Data Analysis, Trend Visualization, And Statistical Representation Silhouette Symbol
Free with trial Triangle shape infographic process diagram with arrow triangle from circle cut step decrease with 3 points dark background bright outline style vector. Line decrease illustrations Triangle shape infographic process diagram with arrow triangle from circle cut step decrease with 3 points dark background bright
Free with trial Column chart sign. Salaryman, gender equality and alert bell outline icons. Decreasing graph line icon. Crisis diagram symbol. Spy or profile placeholder icon. Vector. Line decrease vectors Decreasing graph line icon. Crisis chart sign. Salaryman, gender equality and alert bell. Vector. Column chart sign. Salaryman, gender equality and alert bell outline icons. Decreasing graph line icon. Crisis diagram symbol. Decreasing graph line sign. Spy or profile placeholder icon. Vector
Free with trial Column chart sign. Salaryman, gender equality and alert bell outline icons. Decreasing graph line icon. Crisis diagram symbol. Spy or profile placeholder icon. Vector. Line decrease illustrations Decreasing graph line icon. Crisis chart sign. Salaryman, gender equality and alert bell. Vector. Column chart sign. Salaryman, gender equality and alert bell outline icons. Decreasing graph line icon. Crisis diagram symbol. Decreasing graph line sign. Spy or profile placeholder icon. Vector
Free with trial A grid of 28 simple black line art icons on a white background depicting various financial charts graphs and business related symbols including bar charts pie charts computers and money. Line decrease vectors Collection of 28 minimalist line art icons representing financial data charts and business concepts graph. A grid of 28 simple black line art icons on a white background depicting various financial charts graphs and business related symbols including bar charts pie charts computers and money
Free with trial Percentage rate arrow icon set. Percent arrow up and down symbol. Price increase and decrease vector illustration. Profit sign. Up and down arrows with percentage pictogram. Financial growth concept. Line decrease vectors Percentage rate arrow icon set. Percent arrow up and down symbol. Price increase and decrease vector illustration. Profit sign. Up
Free with trial Bar Chart With Downward Trend Line Icon. Financial Decline, Economic Recession, And Market Analysis Outline Symbol. Business Performance Tracking. Editable Stroke. Isolated Vector Illustration. Line decrease vectors Bar Chart With Downward Trend Line Icon. Financial Decline, Economic Recession, And Market Analysis Outline Symbol
Free with trial Bar Chart With Arrows Line And Solid Icon Set. Data Analysis, Trend Indication, Business Performance Tracking Symbols. Visual Representation Of Growth And Decline. Isolated Vector Illustration. Line decrease vectors Bar Chart With Arrows Line And Solid Icon Set. Data Analysis, Trend Indication, Business Performance Tracking Symbols
Free with trial Heartbeat line morphs into falling red arrow on dark grid, showing sudden economic flatline. Vector illustration. Concept of downturn, crisis mode, emergency slowdown, collapse, instability. Line decrease vectors Heartbeat line morphs into falling red arrow on dark grid, showing sudden economic flatline. Vector illustration.
Free with trial Set line Server with shield, Mobile and password, Cost reduction and Sales funnel gear on seamless pattern. Vector. Line decrease illustrations Set line Server with shield, Mobile and password, Cost reduction and Sales funnel gear on seamless pattern. Vector.
Free with trial Loan Related and Investment Line Vector Icon. Investment, Percentage, Interest Rate. Line decrease vectors Loan Related and Investment Line Vector Icon. Investment, Percentage, Interest Rate
Free with trial Loan Related and Investment Line Vector Icon. Investment, Percentage, Interest Rate. Line decrease vectors Loan Related and Investment Line Vector Icon. Investment, Percentage, Interest Rate
Free with trial Loan Related and Investment Line Vector Icon. Investment, Percentage, Interest Rate. Line decrease vectors Loan Related and Investment Line Vector Icon. Investment, Percentage, Interest Rate
Free with trial Loan Related and Investment Line Vector Icon. Investment, Percentage, Interest Rate. Line decrease vectors Loan Related and Investment Line Vector Icon. Investment, Percentage, Interest Rate
Free with trial Loan Related and Investment Line Vector Icon. Investment, Percentage, Interest Rate. Line decrease vectors Loan Related and Investment Line Vector Icon. Investment, Percentage, Interest Rate
Free with trial Loan Related and Investment Line Vector Icon. Investment, Percentage, Interest Rate. Line decrease vectors Loan Related and Investment Line Vector Icon. Investment, Percentage, Interest Rate
Free with trial Loan Related and Investment Line Vector Icon. Investment, Percentage, Interest Rate. Line decrease vectors Loan Related and Investment Line Vector Icon. Investment, Percentage, Interest Rate
Free with trial Loan Related and Investment Line Vector Icon. Investment, Percentage, Interest Rate. Line decrease illustrations Loan Related and Investment Line Vector Icon. Investment, Percentage, Interest Rate
Free with trial Loan Related and Investment Line Vector Icon. Investment, Percentage, Interest Rate. Line decrease vectors Loan Related and Investment Line Vector Icon. Investment, Percentage, Interest Rate
Free with trial Loan Related and Investment Line Vector Icon. Investment, Percentage, Interest Rate. Line decrease vectors Loan Related and Investment Line Vector Icon. Investment, Percentage, Interest Rate
Free with trial Loan Related and Investment Line Vector Icon. Investment, Percentage, Interest Rate. Line decrease vectors Loan Related and Investment Line Vector Icon. Investment, Percentage, Interest Rate
Free with trial Loan Related and Investment Line Vector Icon. Investment, Percentage, Interest Rate. Line decrease vectors Loan Related and Investment Line Vector Icon. Investment, Percentage, Interest Rate
Free with trial Loan Related and Investment Line Vector Icon. Investment, Percentage, Interest Rate. Line decrease vectors Loan Related and Investment Line Vector Icon. Investment, Percentage, Interest Rate
Free with trial Loan Related and Investment Line Vector Icon. Investment, Percentage, Interest Rate. Line decrease vectors Loan Related and Investment Line Vector Icon. Investment, Percentage, Interest Rate
Free with trial Loan Related and Investment Line Vector Icon. Investment, Percentage, Interest Rate. Line decrease vectors Loan Related and Investment Line Vector Icon. Investment, Percentage, Interest Rate
Free with trial Loan Related and Investment Line Vector Icon. Investment, Percentage, Interest Rate. Line decrease vectors Loan Related and Investment Line Vector Icon. Investment, Percentage, Interest Rate