Free with trial This visually striking graph displays two contrasting trends one line shows a sharp decrease while the other illustrates a significant increase in an engaging orange palette. Line decrease illustrations Dynamic Trends of Change Illustrated Through Contrasting Lines in Orange Hues. This visually striking graph displays two contrasting trends one line shows a sharp decrease while the other illustrates a significant increase in an engaging orange palette
Free with trial Hand interacting with a red downward trend line against a blue bar graph background image. Generative AI. Line decrease illustrations Hand interacting with a red downward trend line against a blue bar graph background image
Free with trial Human Interaction and Movement Line Icon Set. Social Dynamics, Communication, Group Behavior Outline Symbol Collection. Growth and Movement Concept. Editable Stroke. Isolated Vector Illustration. Line decrease vectors Human Interaction and Movement Line Icon Set. Social Dynamics, Communication, Group Behavior Outline Symbol Collection
Free with trial Set line Cloud and shield, Cost reduction and Server, Data, Web Hosting icon. Vector. Line decrease illustrations Set line Cloud and shield, Cost reduction and Server, Data, Web Hosting icon. Vector
Free with trial Arrows for presentation of growth and scaling line icons set. Tools to maximize and minimize, resize and expand, control size and direction thin black and red outline symbols vector illustration. Line decrease vectors Arrows for presentation of growth and scaling line icons set, tools to control size. Arrows for presentation of growth and scaling line icons set. Tools to maximize and minimize, resize and expand, control size and direction thin black and red outline symbols vector illustration
Free with trial A simple graphic design element featuring a rounded rectangle shape with a horizontal line across the center. Perfect for web design, app icons, or user interface elements. Line decrease vectors Rounded Rectangle Shape with Horizontal Line, Simple Geometric Design Element. A simple graphic design element featuring a rounded rectangle shape with a horizontal line across the center. Perfect for web design, app icons, or user interface elements.
Free with trial A vibrant red line depicts a sharp downward trend across a dynamic, motion-blurred abstract background. Line decrease illustrations Red downward trending graph line on abstract motion blurred background chart. A vibrant red line depicts a sharp downward trend across a dynamic, motion-blurred abstract background
Free with trial Data analysis graphs with up and down arrow line icons set. Increase and reduction of economy or trend charts, price boost, stock market research thin black and red outline symbols vector illustration. Line decrease vectors Data analysis graphs with up and down arrow, economy or trend charts line icons set. Data analysis graphs with up and down arrow line icons set. Increase and reduction of economy or trend charts, price boost, stock market research thin black and red outline symbols vector illustration
Free with trial A blue circular or oval icon featuring a white minus sign (,). jpg. Represents subtraction, decrease, removal, zoom out functionality, negative quantity, or minimizing action in user interfaces controls png transparent image Generative AI. Line decrease vectors Blue minus sign button icon decrease remove subtract less quantity png transparent image Generative AI. A blue circular or oval icon featuring a white minus sign (,).jpg. Represents subtraction, decrease, removal, zoom out functionality, negative quantity, or minimizing action in user interfaces controls png transparent image Generative AI
Free with trial Revenue Decline line icon. Universal creative premium symbol. Vector sign icon logo template. Vector illustration. Line decrease vectors Revenue Decline line icon. Universal creative premium symbol. Vector sign icon logo template. Vector illustration
Free with trial Increase and decrease dollar arrow icon. USD up and down sign symbol vector. Line decrease vectors Increase and decrease dollar arrow icon. USD up and down sign symbol
Free with trial Percent arrow up and down outline icon on black circle. Percentage increase and decrease arrows sign symbol vector. Line decrease vectors Percent arrow up and down outline icon on black circle. Percentage increase and decrease arrows sign symbol
Free with trial Increase and reduction of economy or trend charts, price boost, stock market research thin black outline symbols vector illustration. Data analysis graphs with up and down arrow line icons set. Line decrease vectors Data analysis graphs with up and down arrow, economy or trend charts line icons set. Increase and reduction of economy or trend charts, price boost, stock market research thin black outline symbols vector illustration. Data analysis graphs with up and down arrow line icons set.
Free with trial Tools to maximize and minimize, resize and expand, control size and direction thin black outline symbols vector illustration. Arrows for presentation of growth and scaling line icons set. Line decrease vectors Arrows for presentation of growth and scaling line icons set, tools to control size. Tools to maximize and minimize, resize and expand, control size and direction thin black outline symbols vector illustration. Arrows for presentation of growth and scaling line icons set.
Free with trial Interest rate reduction or percent down icon Black line art vector in black and white outline set collection sign. Line decrease vectors Interest rate reduction or percent down outline icon collection or set. Interest rate reduction or percent down Thin vector line. Interest rate reduction or percent down icon Black line art vector in black and white outline set collection sign
Free with trial Up and down flow of progress, turn movement, direction to right and traffic sign, software update and upgrade options thin black outline symbols vector illustration. Arrow line icons set. Line decrease illustrations Arrow line icons set, up and down flow of progress, turn movement, direction to right. Up and down flow of progress, turn movement, direction to right and traffic sign, software update and upgrade options thin black outline symbols vector illustration. Arrow line icons set.
Free with trial A collection of icons Upward graph, Downward graph, Growth chart, Decrease chart, Sales Analysis, Progress graph, icon. Line decrease vectors Upward graph, Downward graph, Growth chart, Decrease chart, Sales Analysis, Progress graph, icon
Free with trial Vector icon for volume down, featuring a speaker symbol with a minus sign. Used in audio players, video interfaces, system settings, and multimedia applications to decrease sound levels. Essential UI element for audio control and sound adjustment, vector design Generative AI. Line decrease vectors Volume Down Icon Audio Control Sound Decrease Mute Speaker Adjustment Symbol, vector design Generative AI. Vector icon for volume down, featuring a speaker symbol with a minus sign. Used in audio players, video interfaces, system settings, and multimedia applications to decrease sound levels. Essential UI element for audio control and sound adjustment, vector design Generative AI
Free with trial Column 3d graph sign. Salaryman, gender equality and alert bell outline icons. Diagram chart line icon. Market analytics symbol. 3d chart line sign. Spy or profile placeholder icon. Vector. Line decrease vectors Diagram chart line icon. Column 3d graph sign. Salaryman, gender equality and alert bell. Vector. Column 3d graph sign. Salaryman, gender equality and alert bell outline icons. Diagram chart line icon. Market analytics symbol. 3d chart line sign. Spy or profile placeholder icon. Vector
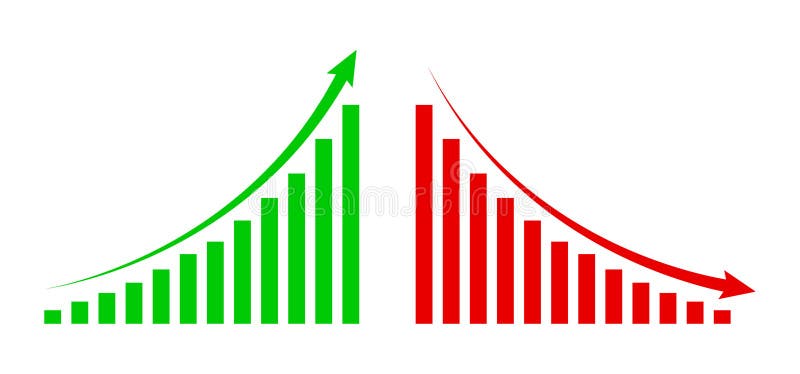
Free with trial Graph going up and down sign financial arrows. chart increase, decrease sign with green and red arrows. vector graph with green and red arrows. Line decrease vectors Graph going up and down sign financial arrows. chart increase, decrease sign with green and red arrows. vector graph
Free with trial Top Position and Promotion Icon Line Style Design Simple Finance and Business Vector Symbol Perfect Illustration. Line decrease vectors Top Position and Promotion Icon Line Style Design Simple Vector Perfect Illustration. Top Position and Promotion Icon Line Style Design Simple Finance and Business Vector Symbol Perfect Illustration
Free with trial Percentage growth and decline icons set. Percent arrow up and down flat and line style symbols collection. Vector illustration. Line decrease vectors Percentage growth and decline icons set. Percent arrow up and down flat and line style symbols collection
Free with trial A vector icon illustrating a downward trending line graph, symbolizing a decline, decrease, or negative performance. Ideal for financial reports, data analysis dashboards, or warning indicators. This clear and concise graphic is scalable, perfect for conveying trend information in various digital interfaces, vector design Generative AI. Line decrease vectors Declining Trend Graph Icon - Downturn Analysis Symbol, vector design Generative AI. A vector icon illustrating a downward trending line graph, symbolizing a decline, decrease, or negative performance. Ideal for financial reports, data analysis dashboards, or warning indicators. This clear and concise graphic is scalable, perfect for conveying trend information in various digital interfaces, vector design Generative AI
Free with trial Diagram graph line icon. Neumorphic, Flat shadow, 3d buttons. Column chart sign. Market analytics symbol. Line diagram graph icon. Social media icons. Vector. Line decrease vectors Diagram graph line icon. Column chart sign. Neumorphic buttons. Vector. Diagram graph line icon. Neumorphic, Flat shadow, 3d buttons. Column chart sign. Market analytics symbol. Line diagram graph icon. Social media icons. Vector
Free with trial Diagram graph line icon. Neumorphic, Red gradient, 3d pin buttons. Column chart sign. Market analytics symbol. Line icons. Neumorphic buttons with outline signs. Vector. Line decrease vectors Diagram graph line icon. Column chart sign. Line icons. Vector. Diagram graph line icon. Neumorphic, Red gradient, 3d pin buttons. Column chart sign. Market analytics symbol. Line icons. Neumorphic buttons with outline signs. Vector
Free with trial Set of Investment, Interest rate and Percentage diagram linear icons. Design shape elements. Loan line icons. Car leasing, analytics plan, Credit card percent and loan rate. Vector. Line decrease vectors Loan line icons. Set of Investment, Interest rate and Percentage diagram icons. Design elements. Vector. Set of Investment, Interest rate and Percentage diagram linear icons. Design shape elements. Loan line icons. Car leasing, analytics plan, Credit card percent and loan rate. Vector
Free with trial Decreasing graph icon vector illustration on circle line. Company bankruptcy report vector. Market crash concept. Line decrease vectors Decreasing graph icon vector on circle line. Company bankruptcy report vector. Market crash concept
Free with trial Percent growth decline arrow icon vector on black circle. Increase and decrease percentage sign symbol. Line decrease vectors Percent growth decline arrow icon on black circle. Increase and decrease percentage sign symbol
Free with trial Line graph up and down icon vector. Outline bar chart with arrow symbol. Analytics concept. Line decrease vectors Line graph up and down icon. Outline bar chart with arrow symbol. Analytics concept
Free with trial Percent arrow up and down icon on black circle. Percentage increase and decrease arrows sign symbol vector. Line decrease vectors Percent arrow up and down icon on black circle. Percentage increase and decrease arrows sign symbol
Free with trial Percentage growth and decline icons set. Percent arrow up and down flat and line style symbols collection. Vector illustration. Line decrease illustrations Percentage growth and decline icons set. Percent arrow up and down flat and line style symbols collection
Free with trial Steep downward trending red line graph with an arrow on a whiteboard mounted on an easel. Line decrease illustrations Whiteboard showing a steep downward trending red line graph on an easel chart data. Steep downward trending red line graph with an arrow on a whiteboard mounted on an easel
Free with trial High-detail image showing a dynamic orange graph line representing financial data trends and market fluctuations. Ideal for finance and business themes. Line decrease illustrations Dynamic Orange Graph Line Representing Financial Data Trends and Market Fluctuations
Free with trial Modern line icon of a percentage symbol inside a circular gauge for financial concepts. Line decrease vectors Modern line icon of a percentage symbol inside a circular gauge for financial concepts
Free with trial Stacks of gold coins with a falling graph line signify financial market decline and analysis This image is great for finance and investment content. Line decrease illustrations Analyzing Stock Market Downturn with Golden Coins and Dramatic Red Line. Stacks of gold coins with a falling graph line signify financial market decline and analysis This image is great for finance and investment content
Free with trial Stacks of gold coins with a falling graph line signify financial market decline and analysis This image is great for finance and investment content. Line decrease illustrations Analyzing Stock Market Downturn with Golden Coins and Dramatic Red Line. Stacks of gold coins with a falling graph line signify financial market decline and analysis This image is great for finance and investment content
Free with trial Analytics graph line icon. Continuous one line with curl. Column chart sign. Growth diagram symbol. Analytics graph single outline ribbon. Loop curve pattern. Vector. Line decrease illustrations Analytics graph line icon. Column chart sign. Continuous line with curl. Vector. Analytics graph line icon. Continuous one line with curl. Column chart sign. Growth diagram symbol. Analytics graph single outline ribbon. Loop curve pattern. Vector
Free with trial Dollar arrow up and down outline icon vector. USD increase and decrease sign symbol. Line decrease vectors Dollar arrow up and down outline icon. USD increase and decrease sign symbol
Free with trial Displaying 3D bar columns on analytics dashboard, with overlaid line graph and numeric labels. Data, visualization, dashboard, analytics, infographic, 3d, abstract. Line decrease illustrations Displaying 3D bar columns on analytics dashboard, with overlaid line graph and numeric labels
Free with trial Graph line icon. Neumorphic, Flat shadow, 3d buttons. Column chart sign. Growth diagram symbol. Line graph chart icon. Social media icons. Vector. Line decrease vectors Graph line icon. Column chart sign. Neumorphic buttons. Vector. Graph line icon. Neumorphic, Flat shadow, 3d buttons. Column chart sign. Growth diagram symbol. Line graph chart icon. Social media icons. Vector
Free with trial Graph line icon. Neumorphic, Flat shadow, 3d buttons. Column chart sign. Ab test diagram symbol. Line graph chart icon. Social media icons. Vector. Line decrease vectors Graph line icon. Column chart sign. Neumorphic buttons. Vector. Graph line icon. Neumorphic, Flat shadow, 3d buttons. Column chart sign. Ab test diagram symbol. Line graph chart icon. Social media icons. Vector
Free with trial Report, 3D Chart, Block diagram and Dot Plot graph linear icons. Design shape elements. Charts and Diagrams line icons. Trend, Pyramid and Pie chart report symbols. Vector. Line decrease vectors Charts and Diagrams line icons. Set of 3D Chart, Block diagram and Dot Plot graph icons. Design elements. Vector. Report, 3D Chart, Block diagram and Dot Plot graph linear icons. Design shape elements. Charts and Diagrams line icons. Trend, Pyramid and Pie chart report symbols. Vector
Free with trial Descending data analytics line graphic outline icon in white and black colors. descending data analytics line graphic flat vector icon from business collection for web, mobile apps and ui. Line decrease vectors Descending data analytics line graphic outline icon in white and black colors. descending data analytics line graphic flat vector
Free with trial Diagram chart line icon. Neumorphic, Flat shadow, 3d buttons. Presentation graph sign. Market analytics symbol. Line diagram chart icon. Social media icons. Vector. Line decrease vectors Diagram chart line icon. Presentation graph sign. Neumorphic buttons. Vector. Diagram chart line icon. Neumorphic, Flat shadow, 3d buttons. Presentation graph sign. Market analytics symbol. Line diagram chart icon. Social media icons. Vector
Free with trial Stock market chart featuring a red downtrend line against a black background, fluctuations in financial data. perfect for illustrating concepts in finance, investment analysis, and economic downturns. Generative AI. Line decrease illustrations Dynamic Stock Market Analysis with Red Downtrend Line on Black Background Generative AI. Stock market chart featuring a red downtrend line against a black background, fluctuations in financial data. perfect for illustrating concepts in finance, investment analysis, and economic downturns. Generative AI
Free with trial Reduce Magnifier, Reduction Search Tool, Decrease Magnifying Glass with Curved Arrow Sign. Line decrease vectors Reduce Magnifier, Reduction Search Tool, Decrease Magnifying Glass with Curved Arrow Sign
Free with trial Percent arrow up and down outline icon vector. Percentage increase and decrease arrows sign symbol. Line decrease vectors Percent arrow up and down outline icon. Percentage increase and decrease arrows sign symbol
Free with trial A financial candlestick chart illustrates a positive market trend, with green and red candles indicating price movements and a smooth green line representing a moving average. Line decrease illustrations Financial stock market candlestick chart showing upward trend with moving average line. A financial candlestick chart illustrates a positive market trend, with green and red candles indicating price movements and a smooth green line representing a moving average
Free with trial Pie chart line icon. Halftone dotted pattern. Gradient icon with grain shadow. Presentation graph sign. Market analytics symbol. Line pie chart icon. Various designs. Vector. Line decrease vectors Pie chart line icon. Presentation graph sign. Halftone dotted pattern. Vector. Pie chart line icon. Halftone dotted pattern. Gradient icon with grain shadow. Presentation graph sign. Market analytics symbol. Line pie chart icon. Various designs. Vector
Free with trial Graph line icon. Continuous one line with curl. Column chart sign. Growth diagram symbol. Graph chart single outline ribbon. Loop curve pattern. Vector. Line decrease vectors Graph line icon. Column chart sign. Continuous line with curl. Vector. Graph line icon. Continuous one line with curl. Column chart sign. Growth diagram symbol. Graph chart single outline ribbon. Loop curve pattern. Vector
Free with trial CO2 emissions, exhaust and greenhouse gas reduction, global air pollution and footprint line icon set. Impact of industry on environment, climate thin black and red outline symbols vector illustration. Line decrease vectors CO2 emissions, exhaust and greenhouse gas reduction, air pollution line icon set. CO2 emissions, exhaust and greenhouse gas reduction, global air pollution and footprint line icon set. Impact of industry on environment, climate thin black and red outline symbols vector illustration
Free with trial Graph line icon. Continuous one line with curl. Column chart sign. Growth diagram symbol. Graph chart single outline ribbon. Loop curve pattern. Vector. Line decrease vectors Graph line icon. Column chart sign. Continuous line with curl. Vector. Graph line icon. Continuous one line with curl. Column chart sign. Growth diagram symbol. Graph chart single outline ribbon. Loop curve pattern. Vector
Free with trial A 3D illustration of a blue line graph on a light blue background. The graph features a wavy blue line connecting several data points represented by small pink and green spheres. The overall shape suggests fluctuating data or trends, with some points indicating upward movement. Line decrease illustrations 3D Blue Line Graph with Pink and Green Data Points on Light Blue Background chart statistics. A 3D illustration of a blue line graph on a light blue background. The graph features a wavy blue line connecting several data points represented by small pink and green spheres. The overall shape suggests fluctuating data or trends, with some points indicating upward movement
Free with trial A 3D rendered bar chart with yellow, pink, and teal bars stands against a light purple background. A purple magnifying glass with a yellow handle is positioned over the chart, suggesting analysis. A thin line with pink dots connects the tops of the bars, indicating a trend. Line decrease illustrations 3D Bar Chart with Magnifying Glass and Trend Line on Purple Background graph statistics. A 3D rendered bar chart with yellow, pink, and teal bars stands against a light purple background. A purple magnifying glass with a yellow handle is positioned over the chart, suggesting analysis. A thin line with pink dots connects the tops of the bars, indicating a trend
Free with trial Graph line icon. Continuous line with share plane. Column chart sign. Growth diagram symbol. 3d heart in speech bubble. Graph chart single line ribbon. Loop curve pattern. Vector. Line decrease illustrations Graph line icon. Column chart sign. Continuous line with plane. Vector. Graph line icon. Continuous line with share plane. Column chart sign. Growth diagram symbol. 3d heart in speech bubble. Graph chart single line ribbon. Loop curve pattern. Vector
Free with trial A collection of icons Decrease, Intersection graph, decrease, Intersect graph, Connection network, Hierarchy structure, icon. Line decrease vectors Decrease, Intersection graph, decrease, Intersect graph, Connection network, Hierarchy structure, icon
Free with trial Red And Yellow Lines Trending Upwards On A Line Graph. Business, Finance, Investment Concept, Generated by AI. Line decrease illustrations Red And Yellow Lines Trending Upwards On A Line Graph. Business, Finance, Investment Concept
Free with trial 3D rendering of declining bar and line graphs on a grid background. Line decrease illustrations 3D rendering of declining bar and line graphs on a grid background
Free with trial Up and down dollar arrow icon on circle line. USD growth and decline sign symbol vector. Line decrease vectors Up and down dollar arrow icon on circle line. USD growth and decline sign symbol
Free with trial Dollar arrow growth and decline icon on circle line. USD up and down sign symbol vector. Line decrease vectors Dollar arrow growth and decline icon on circle line. USD up and down sign symbol
Free with trial Person With Downward Arrow Icon Set. Weight Loss, Decline, And Reduction Symbol Collection. Decrease In Value Or Status. Isolated Vector Illustration. Line decrease vectors Person With Downward Arrow Icon Set. Weight Loss, Decline, And Reduction Symbol Collection. Decrease In Value Or Status
Free with trial Graph line icon. Halftone dotted pattern. Gradient icon with grain shadow. Column chart sign. Growth diagram symbol. Line graph chart icon. Various designs. Vector. Line decrease vectors Graph line icon. Column chart sign. Halftone dotted pattern. Vector. Graph line icon. Halftone dotted pattern. Gradient icon with grain shadow. Column chart sign. Growth diagram symbol. Line graph chart icon. Various designs. Vector
Free with trial Financial Capability Month Financial chart with 3d bar graph and line plot illustrating market trends. Line decrease illustrations Financial Capability Month Financial chart with 3d bar graph and line plot illustrating market trends
Free with trial Hand-drawn line chart doodle is showing grid backdrop and axis over gradient background, copy space. Data visualization, infographics, analytics, diagram, business, educational, minimalistic. Line decrease illustrations Hand-drawn line chart doodle is showing grid backdrop and axis over gradient background, copy space
Free with trial Set line Worker, Credit card, Global economic crisis and. Business infographic template. Vector. Line decrease vectors Set line Worker, Credit card, Global economic crisis and . Business infographic template. Vector
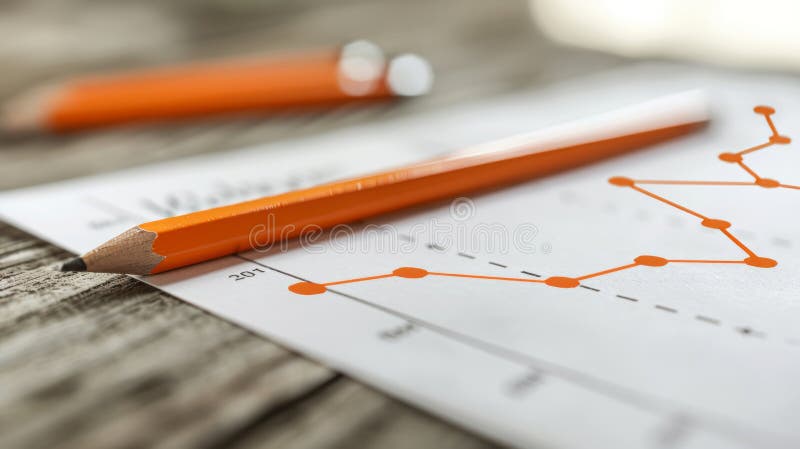
Free with trial Orange Pencil on Paper with Fluctuating Line Graph Representing Business Trends and Analysis, Generated by AI. Line decrease illustrations Orange Pencil on Paper with Fluctuating Line Graph Representing Business Trends and Analysis
Free with trial Business chart icon set with graph, statistic, line and bar diagram for finance or analysis. Pie graphics with horizontal and donut layout for data growth. Vector report for trend or economy by pictogram scheme. Line decrease vectors Business chart icon set with graph, statistic, line and bar diagram for finance or analysis. Pie graphics with
Free with trial Percent growth decline arrow icon. Increase and decrease percentage sign symbol vector. Line decrease vectors Percent growth decline arrow icon. Increase and decrease percentage sign symbol
Free with trial Web report line icon. Continuous one line with curl. Column graph sign. Growth diagram symbol. Web report single outline ribbon. Loop curve pattern. Vector. Line decrease vectors Web report line icon. Column graph sign. Continuous line with curl. Vector. Web report line icon. Continuous one line with curl. Column graph sign. Growth diagram symbol. Web report single outline ribbon. Loop curve pattern. Vector
Free with trial Web report line icon. Continuous one line with curl. Column graph sign. Growth diagram symbol. Web report single outline ribbon. Loop curve pattern. Vector. Line decrease illustrations Web report line icon. Column graph sign. Continuous line with curl. Vector. Web report line icon. Continuous one line with curl. Column graph sign. Growth diagram symbol. Web report single outline ribbon. Loop curve pattern. Vector
Free with trial Graph and diagram from boats with decrease. Finance and business concepts. 3D Illustration isolated. 3D rendering on blue background. Line decrease illustrations Graph and diagram from boats with decrease. Finance and business concepts. 3D Illustration isolated.
Free with trial Magnifying glass with minus sign symbolizing zoom out or decrease concept sketch illustration. Line decrease vectors Magnifying glass with minus sign symbolizing zoom out or decrease concept sketch illustration
Free with trial Indentation Decrease Icon with Arrow Indicating Text Alignment to the Left Margin Illustration. Line decrease vectors Indentation Decrease Icon with Arrow Indicating Text Alignment to the Left Margin Illustration
Free with trial Reduction Greenhouse CO2 with Cloud Emission Line and Silhouette Icon Set, Carbon Dioxide icon set vector on white background. Line decrease vectors Reduction Greenhouse CO2 with Cloud Emission Line and Silhouette Icon Set, Carbon Dioxide icon set vector
Free with trial A green line graph displays fluctuating data points across five days, presented isolated on a clean white background. Line decrease illustrations Green line graph showing fluctuating data trends over five days isolated on white background. A green line graph displays fluctuating data points across five. A green line graph displays fluctuating data points across five days, presented isolated on a clean white background
Free with trial Electric power, Charge station and Electricity price inflation set. Design shape elements. Energy line icons. Eco energy, efficiency consumption and saving electricity line icons. Vector. Line decrease illustrations Energy line icons. Electric power, Charge station and Electricity price inflation set. Design elements. Vector. Electric power, Charge station and Electricity price inflation set. Design shape elements. Energy line icons. Eco energy, efficiency consumption and saving electricity line icons. Vector
Free with trial Loan interest rate doodle icon set. Hand drawn sketch doodle line style bank money loan interest rate icon for house, car discount percentage concept. Trendy cute element. Vector illustration. Line decrease vectors Loan interest rate doodle icon set. Hand drawn sketch doodle line style bank money loan interest rate icon for house
Free with trial Loan interest rate doodle icon set. Hand drawn sketch doodle line style bank money loan interest rate icon for house, car discount percentage concept. Trendy cute element. Vector illustration. Line decrease vectors Loan interest rate doodle icon set. Hand drawn sketch doodle line style bank money loan interest rate icon for house
Free with trial Illustration of up and down percentage arrow line icon. Percentage arrow with percent sign. Design concept for banking, credit, interest rates, finance and financial fields. isolated white background. Line decrease illustrations Illustration of up and down percentage arrow line icon.