Free with trial A versatile vector illustration of a green volume control icon, indicating both increase and decrease sound. This graphic is perfect for user interfaces, audio mixers, media players, or interactive applications. Its dynamic design provides clear visual feedback for sound adjustment, vector design Generative AI. Line decrease vectors Green Volume Up Down Sound Icon, vector design Generative AI. A versatile vector illustration of a green volume control icon, indicating both increase and decrease sound. This graphic is perfect for user interfaces, audio mixers, media players, or interactive applications. Its dynamic design provides clear visual feedback for sound adjustment, vector design Generative AI
Free with trial This image illustrates a bar graph showing an upward trend in financial growth, accompanied by a line graph depicting market fluctuations over time. Line decrease illustrations Graphical representation of financial growth and fluctuation. This image illustrates a bar graph showing an upward trend in financial growth, accompanied by a line graph depicting market fluctuations over time
Free with trial A 3D render illustrating a concept of financial decline and economic recession. The image features a red bar chart with progressively shorter bars, indicating a downward trend. A bold, red arrow follows this negative trajectory, pointing sharply downwards. Set against a clean, neutral gray background, this graphic powerfully symbolizes concepts like business failure, stock market crash, investment loss, sales decrease, and economic crisis. It's a perfect visual for presentations, reports, and articles discussing financial downturns, poor performance, and negative growth. Line decrease illustrations Financial Decline Graph with Red Arrow Down. A 3D render illustrating a concept of financial decline and economic recession. The image features a red bar chart with progressively shorter bars, indicating a downward trend. A bold, red arrow follows this negative trajectory, pointing sharply downwards. Set against a clean, neutral gray background, this graphic powerfully symbolizes concepts like business failure, stock market crash, investment loss, sales decrease, and economic crisis. It's a perfect visual for presentations, reports, and articles discussing financial downturns, poor performance, and negative growth.
Free with trial A clean line drawing showcases a magnifying glass focusing on a hand holding a declining bar graph with a downward. Line decrease illustrations Declining Market Analysis Magnifying Glass on Loss Trend. A clean line drawing showcases a magnifying glass focusing on a hand holding a declining bar graph with a downward.
Free with trial Simple outline icon of hand offering money and downward arrow. Represents decrease, loss, recession, and financial challenge. Line decrease vectors Outline Simple Hand Offering Money Down Arrow Icon Symbol. Simple outline icon of hand offering money and downward arrow. Represents decrease, loss, recession, and financial challenge.
Free with trial A dynamic digital illustration of a financial chart on a dark, high-tech background. The image features two contrasting lines: a vibrant green line trending upwards with an arrow, symbolizing growth, profit, and success, and a blue line moving downwards with an arrow, representing decline, loss, and risk. Glowing data points and a network grid enhance the futuristic feel. This versatile graphic is perfect for concepts related to stock market analysis, business performance, investment volatility, economic forecasting, big data, and financial technology (fintech). Line decrease illustrations Futuristic Financial Graph with Growth and Decline Arrows. A dynamic digital illustration of a financial chart on a dark, high-tech background. The image features two contrasting lines: a vibrant green line trending upwards with an arrow, symbolizing growth, profit, and success, and a blue line moving downwards with an arrow, representing decline, loss, and risk. Glowing data points and a network grid enhance the futuristic feel. This versatile graphic is perfect for concepts related to stock market analysis, business performance, investment volatility, economic forecasting, big data, and financial technology (fintech).
Free with trial Four smooth, black stones of varying sizes are arranged in a vertical line on a white surface. The stones are polished with a uniformly glossy texture and rounded contours. They decrease in size from the foreground to the background, creating a sense of depth and perspective. This arrangement is often used for meditation or relaxation purposes, symbolizing balance and tranquility. Line decrease illustrations They decrease in size from the foreground to the background
Free with trial A black and white line drawing depicts a magnifying glass focusing on a gear, a descending bar graph, and a. Line decrease illustrations Decline Analysis Magnifying Glass, Gear, and Downward Graph. A black and white line drawing depicts a magnifying glass focusing on a gear, a descending bar graph, and a.
Free with trial A simple line drawing depicts a declining bar graph with an arrow pointing downwards, all viewed through a magnifying. Line decrease illustrations Declining Graph Under Magnifying Glass Loss Analysis Icon. A simple line drawing depicts a declining bar graph with an arrow pointing downwards, all viewed through a magnifying.
Free with trial This image showcases a dynamic stock market graph, generated by AI, depicting a sharp downward trend in red. The vibrant red line against the black background creates a dramatic visual representation of market volatility. The image is perfect for illustrating concepts of risk, investment, and fina. Line decrease illustrations Red Market Dip. This image showcases a dynamic stock market graph, generated by AI, depicting a sharp downward trend in red. The vibrant red line against the black background creates a dramatic visual representation of market volatility. The image is perfect for illustrating concepts of risk, investment, and fina
Free with trial Data analytics dashboard illustrating a mix of line graphs, bar charts, and data summaries, representing business growth, financial trends, and statistical insights for market analysis. Line decrease vectors Data analytics dashboard showing business growth and decline. Data analytics dashboard illustrating a mix of line graphs, bar charts, and data summaries, representing business growth, financial trends, and statistical insights for market analysis
Free with trial Water level icon. Water depth icon vector. Water level up, down icon sign vector. Water level increase, decrease icon sign vector. Line decrease vectors Water level icon. Water depth icon vector. Water level up, down icon sign vector. Water level increase, decrease icon sign vector
Free with trial Set of alpha transparent business and finance icons drawn in white chalk, illustrating net asset value rising and falling alongside a market chart and Indian currency notation. Line decrease vectors Sketch of mutual fund NAV increase and decrease icons with Indian rupee symbol alpha transparent. Set of alpha transparent business and finance icons drawn in. Set of alpha transparent business and finance icons drawn in white chalk, illustrating net asset value rising and falling alongside a market chart and Indian currency notation.
Free with trial A simple yet impactful vector icon of a downward-pointing arrow, symbolizing a negative trend, decline, or decrease. This design is ideal for financial reports, economic indicators, market analysis, or any data visualization requiring a clear representation of reduction or downturns, vector design Generative AI. Line decrease vectors Downward Trend Arrow, Market Decline, vector design Generative AI. A simple yet impactful vector icon of a downward-pointing arrow, symbolizing a negative trend, decline, or decrease. This design is ideal for financial reports, economic indicators, market analysis, or any data visualization requiring a clear representation of reduction or downturns, vector design Generative AI
Free with trial Conceptual line art depicting business analysis and market trends. Line decrease illustrations Business Analysis Magnifying Glass, Thumbs Up, Declining Graph. Conceptual line art depicting business analysis and market trends.
Free with trial A clean, minimalist icon representing the stock market. The image features a bull and a bear, symbolizing market trends, with a rising green arrow indicating an upward trend. The design is enclosed in a circular frame, suitable for financial reports, investment presentations, or business infographics. The simple line art style makes it versatile for various applications. Line decrease illustrations Stock Market Bull and Bear Trend Icon. A clean, minimalist icon representing the stock market. The image features a bull and a bear, symbolizing market trends, with a rising green arrow indicating an upward trend. The design is enclosed in a circular frame, suitable for financial reports, investment presentations, or business infographics. The simple line art style makes it versatile for various applications.
Free with trial This comprehensive vector illustration features a set of 18 flat icons depicting various financial trends, market indicators, and warning signals. The collection includes rising and falling line graphs, bar charts, currency symbols (dollar and euro) indicating fluctuations, and alert symbols like sirens and exclamation marks. Ideal for illustrating concepts of economic growth, decline, market volatility, financial crisis, investment risks, and business performance. Perfect for presentations, reports, websites, and applications related to finance, economics, and stock markets. Line decrease vectors Financial Trends, Market Indicators and Crisis Alert Icons Set. This comprehensive vector illustration features a set of 18 flat icons depicting various financial trends, market indicators, and warning signals. The collection includes rising and falling line graphs, bar charts, currency symbols (dollar and euro) indicating fluctuations, and alert symbols like sirens and exclamation marks. Ideal for illustrating concepts of economic growth, decline, market volatility, financial crisis, investment risks, and business performance. Perfect for presentations, reports, websites, and applications related to finance, economics, and stock markets.
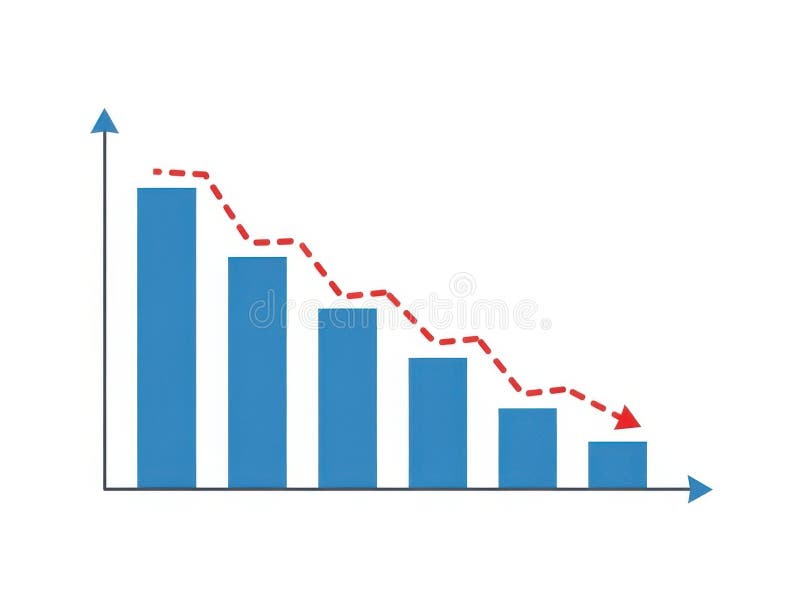
Free with trial This image features a bar chart with a decreasing trend isolated on a white background. The chart displays blue bars that progressively decrease in height from left to right, with a red dashed line indicating the downward trend. The horizontal axis represents different categories, while the vertical axis shows the corresponding values. The image is clear and SEO-friendly, highlighting data. Line decrease illustrations Bar chart with decreasing trend isolated on white background. This image features a bar chart with a decreasing trend isolated on a white background. The chart displays blue bars that progressively decrease in height from left to right, with a red dashed line indicating the downward trend. The horizontal axis represents different categories, while the vertical axis shows the corresponding values. The image is clear and SEO-friendly, highlighting data
Free with trial Three stacks of gold coins, varying in height, are arranged side by side. Red downward arrows are above the smallest stack on the left, indicating decline, while green upward arrows are above the tallest stack in the center, suggesting growth. The stack on the right is of medium height. The illustration uses a watercolor style to represent financial concepts of increase and decrease. Line decrease vectors Financial Growth and Decline Coin Stacks with Up and Down Arrows. Three stacks of gold coins, varying in height, are arranged side by side. Red downward arrows are above the smallest stack on the left, indicating decline, while green upward arrows are above the tallest stack in the center, suggesting growth. The stack on the right is of medium height. The illustration uses a watercolor style to represent financial concepts of increase and decrease.
Free with trial This image shows a simple line graph with increasing and decreasing trends, ideal for visualizing data analysis and presenting key findings. The graph uses a clean, minimalist design to highlight the data points and overall trend. Perfect for presentations and reports. Line decrease illustrations Analyze Your Data. This image shows a simple line graph with increasing and decreasing trends, ideal for visualizing data analysis and presenting key findings. The graph uses a clean, minimalist design to highlight the data points and overall trend. Perfect for presentations and reports.
Free with trial An abstract representation of a stock market decline is illustrated through a sharply descending red line graph against a dark, grid-like background. The red hues emphasize the severity of the drop, suggesting financial loss. Numerical data points faintly accompany the visual. This image was generat. Line decrease illustrations Red Stock Decline. An abstract representation of a stock market decline is illustrated through a sharply descending red line graph against a dark, grid-like background. The red hues emphasize the severity of the drop, suggesting financial loss. Numerical data points faintly accompany the visual. This image was generat
Free with trial A red line graph showing a significant downward trend, indicating a decline or loss, set against a subtle white background with small, scattered grid points. Line decrease illustrations Red downward trend line on a white background with grid points. A red line graph showing a significant downward trend, indicating a decline or loss, set against a subtle white background with small, scattered grid points
Free with trial The bright orange tubes in the shape of hundredths are shrinking. The path of bright honeycomb pipes into a black background. Bright shaped isolated vector illustration. Repeated twisted tubes form a line. Line decrease vectors Bright orange tubes in the shape of hundredths are shrinking. The path of bright honeycomb pipes into a black background
Free with trial A black graph displays a downward curving line within a rectangular frame. Clear details and vibrant colors en. Line decrease illustrations Black graph showing a downward curve within a frame chart decline. A black graph displays a downward curving line within a rectangular frame. Clear details and vibrant colors en
Free with trial Decrease showing abstract composition of white 3d geometric shapes representing percentage and plus symbols. Line decrease illustrations Abstract Composition of White 3D Geometric Shapes Representing Percentage and Plus Symbols
Free with trial The image shows a red candlestick chart against a white background. the chart displays price movements over time, with each candlestick representing a specific period. the red color indicates a price decrease during that period. two horizontal black lines are drawn across the chart, potentially indicating support or resistance levels. the chart shows an overall upward trend, with periods of both gains and losses. the candlesticks vary in size, reflecting the magnitude of price fluctuations. the background is plain white, providing a clean and uncluttered view of the chart. Line decrease illustrations Red candlestick chart on white background. the image shows a red candlestick chart against a white background. the chart displays price movements over time, with each candlestick representing a specific period. the red color indicates a price decrease during that period. two horizontal black lines are drawn across the chart, potentially indicating support or resistance levels. the chart shows an overall upward trend, with periods of both gains and losses. the candlesticks vary in size, reflecting the magnitude of price fluctuations. the background is plain white, providing a clean and uncluttered view of the chart.
Free with trial A clean, minimalist line art icon representing settings and configuration. The central element is a gear, symbolizing mechanics, operations, or system adjustments. Encircling the gear are three distinct symbols: a plus sign (+) for adding or increasing, a minus sign (-) for subtracting or decreasing, and an information icon (i) for help or details. This graphic is ideal for representing user interface controls, technical configurations, or operational adjustments in digital or mechanical contexts. Line decrease illustrations Gear Settings Icon with Plus, Minus, and Info Symbols. A clean, minimalist line art icon representing settings and configuration. The central element is a gear, symbolizing mechanics, operations, or system adjustments. Encircling the gear are three distinct symbols: a plus sign (+) for adding or increasing, a minus sign (-) for subtracting or decreasing, and an information icon (i) for help or details. This graphic is ideal for representing user interface controls, technical configurations, or operational adjustments in digital or mechanical contexts.
Free with trial A clean, minimalist line art illustration featuring a central gear or cogwheel. Encircling the gear are three distinct icons: a plus sign (+), a minus sign (-), and an information symbol (i). These elements are arranged around the gear within curved lines, suggesting a system of controls, adjustments, or settings. The design is monochromatic, using black lines on a white background, making it versatile for various applications. Line decrease illustrations Gear Settings Icon with Plus, Minus, and Info Symbols. A clean, minimalist line art illustration featuring a central gear or cogwheel. Encircling the gear are three distinct icons: a plus sign (+), a minus sign (-), and an information symbol (i). These elements are arranged around the gear within curved lines, suggesting a system of controls, adjustments, or settings. The design is monochromatic, using black lines on a white background, making it versatile for various applications.
Free with trial A functional vector illustration of a left pointing triangle with a minus sign, typically used for rewind or volume decrease in media players. This icon is ideal for audio or video editing software, music apps, or digital interfaces requiring media control, vector design Generative AI. Line decrease vectors Rewind volume control, audio media player, vector design Generative AI. A functional vector illustration of a left pointing triangle with a minus sign, typically used for rewind or volume decrease in media players. This icon is ideal for audio or video editing software, music apps, or digital interfaces requiring media control, vector design Generative AI
Free with trial This image features a clear financial chart on a plain white background, illustrating a significant downward trend. A bold red line with an arrow points sharply downwards, symbolizing decline, loss, or a crisis. A grey line, possibly representing historical data or another metric, also shows a general downward movement. This visual effectively conveys concepts of economic recession, market crash, poor business performance, or financial distress. It's ideal for presentations, reports, news articles, or any content discussing negative economic indicators, investment risks, or strategic challenges. Line decrease vectors Financial Chart Illustrating Economic Decline and Market Downturn. This image features a clear financial chart on a plain white background, illustrating a significant downward trend. A bold red line with an arrow points sharply downwards, symbolizing decline, loss, or a crisis. A grey line, possibly representing historical data or another metric, also shows a general downward movement. This visual effectively conveys concepts of economic recession, market crash, poor business performance, or financial distress. It's ideal for presentations, reports, news articles, or any content discussing negative economic indicators, investment risks, or strategic challenges.
Free with trial Repeated circles on the reduction are arranged along like a tube. The path of the orange rings into the black background. Bright ring isolated vector illustration. Repeated rings form a line. Line decrease vectors Repeated circles on the reduction are arranged along like a tube. The path of the orange rings into the black background
Free with trial Monochrome abstract design featuring a pattern of gray squares on a white background. Squares decrease in size and intensity from the center outward, creating a gradient effect. The central squares are larger and darker, transitioning to smaller, lighter squares toward the edges. The arrangement forms a symmetrical, eye-catching pattern, drawing attention to the center. Line decrease vectors Monochrome Abstract Square Halftone Pattern. Monochrome abstract design featuring a pattern of gray squares on a white background. Squares decrease in size and intensity from the center outward, creating a gradient effect. The central squares are larger and darker, transitioning to smaller, lighter squares toward the edges. The arrangement forms a symmetrical, eye-catching pattern, drawing attention to the center.