Free with trial A spiral pattern composed of green leaves, arranged symmetrically in a radial formation. The leaves, with pointed tips and visible vein details, decrease in size toward the center, creating a concentric visual effect. The design is set against a plain white background, emphasizing the vibrant green color. The pattern resembles a fractal or mandala, commonly used in graphic design and digital art for its aesthetic and repetitive qualities. Line decrease illustrations Is set against a plain white background, emphasizing the vibrant green
Free with trial Concentric neon rings in various colors, including blue, green, pink, orange, and purple, are set against a dark background. Each ring glows brightly, creating a vibrant, hypnotic pattern that appears to pulse with energy. The rings decrease in size as they approach the center, enhancing a tunnel-like effect. The image exudes a futuristic and dynamic aesthetic, often associated with digital or virtual environments. Line decrease illustrations Concentric neon rings in various colors, including blue, green, pink, orange, and
Free with trial A minimalist studio shot featuring a series of metallic spheres arranged in a line on a reflective grey surface. The spheres decrease in size from left to right, showcasing different finishes: a large textured silver ball, a smooth chrome sphere, and a progression of highly reflective gold balls. The clean white background emphasizes the objects, creating a sense of order, progression, and comparison. Ideal for concepts of growth, decline, hierarchy, or abstract design. Generated by AI. Line decrease illustrations Metallic Spheres Progression: Gold and Silver Balls in Decreasing Size. A minimalist studio shot featuring a series of metallic spheres arranged in a line on a reflective grey surface. The spheres decrease in size from left to right, showcasing different finishes: a large textured silver ball, a smooth chrome sphere, and a progression of highly reflective gold balls. The clean white background emphasizes the objects, creating a sense of order, progression, and comparison. Ideal for concepts of growth, decline, hierarchy, or abstract design. Generated by AI
Free with trial A flat, cartoon-style line graph on a white grid background shows a green upward-pointing arrow representing growth and a red downward-pointing arrow indicating decline, with a red dollar sign placed atop the green arrow to symbolize financial gain, illustrating contrasting economic trends in a simplified, visually engaging manner ideal for business, finance, and investment-related content that. Line decrease illustrations Upward and downward financial trend with green and red arrows on grid graph. A flat, cartoon-style line graph on a white grid background shows a green upward-pointing arrow representing growth and a red downward-pointing arrow indicating decline, with a red dollar sign placed atop the green arrow to symbolize financial gain, illustrating contrasting economic trends in a simplified, visually engaging manner ideal for business, finance, and investment-related content that
Free with trial Close-up of a financial chart showing a red line declining. The chart is on a piece of white paper and the red line is the main focus. Line decrease illustrations Financial Chart Showing Decline. Close-up of a financial chart showing a red line declining. The chart is on a piece of white paper and the red line is the main focus
Free with trial Illustrative line graph charting downward trend, representing losses, recession or market decline, isolated stock diagram. Line decrease vectors Illustrative line graph charting downward trend, representing losses, recession or market decline, isolated stock
Free with trial A simple, minimalist vector icon depicting a thermometer with a downward-pointing arrow, indicating a decrease in temperature. Perfect for websites, apps, and presentations. Line decrease vectors Decreasing Temperature Thermometer Icon, Simple Minimalist Design. A simple, minimalist vector icon depicting a thermometer with a downward-pointing arrow, indicating a decrease in temperature. Perfect for websites, apps, and presentations.
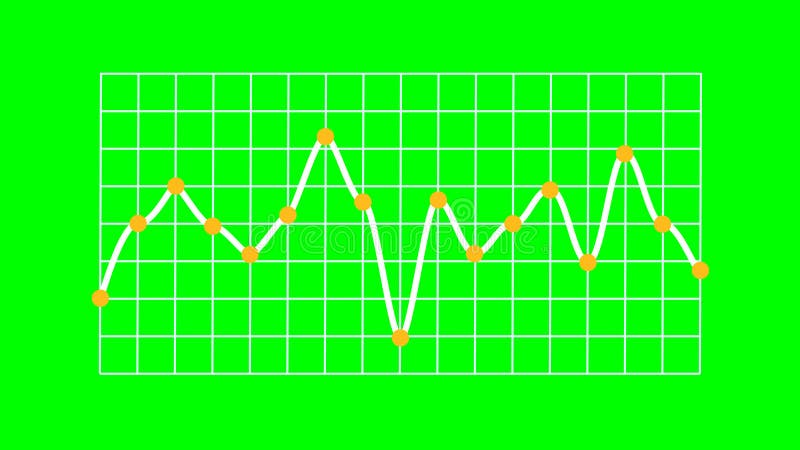
Free with trial Rendered line graph showing a single white line indicating data trends with distinct fluctuations. Yellow marker points animate vertically from the X-axis, and each plotted value features an orange circular dot. The white line runs over a structured white grid on a bright green screen background, enabling chroma keying. No axis values or units are present, emphasizing visual representation of abstract data and business trends. Line decrease illustrations Business Trend Line Graph Showing Trading on Green Screen. Rendered line graph showing a single white line indicating data trends with distinct fluctuations. Yellow marker points animate vertically from the X-axis, and each plotted value features an orange circular dot. The white line runs over a structured white grid on a bright green screen background, enabling chroma keying. No axis values or units are present, emphasizing visual representation of abstract data and business trends.
Free with trial A vector graphic showing a scooter moving down a slope, guided by a large curved arrow. It can illustrate concepts like descent, downhill riding, or even a decrease in metrics. Useful for traffic signs and instructional guides, vector design Generative AI. Line decrease vectors Scooter Going Downhill with a Curved Arrow, Slope Navigation Vector Art, vector design Generative AI. A vector graphic showing a scooter moving down a slope, guided by a large curved arrow. It can illustrate concepts like descent, downhill riding, or even a decrease in metrics. Useful for traffic signs and instructional guides, vector design Generative AI
Free with trial Black line icon for Bear market, declining, forex, stock market, falling prices and downfall. Line decrease vectors Black line icon for Bear Market, declining and reduce. Black line icon for Bear market, declining, forex, stock market, falling prices and downfall
Free with trial An icon depicting a wireless signal with diminishing waves, indicating a decrease in signal strength or a connection problem. Useful for network status displays, troubleshooting guides, or alerting users to poor connectivity, vector design Generative AI. Line decrease vectors Decreasing Signal Strength Icon, Wi-Fi Issue, Connectivity Problem, vector design Generative AI. An icon depicting a wireless signal with diminishing waves, indicating a decrease in signal strength or a connection problem. Useful for network status displays, troubleshooting guides, or alerting users to poor connectivity, vector design Generative AI
Free with trial This 3D rendered image shows a computer screen displaying various charts and graphs, including bar charts, pie charts, and line graphs. The data visualization is colorful and easy to understand, generated by AI for quick data interpretation. The design is simple and modern, ideal for presentations. Line decrease illustrations AI-Generated Data Dashboard. This 3D rendered image shows a computer screen displaying various charts and graphs, including bar charts, pie charts, and line graphs. The data visualization is colorful and easy to understand, generated by AI for quick data interpretation. The design is simple and modern, ideal for presentations
Free with trial Geometric, abstract design composed of a series of overlapping, outlined arrows pointing to the right against a white background. Arrows decrease in size as they progress, creating a sense of movement or flow. The design alternates between black and gray outlines, enhancing visual contrast and depth. Simple yet modern illustration emphasizing direction and progression. Line decrease illustrations Geometric, abstract design composed of a series of overlapping, outlined arrows
Free with trial A simple flat style vector icon featuring a pink minus sign. Represents subtraction, negative values, removal, or decrease. Suitable for calculators, data entry interfaces, financial reports, and educational materials on math. Clear and basic representation of the minus symbol, vector design Generative AI. Line decrease vectors Pink Minus Sign Icon, Subtraction, Negative Value, or Removal Symbol, vector design Generative AI. A simple flat style vector icon featuring a pink minus sign. Represents subtraction, negative values, removal, or decrease. Suitable for calculators, data entry interfaces, financial reports, and educational materials on math. Clear and basic representation of the minus symbol, vector design Generative AI
Free with trial A versatile collection of minimalist outline magnifying glass icons, perfect for various search functionalities. This set includes symbols for secure search (lock), image search, error alerts, zoom in out, quick search (lightning), and contact search (phone with notification). Ideal for UI UX design, web and mobile applications, these clean line art vectors provide clear visual cues for user interfaces, presentations, and digital projects, representing concepts like finding, exploring, and investigating information. Line decrease vectors Outline Magnifying Glass Search Icons Set. A versatile collection of minimalist outline magnifying glass icons, perfect for various search functionalities. This set includes symbols for secure search (lock), image search, error alerts, zoom in out, quick search (lightning), and contact search (phone with notification). Ideal for UI UX design, web and mobile applications, these clean line art vectors provide clear visual cues for user interfaces, presentations, and digital projects, representing concepts like finding, exploring, and investigating information.
Free with trial Co2, carbon, dioxide emissions, gas, pollution vector icon. Cloud with co2 icon. Reduce exhaust pollution air. Line pictograms. Line decrease vectors Print. Co2, carbon, dioxide emissions, gas, pollution vector icon. Cloud with co2 icon. Reduce exhaust pollution air. Line pictograms
Free with trial Percent arrows up and down icon set. Income and cost increase and decrease arrow icons. Line decrease vectors Percent arrows up and down icon set
Free with trial Red arrows with percentage symbols point downward against a white background. The arrows vary in size, creating a sense of depth. The bright red color contrasts sharply with the white, drawing attention to the downward direction. This imagery often represents a decrease or reduction, possibly in context like sales, prices, or figures. Line decrease illustrations Red arrows with percentage symbols point downward against a white backgroun
Free with trial A bold, black arrow pointing diagonally downwards against a clean white background. The arrow is stylized with broken lines suggesting rapid decline or disruption. This versatile graphic can represent economic downturn, market crash, failure, decrease, or negative trends. It's suitable for business presentations, financial reports, and website design. Line decrease illustrations Downward Trend Arrow Icon. A bold, black arrow pointing diagonally downwards against a clean white background. The arrow is stylized with broken lines suggesting rapid decline or disruption. This versatile graphic can represent economic downturn, market crash, failure, decrease, or negative trends. It's suitable for business presentations, financial reports, and website design.
Free with trial This image displays a bar graph visualizing a clear downward trend. Nine vertical blue bars gradually decrease in height from left to right, signifying a consistent decline in values. A white arrowed line diagonally descends across the graph, reinforcing the negative trend. Blue horizontal and vertical grid lines aid in alignment. The background is green screen, allowing for chroma key use. This chart effectively communicates decline in areas like business, finance, or performance. Line decrease illustrations Downward Bar Graph Showing Financial Decline on Green Screen. This image displays a bar graph visualizing a clear downward trend. Nine vertical blue bars gradually decrease in height from left to right, signifying a consistent decline in values. A white arrowed line diagonally descends across the graph, reinforcing the negative trend. Blue horizontal and vertical grid lines aid in alignment. The background is green screen, allowing for chroma key use. This chart effectively communicates decline in areas like business, finance, or performance.
Free with trial Simple vector illustration of a thermometer icon indicating a decrease in temperature. Perfect for weather apps, infographics, and presentations. Line decrease vectors Thermometer Icon Showing Temperature Drop: Simple Vector Illustration. Simple vector illustration of a thermometer icon indicating a decrease in temperature. Perfect for weather apps, infographics, and presentations.
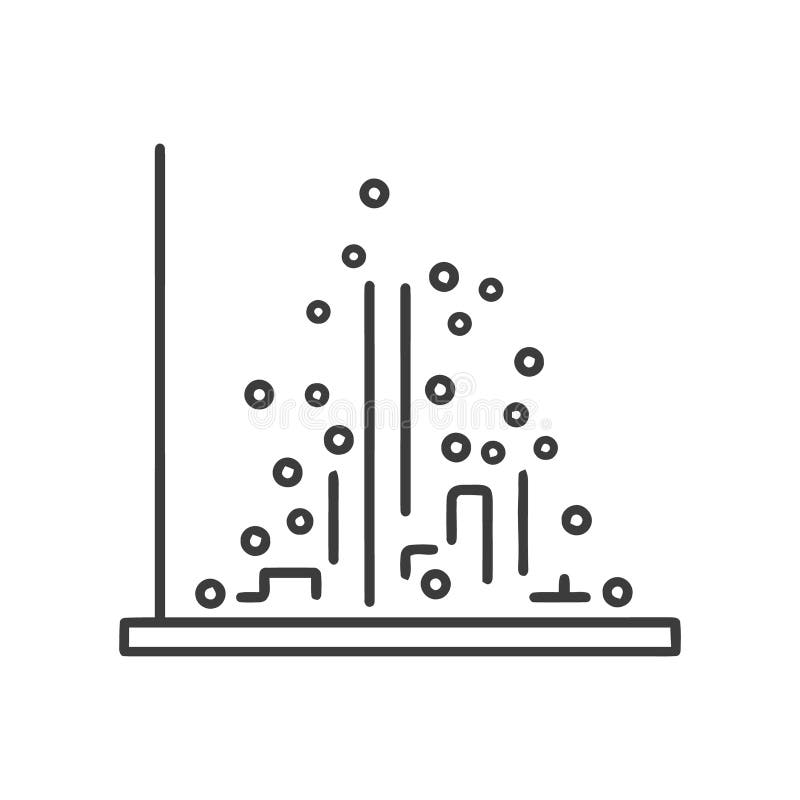
Free with trial Description: Simple line art illustration of a scatter plot graph showing an uneven distribution of data points. Perfect for presentations or reports. Line decrease vectors Abstract Data Visualization: Scatter Plot Chart with Irregular Data Points. Description: Simple line art illustration of a scatter plot graph showing an uneven distribution of data points. Perfect for presentations or reports.
Free with trial A world map with a grid overlay, featuring two trend lines in blue and orange. The blue line starts high on the left sid. Line decrease illustrations Global Trend Analysis Map. A world map with a grid overlay, featuring two trend lines in blue and orange. The blue line starts high on the left sid.
Free with trial Wi-Fi symbol featuring three arcs and a circle at the bottom. The design is rendered in 3D, with the top arc in blue and the others in light gray. The arcs decrease in size from top to bottom, creating a semi-circular pattern. The image has a clean white background, emphasizing the simplicity and modernity of the symbol, which represents wireless communication and internet connectivity. Line decrease illustrations Wi-Fi symbol featuring three arcs and a circle at the bottom. The design is render
Free with trial A line graph showing a declining stock market trend over time, with a downward sloping orange line and multiple blue and. Line decrease illustrations Stock Market Decline Graph. A line graph showing a declining stock market trend over time, with a downward sloping orange line and multiple blue and. A line graph showing a declining stock market trend over time, with a downward sloping orange line and multiple blue and.
Free with trial Concentric circular patterns of green moss (Bryophyta), forming a spiral design. The moss is densely packed and vibrant, creating a textured surface with a velvety appearance. The spirals decrease in size toward the center, creating a hypnotic and symmetrical arrangement. The vivid green color suggests a healthy, lush environment. Suitable for ornamental or artistic displays, it exemplifies natural geometry and growth patterns. Line decrease illustrations Concentric circular patterns of green moss (Bryophyta), forming a spiral design.
Free with trial A minimalist black icon depicting an arrow that features a distinct wavy, oscillating curve before straightening and pointing downwards. This graphic symbolizes a fluctuating decline, an unstable downward trend, or a challenging path with variations. Ideal for illustrating concepts such as market volatility, data fluctuations, difficult progress, or any process involving an unstable decrease. Isolated on a white background for versatile use in web, print, and presentations. Generated by AI. Line decrease vectors Black Wavy Down Arrow Icon. A minimalist black icon depicting an arrow that features a distinct wavy, oscillating curve before straightening and pointing downwards. This graphic symbolizes a fluctuating decline, an unstable downward trend, or a challenging path with variations. Ideal for illustrating concepts such as market volatility, data fluctuations, difficult progress, or any process involving an unstable decrease. Isolated on a white background for versatile use in web, print, and presentations. Generated by AI
Free with trial Ai-Generated. a collection of twentyone minimalistic graph chart icons these icons illustrate different types of data trends suitable for representing business information, statistical analysis, and financial reports each icon features a unique line graph, bar chart, or diagram style. Line decrease vectors Collection of minimalistic graph chart icons presenting different types of business data trends. Ai-Generated. a collection of twentyone minimalistic graph chart icons these icons illustrate different types of data trends suitable for representing business information, statistical analysis, and financial reports each icon features a unique line graph, bar chart, or diagram style
Free with trial A set of black icons representing percentage changes, including arrows and circular symbols. The icons depict various concepts such as decrease, increase, and rotation, all incorporating percentage signs. The simple design makes them versatile for use in financial, statistical, or educational materials. Line decrease illustrations Black percentage icons set. A set of black icons representing percentage changes, including arrows and circular symbols. The icons depict various concepts such as decrease, increase, and rotation, all incorporating percentage signs. The simple design makes them versatile for use in financial, statistical, or educational materials.
Free with trial A dynamic display of market trends with charts and graphs in a cool blue color scheme. Line decrease illustrations Financial market analysis with data charts and line graphs in blue tone. a dynamic display of market trends with charts and graphs in a cool blue color scheme
Free with trial Red 3D downward-pointing arrow with a percentage symbol (%) in white at the center. The design emphasizes the concept of a decrease or reduction, commonly used in contexts like sales, discounts, or economic indicators. The background is plain white, highlighting the arrow's bold color and shape. Line decrease illustrations Red 3D downward-pointing arrow with a percentage symbol (%) in white at the ce