Free with trial Black Circle Graphic with Horizontal White Line Symbol on White Background. Line decrease vectors Black Circle Graphic with Horizontal White Line Symbol on White Background
Free with trial A simple, stylized black and white icon depicts money being withdrawn, represented by a dollar symbol and a downwards-pointing triangle indicating a decrease or deduction in finance. Line decrease vectors Money Withdrawal Icon: Simple Black and White Design Concept. A simple, stylized black and white icon depicts money being withdrawn, represented by a dollar symbol and a downwards-pointing triangle indicating a decrease or deduction in finance.
Free with trial Four vector icons of the percent sign are displayed on a white background. The designs include: a solid black percent sign, a percent sign with outlined circles, one with a bold diagonal line and circular elements, and one with a thin outline. Line decrease vectors Icon set percent sign, simple vector design. Four vector icons of the percent sign are displayed on a white background. The designs include: a solid black percent sign, a percent sign with outlined circles, one with a bold diagonal line and circular elements, and one with a thin outline.
Free with trial Business go bankruptcy color line icon, economic crisis and money loss, downturn symbol. Closed store, kiosk, or shop building. Isolated vector linear sign of financial distress, fail and bankruptcy. Line decrease illustrations Business go bankruptcy color icon, economic crisis. Business go bankruptcy color line icon, economic crisis and money loss, downturn symbol. Closed store, kiosk, or shop building. Isolated vector linear sign of financial distress, fail and bankruptcy
Free with trial Business go bankruptcy color line icon, economic crisis and money loss, downturn symbol. Closed store, kiosk, or shop building. Isolated vector linear sign of financial distress, fail and bankruptcy. Line decrease vectors Business go bankruptcy color icon, economic crisis. Business go bankruptcy color line icon, economic crisis and money loss, downturn symbol. Closed store, kiosk, or shop building. Isolated vector linear sign of financial distress, fail and bankruptcy
Free with trial Business go bankruptcy color line icon, economic crisis and money loss, downturn symbol. Closed store, kiosk, or shop building. Isolated vector linear sign of financial distress, fail and bankruptcy. Line decrease vectors Business go bankruptcy color icon, economic crisis. Business go bankruptcy color line icon, economic crisis and money loss, downturn symbol. Closed store, kiosk, or shop building. Isolated vector linear sign of financial distress, fail and bankruptcy
Free with trial A flat depicting two distinct financial charts against a white background. The left chart a bar graph with bars in shades of green and blue, topped by a jagged blue line graph ascending towards a green percentage symbol and an upward arrow. The right chart a bar graph with bars in yellow, orange, and red, with a red line graph descending from a yellow dollar sign. Line decrease illustrations Upward and downward financial charts with percentage and dollar symbols. A flat depicting two distinct financial charts against a white background. The left chart a bar graph with bars in shades of green and blue, topped by a jagged blue line graph ascending towards a green percentage symbol and an upward arrow. The right chart a bar graph with bars in yellow, orange, and red, with a red line graph descending from a yellow dollar sign
Free with trial Line art depicting a magnifying glass focused on a declining sales graph and a thumbs-down gesture. Line decrease illustrations Declining Sales Analysis Magnifying Glass, Downward Trend, Thumbs Down. Line art depicting a magnifying glass focused on a declining sales graph and a thumbs-down gesture.
Free with trial The image displays a simplified illustration of a candlestick chart pattern, commonly used in financial markets for analyzing price movements. it features a series of vertical bars, some green and some red, representing price fluctuations over a specific period. the green bars indicate an increase in price, while the red bars indicate a decrease. each bar has a body and wicks extending above and below, showing the high, low, open, and close prices. the background is plain white. Line decrease illustrations Candlestick chart pattern simple illustration. the image displays a simplified illustration of a candlestick chart pattern, commonly used in financial markets for analyzing price movements. it features a series of vertical bars, some green and some red, representing price fluctuations over a specific period. the green bars indicate an increase in price, while the red bars indicate a decrease. each bar has a body and wicks extending above and below, showing the high, low, open, and close prices. the background is plain white.
Free with trial A magnifying glass focuses on a declining bar graph and a file folder, symbolizing a decrease in sales and the need for. Line decrease illustrations Declining Sales Analysis Magnifying Glass, Downward Graph. A magnifying glass focuses on a declining bar graph and a file folder, symbolizing a decrease in sales and the need for.
Free with trial A minimalist black and white line icon showing a stylized woman next to a descending arrow. This symbol represents concepts like failure, demotion, loss, or a downward trend. Line decrease vectors Female figure with downward arrow icon symbolizing demotion or decline. A minimalist black and white line icon showing a stylized woman next to a descending arrow. This symbol represents concepts like failure, demotion, loss, or a downward trend
Free with trial A black upward arrow merges into a downward curving line graph on a white background. Line decrease illustrations Black upward arrow and downward curve graph on white background chart. A black upward arrow merges into a downward curving line graph on a white background
Free with trial A collection of nine simple, solid black icons on a white background, illustrating concepts of decline, loss, and negative trends using various charts like bar graphs, line graphs, and pie charts with downward pointing arrows. Line decrease vectors Set of black icons representing financial decrease and downward trends. A collection of nine simple, solid black icons on a white background, illustrating concepts of decline, loss, and negative trends using various charts like bar graphs, line graphs, and pie charts with downward pointing arrows
Free with trial A comprehensive collection of hand-drawn business and data visualization icons. This doodle-style set features a variety of essential elements, including different types of arrows, bar graphs, line charts, and pie charts. The sketchy, black and white illustrations are perfect for infographics, presentations, financial reports, and marketing materials. Each icon is isolated on a white background, representing concepts like growth, statistics, process flow, and direction. This versatile vector set is ideal for adding a creative, hand-made touch to any project related to analytics, finance, or strategy. Line decrease illustrations Hand Drawn Business and Finance Doodle Icon Set. A comprehensive collection of hand-drawn business and data visualization icons. This doodle-style set features a variety of essential elements, including different types of arrows, bar graphs, line charts, and pie charts. The sketchy, black and white illustrations are perfect for infographics, presentations, financial reports, and marketing materials. Each icon is isolated on a white background, representing concepts like growth, statistics, process flow, and direction. This versatile vector set is ideal for adding a creative, hand-made touch to any project related to analytics, finance, or strategy.
Free with trial Black bird footprints are arranged diagonally from larger to smaller on a white background. Each print has three forward-pointing toes and one smaller backward-pointing toe, showcasing a typical avian foot structure. The prints gradually decrease in size, giving a perspective of depth or distance. Line decrease illustrations A flock of birds flying in a diagonal line isolated on white background. Black bird footprints are arranged diagonally from larger to smaller on a white background. Each print has three forward-pointing toes and one smaller backward-pointing toe, showcasing a typical avian foot structure. The prints gradually decrease in size, giving a perspective of depth or distance.
Free with trial A black line graph icon showing a downward trend with an arrow pointing down on a white background. Line decrease illustrations Downward Trend Graph Icon with Arrow on White Background chart decline. A black line graph icon showing a downward trend with an arrow pointing down on a white background
Free with trial Black and red arrow pointing downward on financial graph showing a decline. Business growth chart with falling trend line for investment analysis. Line decrease illustrations Black and red arrow pointing downward on financial graph showing a decline
Free with trial Collection of business growth and financial analysis icons featuring bar charts and arrows with editable line art and flat shape style. Editable vector icon set. Line decrease vectors Collection of business growth and financial analysis icons featuring bar charts and arrows with editable line art and flat shape
Free with trial Abstract geometric design featuring a tunnel-like pattern of concentric squares, alternating in vivid yellow and magenta. Squares decrease in size towards the center, creating a visual illusion of depth and motion. Each square maintains sharp, clean lines, enhancing the sense of perspective. The repetitive pattern emphasizes symmetry and uniformity throughout the composition, engaging the viewer's perception in an endless visual loop. Line decrease illustrations Abstract geometric design featuring a tunnel-like pattern of concentric squares
Free with trial Multiple stacks of gold coins are arranged in a line on a dark, reflective surface. The stacks vary in height, with the tallest on the far left and progressively shorter stacks to the right, creating a visual representation of a declining trend. The lighting is dramatic, casting reflections and highlighting the metallic sheen of the coins against the dark background. Line decrease illustrations Stacks of coins arranged in a descending line on a dark reflective surface. Multiple stacks of gold coins are arranged in a line on a dark, reflective surface. The stacks vary in height, with the tallest on the far left and progressively shorter stacks to the right, creating a visual representation of a declining trend. The lighting is dramatic, casting reflections and highlighting the metallic sheen of the coins against the dark background
Free with trial A black and white line illustration depicts a bar chart with bars of decreasing height from left to right. A thick, angular arrow points downwards across the chart, indicating a negative trend. To the upper right of the arrow, a circle contains a dollar sign, representing currency. The overall composition suggests a financial downturn or loss. Line decrease vectors Bar chart with downward trend arrow and dollar coin. A black and white line illustration depicts a bar chart with bars of decreasing height from left to right. A thick, angular arrow points downwards across the chart, indicating a negative trend. To the upper right of the arrow, a circle contains a dollar sign, representing currency. The overall composition suggests a financial downturn or loss
Free with trial This icon illustrates a volume control slider with plus and minus symbols, representing audio adjustment. It is ideal for media players, sound mixing software, and digital interfaces. The simple design clearly indicates the ability to increase or decrease sound levels in applications, vector design Generative AI. Line decrease vectors Volume Control Slider, Audio Adjustment Interface, vector design Generative AI. This icon illustrates a volume control slider with plus and minus symbols, representing audio adjustment. It is ideal for media players, sound mixing software, and digital interfaces. The simple design clearly indicates the ability to increase or decrease sound levels in applications, vector design Generative AI
Free with trial A collage of nine distinct charts and graphs, primarily displaying financial data, growth trends, and economic indicators. The visuals feature line graphs, area charts, and bar charts with various colored lines and shaded areas representing different metrics over time. Accompanying text and labels suggest analysis of business performance, economic growth, and financial markets. This collection is ideal for presentations, reports, and articles related to finance, economics, and business analytics. Line decrease illustrations Collection of Financial and Business Growth Charts. A collage of nine distinct charts and graphs, primarily displaying financial data, growth trends, and economic indicators. The visuals feature line graphs, area charts, and bar charts with various colored lines and shaded areas representing different metrics over time. Accompanying text and labels suggest analysis of business performance, economic growth, and financial markets. This collection is ideal for presentations, reports, and articles related to finance, economics, and business analytics.
Free with trial A downward trending graph line with arrow is featured against a dark night sky filled with stars, suggesting economic downturn. Line decrease illustrations Decreasing Graph in Night Sky. A downward trending graph line with arrow is featured against a dark night sky filled with stars, suggesting economic downturn
Free with trial A black curve graph depicts a revenue slowdown on a white background. Clear details and vibrant colors enhance. Line decrease illustrations Black curve graph showing revenue slowdown on white background chart line. A black curve graph depicts a revenue slowdown on a white background. Clear details and vibrant colors enhance
Free with trial Symbolizes decline or decrease, often used in financial or performance contexts to represent a downward trend. The arrow is solid red with sharp corners, maintaining a uniform thickness throughout its length. Line decrease illustrations Red zigzag arrow pointing diagonally downward on a transparent grid background. . Symbolizes decline or decrease, often used in financial or performance contexts to represent a downward trend. The arrow is solid red with sharp corners, maintaining a uniform thickness throughout its length.
Free with trial Abstract digital background featuring a radial pattern of red circles on a gradient red to orange backdrop. The circles decrease in size as they move outward from the center, creating a sunburst effect. This design conveys a sense of dynamic movement and energy, suitable for technology or artificial intelligence themes. The central area is a dark circle, providing a focal point and contrast to the vivid colors. The overall composition emphasizes symmetry and modernity. Line decrease vectors Vector digital technology background. abstract tech visual for science template. industrial artificial intelligence. Abstract digital background featuring a radial pattern of red circles on a gradient red to orange backdrop. The circles decrease in size as they move outward from the center, creating a sunburst effect. This design conveys a sense of dynamic movement and energy, suitable for technology or artificial intelligence themes. The central area is a dark circle, providing a focal point and contrast to the vivid colors. The overall composition emphasizes symmetry and modernity.
Free with trial Graphic anemia blood with few blood cells medical red blood cell volume decrease minimalist color. Line decrease illustrations Anemia blood with few blood cells medical red blood cell volume decrease minimalist color
Free with trial A composition displaying a stack of four nested white square platforms arranged concentrically. The squares progressively decrease in size from the base to the top, creating a stepped, minimalist design. The entire structure is placed on a white surface, enhancing the geometric and monochromatic aesthetic. This arrangement emphasizes symmetry and depth through its layered construction. Line decrease illustrations White layered geometric square structure in abstract 3d minimal composition with clean modern perspective. A composition displaying a stack of four nested white square platforms arranged concentrically. The squares progressively decrease in size from the base to the top, creating a stepped, minimalist design. The entire structure is placed on a white surface, enhancing the geometric and monochromatic aesthetic. This arrangement emphasizes symmetry and depth through its layered construction.
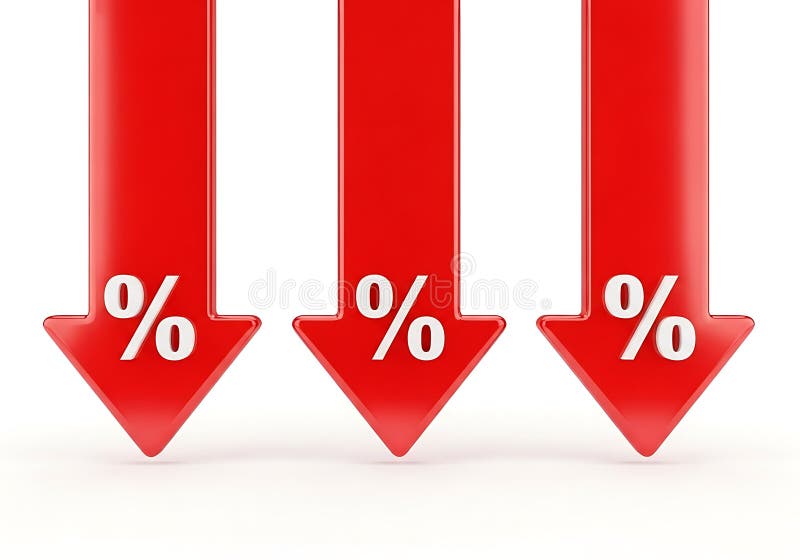
Free with trial Three large red arrows point downward, each featuring a white percentage symbol (%) centrally placed. The arrows have a glossy appearance and are equally spaced against a white background, symbolizing a decrease or reduction in percentage terms. Line decrease illustrations Percentage Decrease: Three Red Down Arrows Stock Photo. Three large red arrows point downward, each featuring a white percentage symbol (%) centrally placed. The arrows have a glossy appearance and are equally spaced against a white background, symbolizing a decrease or reduction in percentage terms.
Free with trial A vector icon of city buildings with a downward-pointing arrow. Represents urban decline, property value decrease, or economic downturn in real estate. Ideal for market analysis, urban planning challenges, and financial reports. Visualizes negative trends effectively, vector design Generative AI. Line decrease vectors City Buildings with Down Arrow Urban Decline Icon, vector design Generative AI. A vector icon of city buildings with a downward-pointing arrow. Represents urban decline, property value decrease, or economic downturn in real estate. Ideal for market analysis, urban planning challenges, and financial reports. Visualizes negative trends effectively, vector design Generative AI
Free with trial Graph with a red heart at the start and downward trend line, symbolizing breakup, relationship decline, and emotional loss over time. Line decrease vectors Graph with a red heart at the start and downward trend line, symbolizing breakup, relationship decline, and emotional loss over
Free with trial A bright blue neon arrow points downwards against a dark industrial wall, symbolizing loss or decrease for illustrative purposes. Line decrease illustrations Neon Arrow Down Indicator Graph. A bright blue neon arrow points downwards against a dark industrial wall, symbolizing loss or decrease for illustrative purposes
Free with trial This vector illustration features a set of two minimalist graphs depicting a significant decline. Each graph includes a downward-sloping line chart with an accompanying filled area, clearly indicating a negative trend. One version is presented in black on a white background, while the other is white on a black background, offering versatile usage. This icon is ideal for illustrating concepts of business loss, economic recession, market downturns, financial crisis, poor performance, or any data showing a decrease. Perfect for presentations, reports, infographics, and web design. Line decrease vectors Declining Business Graph Icon Set - Negative Trend Chart. This vector illustration features a set of two minimalist graphs depicting a significant decline. Each graph includes a downward-sloping line chart with an accompanying filled area, clearly indicating a negative trend. One version is presented in black on a white background, while the other is white on a black background, offering versatile usage. This icon is ideal for illustrating concepts of business loss, economic recession, market downturns, financial crisis, poor performance, or any data showing a decrease. Perfect for presentations, reports, infographics, and web design.
Free with trial Stock market display with a red line graph indicating a downward trend on a digital screen. The graph is composed of jagged peaks and troughs, suggesting instability. Surrounding the graph are numeric data and grid lines, highlighting market performance details. The screen is located in a financial setting with a blurred, busy background, possibly an office or trading floor, enhancing the context of economic activity. The color red typically signifies a decrease or negative trend in market terms. Line decrease illustrations Red Stock Market Crash On Screen. Stock market display with a red line graph indicating a downward trend on a digital screen. The graph is composed of jagged peaks and troughs, suggesting instability. Surrounding the graph are numeric data and grid lines, highlighting market performance details. The screen is located in a financial setting with a blurred, busy background, possibly an office or trading floor, enhancing the context of economic activity. The color red typically signifies a decrease or negative trend in market terms.
Free with trial Blue sad face next to a declining line graph in a calendar frame under a cloud. Ideal for business loss, economic crisis, emotional impact, failure, disappointment, analytics, trends. Simple flat. Line decrease vectors Sad face and declining data chart representing failure, downturn, or negative outcome concept. Blue sad face next to a declining line graph in a calendar frame under a cloud. Ideal for business loss, economic crisis, emotional impact, failure, disappointment, analytics, trends. Simple flat
Free with trial A red background features a spiral pattern composed of small yellow and white dots, creating a dynamic, swirling effect. The dots gradually decrease in size as they move toward the center of the spiral, enhancing the sense of depth and movement. The arrangement creates a visually striking design reminiscent of mathematical or optical art, emphasizing symmetry and repetition. Line decrease illustrations Red background features a spiral pattern composed of small yellow and white dots, creating a dynamic, swirling effect.
Free with trial A three-dimensional style vector icon of a down arrow. This is a versatile symbol for indicating downloads, scrolling down, or a decrease in value. Perfect for user interfaces, websites, presentations, and instructional graphics, vector design Generative AI. Line decrease vectors 3D Style Down Arrow Icon for Direction and Downloads, vector design Generative AI. A three-dimensional style vector icon of a down arrow. This is a versatile symbol for indicating downloads, scrolling down, or a decrease in value. Perfect for user interfaces, websites, presentations, and instructional graphics, vector design Generative AI
Free with trial A blue bar and line graph showing upward financial trends against a backdrop of a world map, symbolizing global economic growth and market expansion. Line decrease illustrations Global business growth chart with world map background. A blue bar and line graph showing upward financial trends against a backdrop of a world map, symbolizing global economic growth and market expansion
Free with trial Three large percentage signs are displayed on a white background. From left to right, the symbols are black, red, and light gray. Each percentage sign consists of two circles and a diagonal line, representing different emphasis or status, possibly indicating varied discount rates. Line decrease vectors Icon set percent sign, simple vector design. Three large percentage signs are displayed on a white background. From left to right, the symbols are black, red, and light gray. Each percentage sign consists of two circles and a diagonal line, representing different emphasis or status, possibly indicating varied discount rates.
Free with trial Bar chart illustration showing a descending trend. Four vertical bars in gradient hues of orange and blue decrease in height from left to right. A line graph with circles marks the top of each bar, emphasizing the downward trend. The design is simple and uses soft pastel colors, against a white background, highlighting the decreasing business data concept. Line decrease vectors Decreasing Trend Graph: Business Data Chart Illustration. Bar chart illustration showing a descending trend. Four vertical bars in gradient hues of orange and blue decrease in height from left to right. A line graph with circles marks the top of each bar, emphasizing the downward trend. The design is simple and uses soft pastel colors, against a white background, highlighting the decreasing business data concept.
Free with trial A collage of various hand-drawn charts and graphs in shades of blue, illustrating business growth, data analysis, and financial trends. The collection includes bar charts, line graphs, and pie charts, all rendered with a sketchy, artistic style. These visuals are perfect for presentations, reports, or any project requiring a dynamic and informative representation of data and progress. Line decrease illustrations Hand-Drawn Business Growth Charts and Graphs Collection. A collage of various hand-drawn charts and graphs in shades of blue, illustrating business growth, data analysis, and financial trends. The collection includes bar charts, line graphs, and pie charts, all rendered with a sketchy, artistic style. These visuals are perfect for presentations, reports, or any project requiring a dynamic and informative representation of data and progress.
Free with trial Black and white graph showing a fluctuating trend line with an upward and a downward arrow. Line decrease illustrations Black and white graph showing fluctuating trend with up and down arrows chart data. Black and white graph showing a fluctuating trend line with an upward and a downward arrow
Free with trial A graph with a curved line labeled "SOFT LANDING" shows a gradual decline on white. Line decrease illustrations Graph showing a soft landing curve with text on white background chart decline. A graph with a curved line labeled "SOFT LANDING" shows a gradual decline on white
Free with trial Modern Finance Icon set Clean Line Style on white background, Created AI. Line decrease vectors Modern Finance Icons Clean Line Style, Upbeat Financial Mood. Modern Finance Icon set Clean Line Style on white background, Created AI
Free with trial A dual flat vector icon featuring a volume down symbol and a plus sign, representing comprehensive audio adjustment. Perfect for sound mixing, multimedia software, user settings, or sound engineering, offering flexible audio control, vector design Generative AI. Line decrease vectors Volume adjustment options, add or decrease audio level, vector design Generative AI. A dual flat vector icon featuring a volume down symbol and a plus sign, representing comprehensive audio adjustment. Perfect for sound mixing, multimedia software, user settings, or sound engineering, offering flexible audio control, vector design Generative AI
Free with trial A yellow line graph shows a steep decline against a dark background, potentially representing a downturn in sales or investments. Line decrease illustrations Declining Graph on Black Background. A yellow line graph shows a steep decline against a dark background, potentially representing a downturn in sales or investments
Free with trial A minimalist set of hand-drawn icons featuring a dynamic arrow indicating movement or progress and a line graph displaying data trends, perfect for illustrating concepts of growth, analysis, and chang. Line decrease vectors Arrow and graph icons set isolated on transparent background. A minimalist set of hand-drawn icons featuring a dynamic arrow indicating movement or progress and a line graph displaying data trends, perfect for illustrating concepts of growth, analysis, and chang
Free with trial In a radial gradient on a white background, creating a dynamic optical illusion. The dots appear larger in the center and gradually decrease in size outward, giving a sense of depth and movement. The orderly design and consistent spacing highlight the contrast between the vibrant blue and the stark white, typical of halftone printing techniques. Line decrease vectors Circular dot pattern with varying sizes. Blue dots arranged. in a radial gradient on a white background, creating a dynamic optical illusion. The dots appear larger in the center and gradually decrease in size outward, giving a sense of depth and movement. The orderly design and consistent spacing highlight the contrast between the vibrant blue and the stark white, typical of halftone printing techniques.
Free with trial Pink heart shapes of varying sizes are scattered across a white background. The bottom of the image features an accumulation of larger overlapping hearts, creating a dense border. This vector design uses a simple color palette and clear, defined shapes, ideal for a romantic or Valentine's Day theme. The hearts gradually decrease in size as they spread upward, adding depth and a sense of motion. Line decrease vectors Valentine\'s Day Love and Feelings Sale Background Design Template. Vector illustration Editable. Pink heart shapes of varying sizes are scattered across a white background. The bottom of the image features an accumulation of larger overlapping hearts, creating a dense border. This vector design uses a simple color palette and clear, defined shapes, ideal for a romantic or Valentine's Day theme. The hearts gradually decrease in size as they spread upward, adding depth and a sense of motion.
Free with trial Plum Fruit Line Art Illustration with Minus Sign, Isolated Engraving Style, Food Icon. Line decrease vectors Plum Fruit Line Art Illustration with Minus Sign, Isolated Engraving Style, Food Icon
Free with trial A set of twelve black icons representing business and data analysis concepts, presented on a white background. The icons include various types of charts and graphs such as bar charts, a pie chart, and line graphs showing trends and fluctuations. There are also icons for data visualization, progress indicators, and reports. The collection is organized in a 3x4 grid. Line decrease vectors Business and data analytics icons bar chart pie chart AI-Generated. A set of twelve black icons representing business and data analysis concepts, presented on a white background. The icons include various types of charts and graphs such as bar charts, a pie chart, and line graphs showing trends and fluctuations. There are also icons for data visualization, progress indicators, and reports. The collection is organized in a 3x4 grid
Free with trial Abstract close-up view of a digital display showing a fluctuating financial chart. The orange graph line is highlighted against a dark blue background with a complex grid pattern, suggesting data streaming and analysis. The image evokes a sense of technology, market trends, and financial information. Suitable for use in articles, presentations, or websites related to finance, technology, data analysis, and business. Line decrease illustrations Dynamic Financial Data Visualization. Abstract close-up view of a digital display showing a fluctuating financial chart. The orange graph line is highlighted against a dark blue background with a complex grid pattern, suggesting data streaming and analysis. The image evokes a sense of technology, market trends, and financial information. Suitable for use in articles, presentations, or websites related to finance, technology, data analysis, and business.
Free with trial A downward pointing V shape arrow icon, perfect for indicating decline, decrease, or a bottoming out. This scalable vector graphic is ideal for financial charts, trend analysis, or negative indicators. Its simple design ensures clarity, making it effective for conveying downward movement or completion, vector design Generative AI. Line decrease vectors Downward Pointing V Shape Arrow Icon, vector design Generative AI. A downward pointing V shape arrow icon, perfect for indicating decline, decrease, or a bottoming out. This scalable vector graphic is ideal for financial charts, trend analysis, or negative indicators. Its simple design ensures clarity, making it effective for conveying downward movement or completion, vector design Generative AI
Free with trial Black concentric circles create a hypnotic spiral pattern against a gray background. The circles decrease in size as they move inward, forming an illusion of depth. The design draws the eye to the center, creating a visual effect often associated with optical illusions or hypnosis. The stark contrast between the black circles and the light background enhances the spiral's three-dimensional appearance. Line decrease illustrations Black concentric circles create a hypnotic spiral pattern against a gray
Free with trial A simple line graph with an orange shaded area showing inflow and outflow dynamics with labeled axes and curves. Line decrease illustrations Upward and Downward Sloping Curves Illustrating Inflow and Outflow Dynamics graph chart. A simple line graph with an orange shaded area showing inflow and outflow dynamics with labeled axes and curves
Free with trial Vector icon showing a diagonal arrow pointing down and to the right. Represents direction, decrease, trend, or movement. Simple graphic suitable for charts, diagrams, or interface navigation, vector design Generative AI. Line decrease vectors Down Right Diagonal Arrow Vector Icon Graphic, vector design Generative AI. Vector icon showing a diagonal arrow pointing down and to the right. Represents direction, decrease, trend, or movement. Simple graphic suitable for charts, diagrams, or interface navigation, vector design Generative AI
Free with trial A stylized text icon with DOWNWARD TWNND and a down arrow with a heart. Represents downward trends, decline, or negative statistics. Ideal for financial reports, market analysis, or abstract concepts. Visually impactful for data representation, vector design Generative AI. Line decrease vectors Downward Trend Decrease Arrow Icon Vector Design Generative AI. A stylized text icon with DOWNWARD TWNND and a down arrow with a heart. Represents downward trends, decline, or negative statistics. Ideal for financial reports, market analysis, or abstract concepts. Visually impactful for data representation, vector design Generative AI
Free with trial An illustration representing low mental energy and fatigue. A simple line drawing of a human head with a battery symbol inside, showing decreasing power levels. The battery has three bars, colored green, green, and yellow, indicating low power. The image includes a downward arrow and various colorful celestial symbols. Line decrease vectors Low mental energy and fatigue concept. An illustration representing low mental energy and fatigue. A simple line drawing of a human head with a battery symbol. An illustration representing low mental energy and fatigue. A simple line drawing of a human head with a battery symbol inside, showing decreasing power levels. The battery has three bars, colored green, green, and yellow, indicating low power. The image includes a downward arrow and various colorful celestial symbols.
Free with trial Blue heart patterns arranged in vertical rows against a white background. Each heart is followed by a vertical line of dots that decrease in size. The repetitive design creates a seamless and uniform appearance, suitable for fabric or wallpaper. Line decrease illustrations Vertical Blue Heart Chain Seamless Pattern on White Background. Blue heart patterns arranged in vertical rows against a white background. Each heart is followed by a vertical line of dots that decrease in size. The repetitive design creates a seamless and uniform appearance, suitable for fabric or wallpaper.
Free with trial The image shows a stock market crash represented by a downward-sloping line graph against a backdrop of a galaxy filled with stars and nebulous clouds. the line graph, rendered in a light purple hue, indicates a significant decline, culminating in a sharp drop represented by an arrow pointing downwards. the background galaxy adds a dramatic and symbolic layer, suggesting a cosmic scale of economic downturn. Line decrease illustrations Stock market crash in a galaxy background. the image shows a stock market crash represented by a downward-sloping line graph against a backdrop of a galaxy filled with stars and nebulous clouds. the line graph, rendered in a light purple hue, indicates a significant decline, culminating in a sharp drop represented by an arrow pointing downwards. the background galaxy adds a dramatic and symbolic layer, suggesting a cosmic scale of economic downturn.
Free with trial Black and white clipboard icon featuring a checklist. The design includes an "X" and three dots in a vertical line, symbolizing tasks or points, followed by a downward-curving arrow. The arrow suggests a downward trend or progression. The icon is simple, with thick lines, and is typically used to represent concepts in planning, business analysis, or project management. The background is plain, emphasizing the clipboard graphic. Line decrease vectors Clipboard checklist with downward trend. Black and white clipboard icon featuring a checklist. The design includes an "X" and three dots in a vertical line, symbolizing tasks or points, followed by a downward-curving arrow. The arrow suggests a downward trend or progression. The icon is simple, with thick lines, and is typically used to represent concepts in planning, business analysis, or project management. The background is plain, emphasizing the clipboard graphic.
Free with trial Illustrated business chart displays a drop in finances, demonstrated through declining bar graphs and a downward trending line. Geometric shapes and a dollar sign add visual interest to the illustration. Line decrease illustrations Financial Decline Shown by Business Chart with Graphic Elements. Illustrated business chart displays a drop in finances, demonstrated through declining bar graphs and a downward trending line. Geometric shapes and a dollar sign add visual interest to the illustration.
Free with trial The image displays a green line graph illustrating a sharp decline. the graph is set against a backdrop of a stylized forest scene, also rendered in shades of green. the overall impression is one of environmental or economic downturn, with the forest possibly symbolizing natural resources or a green economy. the graph's dramatic downward trajectory emphasizes the severity of the decline being depicted. Line decrease illustrations Green decline graph with forest background. the image displays a green line graph illustrating a sharp decline. the graph is set against a backdrop of a stylized forest scene, also rendered in shades of green. the overall impression is one of environmental or economic downturn, with the forest possibly symbolizing natural resources or a green economy. the graph's dramatic downward trajectory emphasizes the severity of the decline being depicted.
Free with trial An abstract logo combines a wave design with a circular motif. The wave, depicted in gradient shades of blue and white, rises towards a semicircular array of white dots on a dark blue background, suggesting motion and fluidity. The dots decrease in size as they radiate outward from the wave's crest. The symmetrical arrangement creates a harmonious blend of elements, evoking themes of water and dynamics. The circular formation above the wave gives it a balanced and unified appearance, suitable for branding. Line decrease illustrations An abstract logo combines a wave design with a circular motif. The wave, depicted
Free with trial A hand in a black suit sleeve points downward against a red background. A jagged downward arrow, representing decline or decrease, is displayed in the background. The color palette includes flesh tones for the hand and bright red for the background. The image conveys a sense of negative economic or financial performance. Line decrease illustrations A hand in a black suit sleeve points downward against a red background. A jagged
Free with trial A descending line graph illustrates a negative financial trend against a backdrop of a dimly lit room with a window, symbolizing economic downturns. Line decrease illustrations Downward Financial Trend Graph in Dark Room. A descending line graph illustrates a negative financial trend against a backdrop of a dimly lit room with a window, symbolizing economic downturns
Free with trial The image shows a rusty metal chart depicting a downward trend, placed on a wet, dark industrial floor. the chart is designed with sharp angles, forming a line graph that consistently declines, ending with an arrow pointing downwards. the floor reflects the chart, creating a mirrored image that enhances the sense of decline and loss. the background is blurred, suggesting an industrial setting with dim lighting and a sense of neglect. the overall atmosphere is somber, conveying a message of economic downturn or failure. Line decrease illustrations Rusty decline chart on wet industrial floor. the image shows a rusty metal chart depicting a downward trend, placed on a wet, dark industrial floor. the chart is designed with sharp angles, forming a line graph that consistently declines, ending with an arrow pointing downwards. the floor reflects the chart, creating a mirrored image that enhances the sense of decline and loss. the background is blurred, suggesting an industrial setting with dim lighting and a sense of neglect. the overall atmosphere is somber, conveying a message of economic downturn or failure.
Free with trial Vector icons of money. The official currency of Japan. Banknotes and coins. Checks and bank accounts, payments and credit cards. Increase and decrease in value, spending and saving. Editable stroke. Line decrease vectors Vector icons of money. The official currency of Japan. Banknotes and coins. Checks and bank accounts, payments and credit cards.
Free with trial A magnifying glass with a minus sign, used to represent zooming out, reduction, or decreasing focus. Ideal for user interfaces and image manipulation tools, vector design Generative AI. Line decrease vectors Magnifying Glass with Minus, for Zoom Out, Reduction, and Decrease, vector design Generative AI. A magnifying glass with a minus sign, used to represent zooming out, reduction, or decreasing focus. Ideal for user interfaces and image manipulation tools, vector design Generative AI