Free with trial Line art icon featuring a magnifying glass positioned over a vertical bar chart. The design is simple and minimalistic, using grey lines. The bar chart consists of three bars of varying heights, and the magnifying glass is centered over the middle bar, suggesting examination or analysis of data. This icon is likely used to symbolize data analysis, inspection, or detailed observation in a graphical representation. Performance decrease vectors Line art icon of magnifying glass over bar chart. Line art icon featuring a magnifying glass positioned over a vertical bar chart. The design is simple and minimalistic, using grey lines. The bar chart consists of three bars of varying heights, and the magnifying glass is centered over the middle bar, suggesting examination or analysis of data. This icon is likely used to symbolize data analysis, inspection, or detailed observation in a graphical representation.
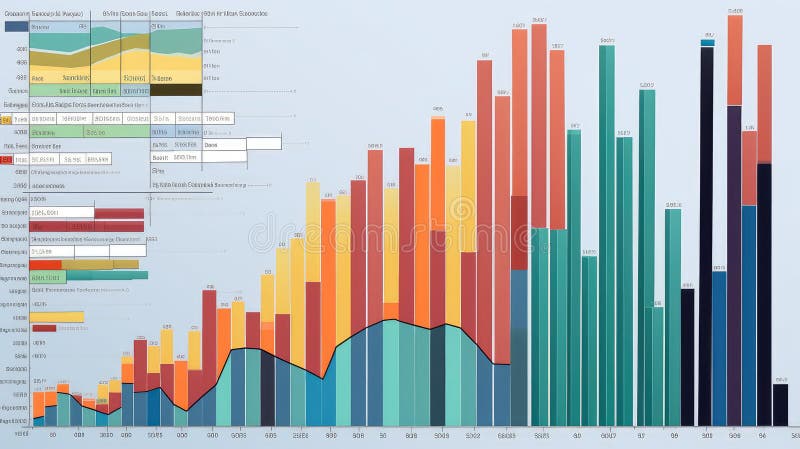
Free with trial Business Meeting on Real Estate Market Analysis with Charts, Graphs, and Digital House Icon Showing Trends in Property Value Changes Sigmoid. Performance decrease illustrations Professionals discuss real estate market trends using data and analytics. A digital house icon symbolizes value changes. Business Meeting on Real Estate Market Analysis with Charts, Graphs, and Digital House Icon Showing Trends in Property Value Changes Sigmoid
Free with trial A blue bar chart shows a downward trend indicated by a sharp red arrow. Isolated on a transparent background. Performance decrease vectors Blue bar chart with red downward trending arrow isolated on a transparent background. A blue bar chart shows a downward trend indicated by a sharp red arrow. Isolated on a transparent background
Free with trial A green line graph illustrating data points over time, with the y-axis labeled 'Value' and the x-axis labeled 'Time', showcasing significant ups and downs in the data. Performance decrease illustrations Line graph showing fluctuating values over time. A green line graph illustrating data points over time, with the y-axis labeled 'Value' and the x-axis labeled 'Time', showcasing significant ups and downs in the data
Free with trial A clean and modern graphic featuring the number '5%' prominently displayed on a soft, golden gradient background. A bright, circular spotlight effect emanates from the right side, creating a sense of illumination and focus. This versatile image is ideal for representing discounts, sales, special offers, promotions, or any concept related to a five percent value. The minimalist design and ample negative space make it perfect for adding text overlays or integrating into various marketing materials. Performance decrease illustrations Five Percent Discount - Clean Gradient Background with Spotlight Effect. A clean and modern graphic featuring the number '5%' prominently displayed on a soft, golden gradient background. A bright, circular spotlight effect emanates from the right side, creating a sense of illumination and focus. This versatile image is ideal for representing discounts, sales, special offers, promotions, or any concept related to a five percent value. The minimalist design and ample negative space make it perfect for adding text overlays or integrating into various marketing materials.
Free with trial Futuristic Robotic Hand Interacting with Digital Interface for Cost Analysis and Reduction Strategies in Business Environment Quark. Performance decrease illustrations Futuristic Robotic Hand Interacting with Digital Interface for Cost Analysis and Reduction Strategies in Business
Free with trial Cost Analysis in Business Strategy: Hands on Laptop with Graphs and Icons Representing Marketing, Planning, and Research in Contemporary Workspace Quark. Performance decrease illustrations Cost Analysis in Business Strategy: Hands on Laptop with Graphs and Icons Representing Marketing, Planning, and Research
Free with trial Robotic Hand Interacting with Digital Cost Reduction Interface in a Futuristic Cityscape with Data Graphs and Business Icons Quark. Performance decrease illustrations Robotic Hand Interacting with Digital Cost Reduction Interface in a Futuristic Cityscape with Data Graphs and Business
Free with trial This vector illustration set features six distinct icons representing key financial and economic concepts. It includes bar charts depicting growth with a green arrow and decline with a red arrow, alongside currency exchange rate indicators for USD, INR, and EUR. Two donut charts visualize data distribution, while a world map colored green and red signifies global market trends or segmentation. Ideal for business presentations, financial reports, economic analysis, and investment-related content, these versatile graphics convey complex data clearly and concisely. Performance decrease vectors Financial Growth, Decline, and Global Market Data Visualization Icons Set. This vector illustration set features six distinct icons representing key financial and economic concepts. It includes bar charts depicting growth with a green arrow and decline with a red arrow, alongside currency exchange rate indicators for USD, INR, and EUR. Two donut charts visualize data distribution, while a world map colored green and red signifies global market trends or segmentation. Ideal for business presentations, financial reports, economic analysis, and investment-related content, these versatile graphics convey complex data clearly and concisely.
Free with trial A hand interacts with vibrant financial charts, showcasing data trends through modern technology and digital interfaces, ideal for conveying analytics and growth. Scalp. Performance decrease illustrations Hand Interacting with Financial Growth Chart Displaying Data Trends and Indicators Through Interactive Technology and. A hand interacts with vibrant financial. A hand interacts with vibrant financial charts, showcasing data trends through modern technology and digital interfaces, ideal for conveying analytics and growth. Scalp
Free with trial A stark red arrow dramatically descends across a series of blue bars, illustrating a significant downward trend. Performance decrease illustrations Red arrow shows sharp decline on blue bar graph. A stark red arrow dramatically descends across a series of blue bars, illustrating a significant downward trend
Free with trial Businessman in suit drawing a downward trending graph with the word RISK Clear details and vibrant colors enha. Performance decrease illustrations Businessman drawing a downward trending graph with the word RISK risk chart. Businessman in suit drawing a downward trending graph with the word RISK Clear details and vibrant colors enha
Free with trial Black and white line graph comparing nominal and real return over time with axes labeled. Performance decrease illustrations Black and white line graph showing nominal and real return over time chart nominal return. Black and white line graph comparing nominal and real return over time with axes labeled
Free with trial Three black rectangular bars of decreasing height arranged horizontally on a white background. Performance decrease illustrations Three Descending Black Bar Chart Blocks on White Background graph data. Three black rectangular bars of decreasing height arranged horizontally on a white background
Free with trial Black icon of a fluctuating graph with a downward trend arrow on a white background. Performance decrease illustrations Black icon of a fluctuating graph with downward trend arrow chart data. Black icon of a fluctuating graph with a downward trend arrow on a white background
Free with trial A stark red arrow graphically depicts a significant downward trend on a white chart, symbolizing financial loss or market crash. Performance decrease illustrations Red arrow graph showing sharp financial decline. A stark red arrow graphically depicts a significant downward trend on a white chart, symbolizing financial loss or market crash
Free with trial Year data charts illustration color coded, categories month, total representation year data charts. Performance decrease illustrations Year data charts
Free with trial Black bar graph with downward arrows indicating a decline or loss on a white background. Performance decrease illustrations Falling bar graph with downward arrows indicating decline or loss chart. Black bar graph with downward arrows indicating a decline or loss on a white background
Free with trial Aerial View of Business Professionals Collaborating on Cost Analysis with Laptop and Digital Graphs on Table in Modern Office Setting Quark. Performance decrease illustrations Aerial View of Business Professionals Collaborating on Cost Analysis with Laptop and Digital Graphs on Table in Modern
Free with trial Satisfaction meter offset shadow line icon. Customer experience, commerce. Measurement indicator. Sad, happy. Bold outline symbol with solid red fill. Modern flat illustration. Editable stroke. Performance decrease vectors Satisfaction meter offset shadow line icon
Free with trial Business Team Analyzing Cost Management Strategies Using Digital Technology in a Modern Workspace Environment Quark. Performance decrease illustrations Business Team Analyzing Cost Management Strategies Using Digital Technology in a Modern Workspace Environment Quark
Free with trial A close-up view of black financial and business chart icons arranged in a grid on a light background. Performance decrease illustrations Close-up of financial and business chart icons on a grid finance charts. A close-up view of black financial and business chart icons arranged in a grid on a light background
Free with trial Cost optimization concept. Man with huge pencil near calculator and graphs, diagrams and charts. Financial literacy and management of expenses. Price reduction. Flat vector illustration. Performance decrease vectors Cost optimization concept. Man with huge pencil near calculator and graphs, diagrams and charts. Financial literacy and management
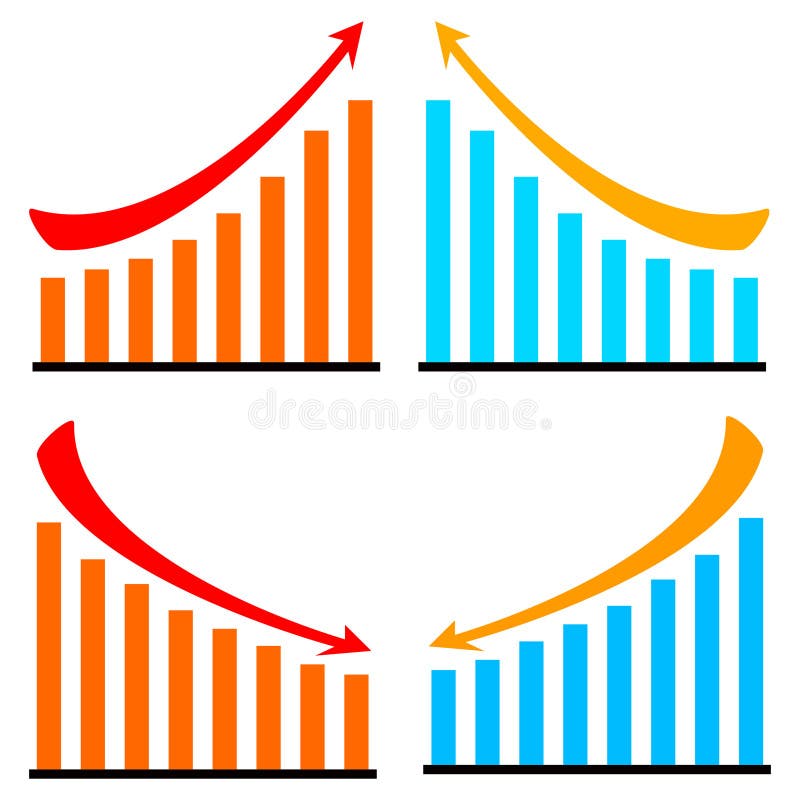
Free with trial Ascending and descending graph set. Vector illustration. Performance decrease vectors Ascending and descending graph set.
Free with trial Conceptual Image of Cost Analysis with Hands Reaching Out to Digital Graphs and Icons Representing Business Strategy and Financial Planning Quark. Performance decrease illustrations Conceptual Image of Cost Analysis with Hands Reaching Out to Digital Graphs and Icons Representing Business Strategy and
Free with trial Black icon of a falling graph with a downward arrow on a white background. Clear details and vibrant colors en. Performance decrease illustrations Falling Graph with Downward Arrow Icon on White Background downward trend decline. Black icon of a falling graph with a downward arrow on a white background. Clear details and vibrant colors en
Free with trial Ascending and descending graph set. Vector illustration. Performance decrease vectors Ascending and descending graph set.
Free with trial Green up and red down 3d arrow graph showing rising, descending trend, business result, profit or loss symbol symbol. Business arrow, goals concept. 3d world money symbols. Financial growth vector isolated. Performance decrease vectors Green up and red down 3d arrow graph showing rising, descending trend, business result, profit. world money symbols. Green up and red down 3d arrow graph showing rising, descending trend, business result, profit or loss symbol symbol. Business arrow, goals concept. 3d world money symbols. Financial growth vector isolated
Free with trial Green up and red down 3d arrow graph showing rising, descending trend, business result, profit or loss symbol symbol. Business arrow, goals concept. 3d world money symbols. Financial growth vector isolated. Performance decrease vectors Green up and red down 3d arrow graph showing rising, descending trend, business result, profit. world money symbols. Green up and red down 3d arrow graph showing rising, descending trend, business result, profit or loss symbol symbol. Business arrow, goals concept. 3d world money symbols. Financial growth vector isolated
Free with trial Green up and red down 3d arrow graph showing rising, descending trend, business result, profit or loss symbol symbol. Business arrow, goals concept. 3d world money symbols. Financial growth vector isolated. Performance decrease vectors Green up and red down 3d arrow graph showing rising, descending trend, business result, profit. world money symbols. Green up and red down 3d arrow graph showing rising, descending trend, business result, profit or loss symbol symbol. Business arrow, goals concept. 3d world money symbols. Financial growth vector isolated
Free with trial Green up and red down 3d arrow graph showing rising, descending trend, business result, profit or loss symbol symbol. Business arrow, goals concept. 3d world money symbols. Financial growth vector isolated. Performance decrease vectors Green up and red down 3d arrow graph showing rising, descending trend, business result, profit. world money symbols. Green up and red down 3d arrow graph showing rising, descending trend, business result, profit or loss symbol symbol. Business arrow, goals concept. 3d world money symbols. Financial growth vector isolated
Free with trial Green up and red down 3d arrow graph showing rising, descending trend, business result, profit or loss symbol symbol. Business arrow, goals concept. 3d world money symbols. Financial growth vector isolated. Performance decrease vectors Green up and red down 3d arrow graph showing rising, descending trend, business result, profit. world money symbols. Green up and red down 3d arrow graph showing rising, descending trend, business result, profit or loss symbol symbol. Business arrow, goals concept. 3d world money symbols. Financial growth vector isolated
Free with trial Business professional analyzing cost reduction strategies with digital interface, graphic icons, and keyboard input in modern office environment Quark. Performance decrease illustrations Business professional analyzing cost reduction strategies with digital interface, graphic icons, and keyboard input in
Free with trial Hands Collaborating to Represent Efficiency in Artificial Intelligence with Rising Quality and Falling Cost Graphs in a Modern Business Concept Gluon. Performance decrease illustrations Hands Collaborating to Represent Efficiency in Artificial Intelligence with Rising Quality and Falling Cost Graphs in a
Free with trial Futuristic Robot Hand Interacting with Cost Analysis Concepts on Digital Screen in Modern Business Environment Quark. Performance decrease illustrations Futuristic Robot Hand Interacting with Cost Analysis Concepts on Digital Screen in Modern Business Environment Quark
Free with trial Blue bar chart with decreasing values beside a soft cloud shape and horizontal lines. Ideal for data analytics, cloud computing, business growth, technology, forecasts, trends, and innovation. Simple. Performance decrease illustrations Minimalist Bar Chart with Cloud Element Representing Data Analysis and Cloud Computing Concepts. Blue bar chart with decreasing values beside a soft cloud shape and horizontal lines. Ideal for data analytics, cloud computing, business growth, technology, forecasts, trends, and innovation. Simple
Free with trial Illustration of a business activities. Performance decrease vectors Illustration of a business activities
Free with trial Illustration of a business activities. Performance decrease vectors Illustration of a business activities
Free with trial Illustration of a business activities. Performance decrease vectors Illustration of a business activities
Free with trial A black curve graph depicts a revenue slowdown on a white background. Clear details and vibrant colors enhance. Performance decrease illustrations Black curve graph showing revenue slowdown on white background chart line. A black curve graph depicts a revenue slowdown on a white background. Clear details and vibrant colors enhance
Free with trial Three black bars with downward arrows indicating decline on white background Clear details and vibrant colors. Performance decrease illustrations Three black bars with downward arrows on white background bar chart graph. Three black bars with downward arrows indicating decline on white background Clear details and vibrant colors
Free with trial A white line graph with connected points and a bar chart are shown within a dark gray circle icon, representing data analysis. Performance decrease illustrations White line graph and bar chart in a dark gray circle icon data statistics. A white line graph with connected points and a bar chart are shown within a dark gray circle icon, representing data analysis
Free with trial Businessman running downhill with briefcase representing financial collapse, risk, and instability. Ideal for failure, crisis, and economic downturn visuals. Performance decrease vectors Business failure concept with running businessman downhill showing loss risk collapse and financial instability. Businessman running downhill with briefcase representing financial collapse, risk, and instability. Ideal for failure, crisis, and economic downturn visuals
Free with trial Business Professional Highlighting Cost Management Strategies on a Digital Tablet with Visual Diagram and Infographic Elements Quark. Performance decrease illustrations Business Professional Highlighting Cost Management Strategies on a Digital Tablet with Visual Diagram and Infographic
Free with trial A robotic hand extends toward dynamic financial graphs and data in a cosmic setting. This image symbolizes the intersection of technology and finance, showcasing innovation. Scalp. Performance decrease illustrations Futuristic robotic hand reaching towards digital financial graphs and data visualizations in a cosmic background with. A robotic hand extends toward dynamic financial graphs and data in a cosmic setting. This image symbolizes the intersection of technology and finance, showcasing innovation. Scalp
Free with trial A vibrant and modern illustration of a bar graph, featuring four bars of varying heights and colors: blue, green, orange, and red. The bars are positioned on a gray horizontal line, creating a sense of data comparison and visual hierarchy. This image is ideal for representing data, statistics, business reports, financial analysis, or any concept requiring visual data representation. The clean design and bright colors make it suitable for presentations, websites, and marketing materials. Performance decrease illustrations Colorful Bar Graph Illustration. A vibrant and modern illustration of a bar graph, featuring four bars of varying heights and colors: blue, green, orange, and red. The bars are positioned on a gray horizontal line, creating a sense of data comparison and visual hierarchy. This image is ideal for representing data, statistics, business reports, financial analysis, or any concept requiring visual data representation. The clean design and bright colors make it suitable for presentations, websites, and marketing materials.
Free with trial A businessperson in a blue suit holds a glowing orb with upward and downward arrows labeled and cost. Performance decrease illustrations Businessperson holding glowing orb with and cost arrows above laptop hand. A businessperson in a blue suit holds a glowing orb with upward and downward arrows labeled and cost.
Free with trial Robotic Hand Holding Computer Display with Cost Reduction Concept, Analyzing Data and Strategies for Business Growth in Digital World Quark. Performance decrease illustrations Robotic Hand Holding Computer Display with Cost Reduction Concept, Analyzing Data and Strategies for Business Growth in
Free with trial A 3D blue bar chart and a dark blue line graph illustrate a significant downward trend, indicating a decline in data over time. Performance decrease illustrations Blue bar chart and line graph showing downward trend. A 3D blue bar chart and a dark blue line graph illustrate a significant downward trend, indicating a decline in data over time.
Free with trial Futuristic Robot Hand Interacting with Cost Analysis Concept on a Digital Screen for Business Strategies and Financial Planning Insights Quark. Performance decrease illustrations Futuristic Robot Hand Interacting with Cost Analysis Concept on a Digital Screen for Business Strategies and Financial
Free with trial A visual representation of a business or financial metric showing a significant decline, depicted by a series of blue bars and a descending red arrow. Performance decrease illustrations Bar chart with red arrow indicating a downward trend. A visual representation of a business or financial metric showing a significant decline, depicted by a series of blue bars and a descending red arrow
Free with trial Strategic Business Meeting on Artificial Intelligence Implementation with Quality and Cost Considerations for Enhanced Decision-Making in Modern Organizations Gluon. Performance decrease illustrations Strategic Business Meeting on Artificial Intelligence Implementation with Quality and Cost Considerations for Enhanced
Free with trial Set of six black business charts icons showing growth and decline trends with arrows and bars in vector style clear and simple design calm. Generative AI. Performance decrease vectors Business growth and decline charts arrows statistics bar graph icons vector illustration. Set of six black business charts icons showing growth and decline trends with arrows and bars in vector style clear and simple design calm. Generative AI
Free with trial A simple line graph showing a downward trend with an arrow pointing down on a white background. Performance decrease illustrations Downward trending line graph with arrow indicating decline business finance. A simple line graph showing a downward trend with an arrow pointing down on a white background
Free with trial A visual representation of declining trends, depicted by a graph with red and blue lines moving downwards, symbolizing a negative trajectory or market shift. Performance decrease illustrations Downward trending graph with word trends. A visual representation of declining trends, depicted by a graph with red and blue lines moving downwards, symbolizing a negative trajectory or market shift
Free with trial A hand in a suit jacket holds up an upward arrow for quality and a downward arrow for cost against a dark background with glowing particles. Performance decrease illustrations Hand holding upward quality and downward cost percentages business open palm. A hand in a suit jacket holds up an upward arrow for quality and a downward arrow for cost against a dark background with glowing particles
Free with trial Robotic Hand Interacting with Cost Reduction Concept on Digital Screen in a High-Tech Cityscape Background for Business Applications Quark. Performance decrease illustrations Robotic Hand Interacting with Cost Reduction Concept on Digital Screen in a High-Tech Cityscape Background for Business
Free with trial Blue sad face next to a declining line graph in a calendar frame under a cloud. Ideal for business loss, economic crisis, emotional impact, failure, disappointment, analytics, trends. Simple flat. Performance decrease vectors Sad face and declining data chart representing failure, downturn, or negative outcome concept. Blue sad face next to a declining line graph in a calendar frame under a cloud. Ideal for business loss, economic crisis, emotional impact, failure, disappointment, analytics, trends. Simple flat
Free with trial Abstract 3D render of a financial growth chart. The image features a series of vertical bars, some in teal and others in orange, representing data points on a graph. The bars increase in height towards the right, suggesting positive growth or progress. The chart is set against a dark background with a subtle grid pattern and a reflective surface, adding depth and visual interest. Suitable for illustrating financial reports, market analysis, or business trends. Performance decrease illustrations Abstract Financial Growth Chart. Abstract 3D render of a financial growth chart. The image features a series of vertical bars, some in teal and others in orange, representing data points on a graph. The bars increase in height towards the right, suggesting positive growth or progress. The chart is set against a dark background with a subtle grid pattern and a reflective surface, adding depth and visual interest. Suitable for illustrating financial reports, market analysis, or business trends.
Free with trial Futuristic Robotic Hand Interacting with Cost Analysis Interface and Business Strategy Elements in a Digital Environment Quark. Performance decrease illustrations Futuristic Robotic Hand Interacting with Cost Analysis Interface and Business Strategy Elements in a Digital Environment
Free with trial A bright blue easel holds a whiteboard displaying a bar chart with a clear downward trend. The bars transition in color from green to red, and a prominent red arrow points downwards, emphasizing the decline. The illustration is set against a clean white background. Performance decrease illustrations Blue Easel Displaying a Downward Trend Bar Chart with Red Arrow graph decline. A bright blue easel holds a whiteboard displaying a bar chart with a clear downward trend. The bars transition in color from green to red, and a prominent red arrow points downwards, emphasizing the decline. The illustration is set against a clean white background
Free with trial Futuristic Robot Hand Representing Cost Reduction Strategies in Digital Business Environment with Graphs and Icons Quark. Performance decrease illustrations Futuristic Robot Hand Representing Cost Reduction Strategies in Digital Business Environment with Graphs and Icons Quark
Free with trial A blue bar and line graph showing upward financial trends against a backdrop of a world map, symbolizing global economic growth and market expansion. Performance decrease illustrations Global business growth chart with world map background. A blue bar and line graph showing upward financial trends against a backdrop of a world map, symbolizing global economic growth and market expansion
Free with trial A simple black silhouette of a bar chart with varying heights on a white background. The icon represents data analysis and statistical representation. Performance decrease vectors Bar chart icon for data analysis and statistics graph. A simple black silhouette of a bar chart with varying heights on a white background. The icon represents data analysis and statistical representation
Free with trial Up and down sign with green and black arrows in flat style showing movement direction and sales change. Vector illustration of a sales bar chart icon used as an elevator symbol or universal pictogram. Performance decrease vectors Up and down sign with green and black arrows in flat style showing movement direction
Free with trial 3D red bar graph with downward arrows indicating decline. Suitable for diverse creative needs. Performance decrease illustrations 3D red bar graph with downward arrows indicating decline.
Free with trial Hand Drawn Downward Trend Arrow On white Background. Performance decrease illustrations Hand-drawn black zigzag line ending with a downward arrow On white Background, symbolizing decline or negative trend. Hand Drawn Downward Trend Arrow On white Background
Free with trial A graph displays trading data with green and red bars showing price changes during a stock trading session. Investors analyze the fluctuations and trends. Performance decrease vectors A graph displays trading data with green and red bars showing price changes during a stock trading session. Investors analyze the
Free with trial Sales data trends illustration figures products, quarter chbar, highlight market sales data trends. Performance decrease illustrations Sales data trends
Free with trial Financial stock market chart with falling red arrow and rising green arrow. Business growth and decline concept for economic analysis success failure and investment. Performance decrease vectors Red decreasing and green increasing arrows representing market trend analytics. Financial stock market chart with falling red arrow and rising green arrow. Business growth and decline concept for economic analysis success failure and investment
Free with trial A black silhouette of a bar chart with three bars of decreasing height, representing a downward trend on a white background. Performance decrease illustrations Black Bar Chart Icon Showing Decreasing Values on White Background graph data. A black silhouette of a bar chart with three bars of decreasing height, representing a downward trend on a white background
Free with trial A person in a suit uses a stylus on a tablet displaying a quality cost checklist with upward and downward arrows. Performance decrease illustrations Businessman using stylus on tablet with quality cost checklist and award image. A person in a suit uses a stylus on a tablet displaying a quality cost checklist with upward and downward arrows
Free with trial A collage of various hand-drawn charts and graphs in shades of blue, illustrating business growth, data analysis, and financial trends. The collection includes bar charts, line graphs, and pie charts, all rendered with a sketchy, artistic style. These visuals are perfect for presentations, reports, or any project requiring a dynamic and informative representation of data and progress. Performance decrease illustrations Hand-Drawn Business Growth Charts and Graphs Collection. A collage of various hand-drawn charts and graphs in shades of blue, illustrating business growth, data analysis, and financial trends. The collection includes bar charts, line graphs, and pie charts, all rendered with a sketchy, artistic style. These visuals are perfect for presentations, reports, or any project requiring a dynamic and informative representation of data and progress.
Free with trial A stark red arrow zigzags downwards, powerfully representing economic downturns, market crashes, and negative financial trends. This visual signifies a crisis or significant drop. Performance decrease illustrations Red downward arrow symbolizing financial decline and economic recession trends. A stark red arrow zigzags downwards, powerfully representing economic downturns, market crashes, and negative financial trends. This visual signifies a crisis or significant drop
Free with trial A conceptual illustration of market analysis featuring a bar chart, magnifying glass, upward and downward arrows, and business icons on white. Performance decrease illustrations Market Analysis Concept with Bar Chart Magnifying Glass and Upward Arrow graph. A conceptual illustration of market analysis featuring a bar chart, magnifying glass, upward and downward arrows, and business icons on white
Free with trial Worried man holding a red downward pointing arrow represents financial decline or business failure. Flat vector illustration isolated on white background. Performance decrease illustrations Worried man holding a red downward pointing arrow represents financial decline or business failure
Free with trial A graph with a curved line labeled "SOFT LANDING" shows a gradual decline on white. Performance decrease illustrations Graph showing a soft landing curve with text on white background chart decline. A graph with a curved line labeled "SOFT LANDING" shows a gradual decline on white
Free with trial Bar chart with six vertical blue bars of descending height, indicating a negative trend. A jagged red arrow slants downward from left to right across the bars, emphasizing the decrease. No specific location is provided. Performance decrease vectors Financial bar chart showing downward trend with red arrow. Bar chart with six vertical blue bars of descending height, indicating a negative trend. A jagged red arrow slants downward from left to right across the bars, emphasizing the decrease. No specific location is provided.
Free with trial Negative red down arrows illustration turn loss, drop slump, dip uction negative red down arrows. Performance decrease illustrations Negative red down arrows