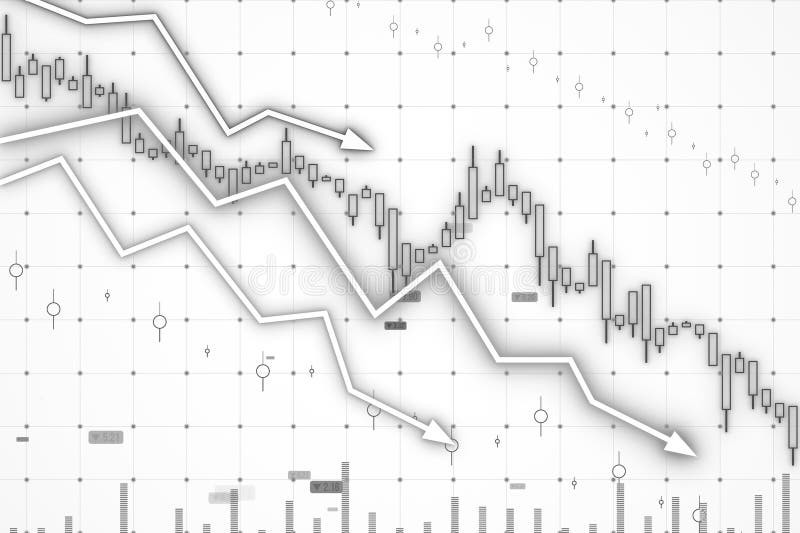
Free with trial A simple black line graph depicts a downward trend with sharp fluctuations on white. Performance decrease illustrations Black line graph showing a downward trend on a white background chart. A simple black line graph depicts a downward trend with sharp fluctuations on white
Free with trial A clean, minimalist illustration featuring a combined line graph and bar chart on a white background. The line graph, with circular data points, shows an upward trend with fluctuations. It is overlaid on a series of vertical bars, alternating in black and white, representing discrete data values. The grid lines behind the charts suggest a data analysis or financial context. This graphic is ideal for presentations, reports, and websites related to statistics, business growth, market trends, and data visualization. Performance decrease vectors Line and Bar Chart Combination. A clean, minimalist illustration featuring a combined line graph and bar chart on a white background. The line graph, with circular data points, shows an upward trend with fluctuations. It is overlaid on a series of vertical bars, alternating in black and white, representing discrete data values. The grid lines behind the charts suggest a data analysis or financial context. This graphic is ideal for presentations, reports, and websites related to statistics, business growth, market trends, and data visualization.
Free with trial A bold red arrow, depicted as a sharp, angular zigzag line pointing downwards and to the right, symbolizing a negative trend or decline, isolated against a stark white backdrop for clear visual emphas. Performance decrease illustrations Red downward trending arrow isolated on white background. A bold red arrow, depicted as a sharp, angular zigzag line pointing downwards and to the right, symbolizing a negative trend or decline, isolated against a stark white backdrop for clear visual emphas
Free with trial This image shows a calculator, tablet, and financial charts, all generated by AI for illustrative purposes. The blue color scheme emphasizes the data-driven nature of modern finance and business analytics. The image suggests efficiency and precision in financial planning and analysis. Performance decrease illustrations Financial Data Analysis. This image shows a calculator, tablet, and financial charts, all generated by AI for illustrative purposes. The blue color scheme emphasizes the data-driven nature of modern finance and business analytics. The image suggests efficiency and precision in financial planning and analysis.
Free with trial Business data is visually represented in black and white through various charts and graphs illustrating growth analysis and strategic planning for financial reporting showing a clear picture of market. Performance decrease vectors Black and white business data visualization with charts and graphs showing growth and analysis for financial reporting and. Business data is visually represented in black and white through various charts and graphs illustrating growth analysis and strategic planning for financial reporting showing a clear picture of market
Free with trial Graphs set with line charts, bar charts, and scatter plots illustrating upward and downward trends with arrows and data points. Performance decrease vectors Graphs set with line charts, bar charts, and scatter plots illustrating upward and
Free with trial Decreasing graph line icon. Halftone dotted pattern. Gradient icon with grain shadow. Column chart sign. Crisis diagram symbol. Line decreasing graph icon. Various designs. Vector. Performance decrease vectors Decreasing graph line icon. Crisis chart sign. Halftone dotted pattern. Vector. Decreasing graph line icon. Halftone dotted pattern. Gradient icon with grain shadow. Column chart sign. Crisis diagram symbol. Line decreasing graph icon. Various designs. Vector
Free with trial A close-up shot shows a hand placing a wooden block with a percentage symbol and downward arrow onto others spelling COST, representing a decrease in expenses or savings. Performance decrease illustrations Hand adjusting wooden blocks spelling cost with percentage symbol implying cost reduction. A close-up shot shows a hand placing a wooden block with a percentage symbol and downward arrow onto others spelling COST, representing a decrease in expenses or savings
Free with trial 3D illustration of a red bar chart with a downward arrow, isolated on a transparent background. Symbolizes financial loss, economic crisis, revenue drop, or business decline. Ideal for presentations, finance reports, investment warnings, stock market analysis, and economic downturn visuals. Performance decrease illustrations 3D Red Downward Arrow Graph Icon Showing Financial Decline on Transparent Background. 3D illustration of a red bar chart with a downward arrow, isolated on a transparent background. Symbolizes financial loss, economic crisis, revenue drop, or business decline. Ideal for presentations, finance reports, investment warnings, stock market analysis, and economic downturn visuals.
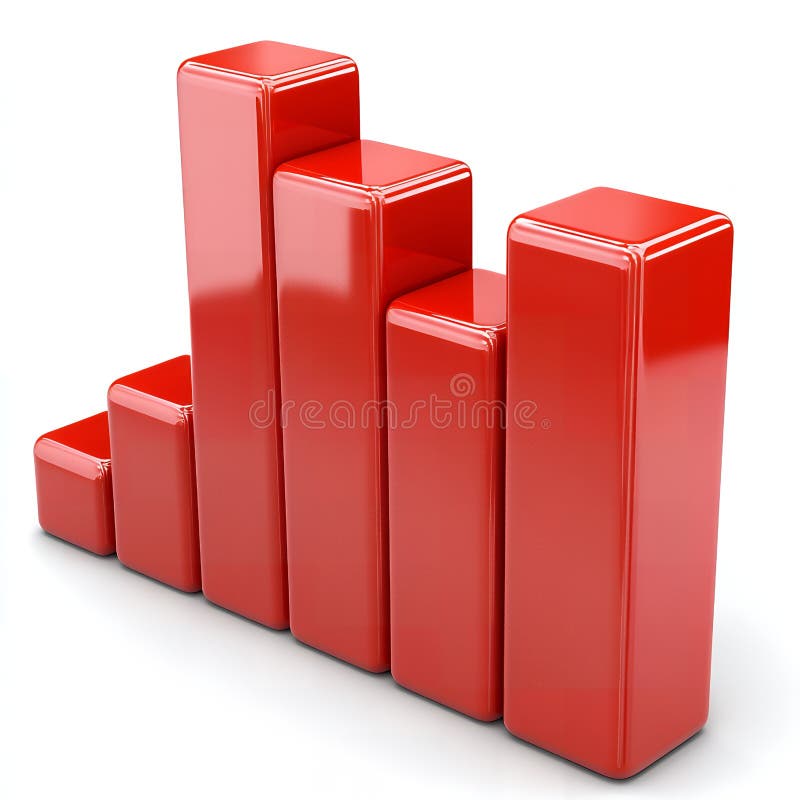
Free with trial A simple bar graph illustrating upward growth and financial success. Ideal for presentations, reports, and website use. Performance decrease vectors Upward Trending Bar Graph: Business Growth and Financial Success. A simple bar graph illustrating upward growth and financial success. Ideal for presentations, reports, and website use.
Free with trial Close-up of a financial chart showing a red line declining. The chart is on a piece of white paper and the red line is the main focus. Performance decrease illustrations Financial Chart Showing Decline. Close-up of a financial chart showing a red line declining. The chart is on a piece of white paper and the red line is the main focus
Free with trial Graph line icon. Neumorphic, Flat shadow, 3d buttons. Column chart sign. Growth diagram symbol. Line graph chart icon. Social media icons. Vector. Performance decrease vectors Graph line icon. Column chart sign. Neumorphic buttons. Vector. Graph line icon. Neumorphic, Flat shadow, 3d buttons. Column chart sign. Growth diagram symbol. Line graph chart icon. Social media icons. Vector
Free with trial A clean, minimalist 3D render depicts a series of white arrows of varying heights arranged in a graph-like formation. The tallest arrows, on the left, are illuminated with a warm, orange glow, symbolizing growth, success, and positive trends. The arrows decrease in size towards the right, suggesting a progression or trend line. The reflective surface and bright, airy background create a modern and optimistic feel, ideal for business, finance, and technology-related concepts. Performance decrease illustrations Rising Arrows Graph. A clean, minimalist 3D render depicts a series of white arrows of varying heights arranged in a graph-like formation. The tallest arrows, on the left, are illuminated with a warm, orange glow, symbolizing growth, success, and positive trends. The arrows decrease in size towards the right, suggesting a progression or trend line. The reflective surface and bright, airy background create a modern and optimistic feel, ideal for business, finance, and technology-related concepts.
Free with trial Financial data analysis tools, vibrant background Generative AI. Performance decrease illustrations Financial data analysis tools
Free with trial A business professional conducts a thorough analysis of financial data using a magnifying glass, illustrating market trends with graphs and charts on a digital interface. Scalp. Performance decrease illustrations Business Professional Analyzing Financial Data with a Magnifying Glass, Graphs, and Visual Representation of Market. A business professional conducts a thorough analysis of financial data using a magnifying glass, illustrating market trends with graphs and charts on a digital interface. Scalp
Free with trial A close-up shot of a printed financial report showing market fluctuations indicated by a red line graph. Performance decrease illustrations A financial document showing a fluctuating red line graph displayed. A close-up shot of a printed financial report showing market fluctuations indicated by a red line graph
Free with trial A diverse team of business professionals collaborating in a meeting. This vector illustration features five colleagues, men and women in corporate attire, gathered around a laptop and tablet, actively discussing a project. The scene, depicted in a clean, modern flat design style on a white background, is ideal for concepts like teamwork, data analysis, problem-solving, and strategic planning. The negative number shown can represent financial review, performance metrics, or tackling a business challenge, making it versatile for various corporate and financial themes. Performance decrease illustrations Business Team Collaboration Analyzing Negative Results Vector Illustration. A diverse team of business professionals collaborating in a meeting. This vector illustration features five colleagues, men and women in corporate attire, gathered around a laptop and tablet, actively discussing a project. The scene, depicted in a clean, modern flat design style on a white background, is ideal for concepts like teamwork, data analysis, problem-solving, and strategic planning. The negative number shown can represent financial review, performance metrics, or tackling a business challenge, making it versatile for various corporate and financial themes.
Free with trial A black graph on a white background depicts a sharp downward trend with an arrow indicating further decline. Performance decrease illustrations Black graph showing a downward trend on a white background chart decline. A black graph on a white background depicts a sharp downward trend with an arrow indicating further decline
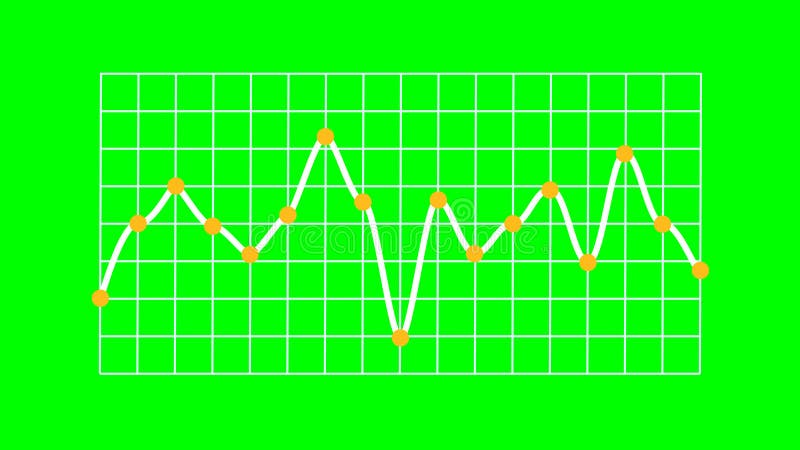
Free with trial Rendered line graph showing a single white line indicating data trends with distinct fluctuations. Yellow marker points animate vertically from the X-axis, and each plotted value features an orange circular dot. The white line runs over a structured white grid on a bright green screen background, enabling chroma keying. No axis values or units are present, emphasizing visual representation of abstract data and business trends. Performance decrease illustrations Business Trend Line Graph Showing Trading on Green Screen. Rendered line graph showing a single white line indicating data trends with distinct fluctuations. Yellow marker points animate vertically from the X-axis, and each plotted value features an orange circular dot. The white line runs over a structured white grid on a bright green screen background, enabling chroma keying. No axis values or units are present, emphasizing visual representation of abstract data and business trends.
Free with trial Hand drawing a down arrow over a decreasing bar chart on a green chalkboard. Performance decrease illustrations Hand drawing declining bar graph on blackboard. Hand drawing a down arrow over a decreasing bar chart on a green chalkboard
Free with trial This image depicts a computer screen displaying a sharply declining stock market graph, generated by AI. The red line dramatically illustrates a significant market downturn, accompanied by numerous data points and financial indicators. The dark aesthetic enhances the sense of urgency and potential. Performance decrease illustrations AI-Generated Stock Market Decline. This image depicts a computer screen displaying a sharply declining stock market graph, generated by AI. The red line dramatically illustrates a significant market downturn, accompanied by numerous data points and financial indicators. The dark aesthetic enhances the sense of urgency and potential
Free with trial This image illustrates a comparison between an increasing trend and a decreasing trend using bar graphs and arrows. Performance decrease illustrations Comparison of increasing and decreasing trends. This image illustrates a comparison between an increasing trend and a decreasing trend using bar graphs and arrows
Free with trial Hand presents a declining bar graph illustrating cost reduction, creating a compelling business visual Perfect for presentations and financial analysis. Performance decrease illustrations Presenting Cost Reduction with Graph and Hand. Hand presents a declining bar graph illustrating cost reduction, creating a compelling business visual Perfect for presentations and financial analysis
Free with trial This 3D rendered image shows a computer screen displaying various charts and graphs, including bar charts, pie charts, and line graphs. The data visualization is colorful and easy to understand, generated by AI for quick data interpretation. The design is simple and modern, ideal for presentations. Performance decrease illustrations AI-Generated Data Dashboard. This 3D rendered image shows a computer screen displaying various charts and graphs, including bar charts, pie charts, and line graphs. The data visualization is colorful and easy to understand, generated by AI for quick data interpretation. The design is simple and modern, ideal for presentations
Free with trial Modern, minimalistic chart icon for business and finance. Performance decrease illustrations Modern, minimalistic chart icon for business and finance
Free with trial Graph line icon. Continuous line with share plane. Column chart sign. Growth diagram symbol. 3d heart in speech bubble. Graph chart single line ribbon. Loop curve pattern. Vector. Performance decrease vectors Graph line icon. Column chart sign. Continuous line with plane. Vector. Graph line icon. Continuous line with share plane. Column chart sign. Growth diagram symbol. 3d heart in speech bubble. Graph chart single line ribbon. Loop curve pattern. Vector
Free with trial This image represents a financial crisis with a downward trend and a broken surface. Performance decrease illustrations Economic downturn concept with a red graph and a blue arrow pointing down. This image represents a financial crisis with a downward trend and a broken surface
Free with trial A stack of coins rests on a financial chart showing a downward trend. This image, generated by AI, visually represents economic fluctuations and market instability. The dark coins emphasize the seriousness of the financial situation depicted by the graph. Performance decrease illustrations Financial Market Trends. A stack of coins rests on a financial chart showing a downward trend. This image, generated by AI, visually represents economic fluctuations and market instability. The dark coins emphasize the seriousness of the financial situation depicted by the graph.
Free with trial A minimalist, black and white vector icon representing a bar chart or graph. The icon features a series of vertical bars of varying heights, set against a base of horizontal lines. This clean and modern design is ideal for representing data, statistics, progress, growth, or financial information in digital and print media. Its simple aesthetic makes it versatile for use in presentations, websites, apps, and infographics. Performance decrease vectors Abstract Bar Chart Icon. A minimalist, black and white vector icon representing a bar chart or graph. The icon features a series of vertical bars of varying heights, set against a base of horizontal lines. This clean and modern design is ideal for representing data, statistics, progress, growth, or financial information in digital and print media. Its simple aesthetic makes it versatile for use in presentations, websites, apps, and infographics.
Free with trial A robotic hand interacts with a digital display showcasing a declining cost graph, symbolizing advancements in finance and technology in a modern business setting. Synapse. Performance decrease illustrations Futuristic Robot Hand Pointing Towards Digital Cost Decrease Graph Over Dark Business Environment with City Lights in. A robotic hand interacts with a digital display showcasing a declining cost graph, symbolizing advancements in finance and technology in a modern business setting. Synapse
Free with trial A cartoon illustration of a man interacting with a bar chart. The man is depicted in a simple, clean style, wearing a blue shirt and brown pants. He is holding a green bar, seemingly adjusting or interacting with the colorful bars displayed on a table. The illustration is suitable for conveying concepts related to data analysis, business, finance, and presentation. Performance decrease illustrations Cartoon Man and Bar Chart. A cartoon illustration of a man interacting with a bar chart. The man is depicted in a simple, clean style, wearing a blue shirt and brown pants. He is holding a green bar, seemingly adjusting or interacting with the colorful bars displayed on a table. The illustration is suitable for conveying concepts related to data analysis, business, finance, and presentation.
Free with trial Business decline and economic recession concept with a falling bar graph and a downward red arrow. Performance decrease vectors Business decline and economic recession concept with a falling bar graph and a downward red arrow
Free with trial Blue graphs and charts depicting financial analysis and market trends with fountain pen. Performance decrease illustrations Blue graphs and charts depicting financial analysis and market trends with
Free with trial Business decline icon vector with downward arrow. Loss, failure, or economic crisis symbol with long shadow. Performance decrease vectors Business decline icon with downward arrow. Loss, failure, or economic crisis symbol with long shadow
Free with trial Unemployment rate gauge shows the current economic climate with a red needle pointing towards a high rate indicating potential financial instability market downturn and job insecurity reflecting conc. Performance decrease illustrations Unemployment rate gauge showing economic conditions with a red indicator needle pointing up. Unemployment rate gauge shows the current economic climate with a red needle pointing towards a high rate indicating potential financial instability market downturn and job insecurity reflecting conc
Free with trial Red bar graph with decreasing values. Generative AI. Performance decrease illustrations Red bar graph with decreasing values
Free with trial Black filled database icon with minus symbol representing subtraction, reduction, or removal. Performance decrease vectors Database Remove Minus Icon. Black filled database icon with minus symbol representing subtraction, reduction, or removal.
Free with trial A person's hands gently cradle a vibrant, dynamic data visualization generated by AI. The image showcases interconnected nodes and lines, forming a complex yet aesthetically pleasing network. This represents the power of AI in data analysis and presentation. Performance decrease illustrations AI-Generated Data Visualization. A person's hands gently cradle a vibrant, dynamic data visualization generated by AI. The image showcases interconnected nodes and lines, forming a complex yet aesthetically pleasing network. This represents the power of AI in data analysis and presentation.
Free with trial Downward trend bar chart with red arrow icon. Financial loss, decline, or economic crisis symbol vector. Performance decrease vectors Downward trend bar chart with red arrow icon. Financial loss, decline, or economic crisis symbol
Free with trial Up and down graph icon on black circle. Outline bar chart with uptrend and downtrend arrow symbol vector. Performance decrease vectors Up and down graph icon on black circle. Outline bar chart with uptrend and downtrend arrow symbol
Free with trial 3D icon representing business decline, downturn, and financial loss. Performance decrease illustrations 3D business growth down concept icon. 3D icon representing business decline, downturn, and financial loss
Free with trial Data visualization with red and green chart on a wall display ,Generative ai. Performance decrease illustrations Dynamic data visualization, red and green chart analysis on wall display. Data visualization with red and green chart on a wall display ,Generative ai
Free with trial Line Graph Trend Analysis Line And Solid Icon Set. Data Visualization, Business Growth, Statistical Analysis Symbol Collection. Financial And Market Insights. Isolated Vector Illustration. Performance decrease vectors Line Graph Trend Analysis Line And Solid Icon Set. Data Visualization, Business Growth, Statistical Analysis Symbol
Free with trial This image showcases a dynamic graph, generated by AI, illustrating fluctuating data patterns. The abstract, wave-like design creates a visually engaging representation of complex information, perfect for presentations or reports needing a modern aesthetic. Its cool blue tones evoke a sense of calm. Performance decrease illustrations Abstract Data Visualization. This image showcases a dynamic graph, generated by AI, illustrating fluctuating data patterns. The abstract, wave-like design creates a visually engaging representation of complex information, perfect for presentations or reports needing a modern aesthetic. Its cool blue tones evoke a sense of calm
Free with trial An upward trending bar graph displayed on a laptop screen, illuminated against a backdrop of blurred city lights at night. Shows financial success and progress. Performance decrease illustrations Financial Growth Chart on Laptop Screen at Night. An upward trending bar graph displayed on a laptop screen, illuminated against a backdrop of blurred city lights at night. Shows financial success and progress.
Free with trial Analyze Data with Colorful Graph and Notes for Business Planning Strategy , layered depth. Performance decrease illustrations Analyze Data with Colorful Graph and Notes for Business Planning Strategy
Free with trial A graph showing a downward trend on a grid background. 3D Rendering. Performance decrease illustrations Declining stock market trend illustration. 3D Rendering. A graph showing a downward trend on a grid background. 3D Rendering
Free with trial Chart icon with descending bar graph, gear with cross, and downward arrow with dollar symbol, minimal black silhouette for finance loss and cost reduction concept. Performance decrease vectors Chart icon with descending bar graph, gear with cross, and downward arrow with dollar symbol
Free with trial Pastel-colored bar graph with downward trending arrow illustrates financial decline or loss This image is suitable for business presentations or economic reports. Performance decrease illustrations Declining Bar Graph with Arrow Showing Downtrend, Financial Loss Concept. Pastel-colored bar graph with downward trending arrow illustrates financial decline or loss This image is suitable for business presentations or economic reports
Free with trial A businessman in a suit is interacting with a digital interface, highlighting the balance between increasing quality and decreasing costs. The interface shows 'Quality' with an upward arrow and 'Cost' with a downward arrow, both marked with checkmarks, symbolizing successful optimization. This image represents business strategy, efficiency, and the importance of finding the right balance for success. Performance decrease illustrations Quality vs. Cost Optimization. A businessman in a suit is interacting with a digital interface, highlighting the balance between increasing quality and decreasing costs. The interface shows 'Quality' with an upward arrow and 'Cost' with a downward arrow, both marked with checkmarks, symbolizing successful optimization. This image represents business strategy, efficiency, and the importance of finding the right balance for success.
Free with trial A modern, clean isometric illustration showcasing various data visualizations. Multiple charts and graphs, including bar charts, line graphs, and pie charts, are displayed on floating screens, representing data analysis, business intelligence, or financial reporting. Ideal for presentations, reports, or website banners related to data-driven concepts. Performance decrease illustrations Isometric 3D Data Visualization: Charts and Graphs on Floating Screens. A modern, clean isometric illustration showcasing various data visualizations. Multiple charts and graphs, including bar charts, line graphs, and pie charts, are displayed on floating screens, representing data analysis, business intelligence, or financial reporting. Ideal for presentations, reports, or website banners related to data-driven concepts.
Free with trial A vibrant red arrow points downwards, symbolizing a significant drop in stock prices, economic recession, or negative financial trends. This image captures the essence of decline and loss. Performance decrease illustrations Red downward arrow signifying financial decline and economic downturn symbol white background. A vibrant red arrow points downwards, symbolizing a significant drop in stock prices, economic recession, or negative financial trends. This image captures the essence of decline and loss
Free with trial This hand-drawn bar chart, generated by AI, visually represents growth over time. The chart shows an initial decline followed by a significant upward trend, highlighting potential recovery or resurgence after a setback. The artistic style adds a unique touch. Performance decrease illustrations AI-Generated Growth Chart. This hand-drawn bar chart, generated by AI, visually represents growth over time. The chart shows an initial decline followed by a significant upward trend, highlighting potential recovery or resurgence after a setback. The artistic style adds a unique touch.
Free with trial Neon graph shows falling trend with pink arrow pointing down. Blue bars indicate decline on, dark textured background. Modern abstract finance concept. Performance decrease illustrations Neon graph shows falling trend with pink arrow pointing down. Blue bars indicate decline on dark textured background. Modern. Neon graph shows falling trend with pink arrow pointing down. Blue bars indicate decline on, dark textured background. Modern abstract finance concept.
Free with trial A financial chart showing declining index lines in blue shades on a grid-style white background. Concept of market analysis and trends. 3D Rendering. Performance decrease illustrations Financial chart with declining index lines on grid background. 3D Rendering. A financial chart showing declining index lines in blue shades on a grid-style white background. Concept of market analysis and trends. 3D Rendering
Free with trial Graph phone line icon. Neumorphic, Flat shadow, 3d buttons. Column chart sign. Growth diagram symbol. Line graph phone icon. Social media icons. Vector. Performance decrease vectors Graph phone line icon. Column chart sign. Neumorphic buttons. Vector. Graph phone line icon. Neumorphic, Flat shadow, 3d buttons. Column chart sign. Growth diagram symbol. Line graph phone icon. Social media icons. Vector
Free with trial A businessman in a suit is pointing at a digital screen displaying a graph. The graph illustrates the concept of quality improvement and cost reduction. An upward-pointing arrow signifies the increas. Performance decrease illustrations Businessman pointing at a graph showing quality improvement and cost reduction on a digital screen. A businessman in a suit is pointing at a digital screen displaying a graph. The graph illustrates the concept of quality improvement and cost reduction. An upward-pointing arrow signifies the increas
Free with trial Graph bars shrink steadily from left side toward right.. Bold arrow points down, emphasizing drop.. Monochrome tones highlight sharp decline. Performance decrease vectors Downward trend bar chart with declining arrow illustration. Graph bars shrink steadily from left side toward right.. Bold arrow points down, emphasizing drop.. Monochrome tones highlight sharp decline
Free with trial A visual representation of a steep financial downturn with a red line graph descending sharply, magnified to show a 15% decrease, symbolizing economic decline and losses. Performance decrease illustrations Stock market crash downturn economic recession loss financial crisis downtrend chart magnifying glass zoom 15 percent. A visual representation of a steep financial downturn with a red line graph descending sharply, magnified to show a 15% decrease, symbolizing economic decline and losses
Free with trial A stark black background with a white grid displays a sharp descending line graph, symbolizing a significant financial downturn. Performance decrease illustrations Sharp downward trend on a dark financial graph indicating market decline and economic recession. A stark black background with a white grid displays a sharp descending line graph, symbolizing a significant financial downturn
Free with trial Colorful bar chart on a red background displaying data ,Generative ai. Performance decrease illustrations Vibrant colorful bar chart on red background, data visualization and analysis colorful. Colorful bar chart on a red background displaying data ,Generative ai
Free with trial A simple bar chart with alternating blue and green bars illustrates a clear downward trend over time. Performance decrease illustrations Bar chart showing declining trend. A simple bar chart with alternating blue and green bars illustrates a clear downward trend over time
Free with trial A visual representation of economic downturn and falling interest rates, with stacks of coins decreasing in height and a downward trending arrow indicating a decline in financial value and market performance. Performance decrease illustrations Decreasing interest rates and economic recession represented by stacked coins and a downward arrow with percentage symbols. A visual representation of economic downturn and falling interest rates, with stacks of coins decreasing in height and a downward trending arrow indicating a decline in financial value and market performance
Free with trial This minimalist graphic illustration features a bold red line chart indicating a significant decline. The visual composition uses a clean white background to emphasize the downward trajectory of the data points. The aesthetic is professional and modern, suitable for business presentations or financial reports. Performance decrease vectors A red line graph showing a downward trend on a white background. This minimalist graphic illustration features a bold red line chart indicating a significant. This minimalist graphic illustration features a bold red line chart indicating a significant decline. The visual composition uses a clean white background to emphasize the downward trajectory of the data points. The aesthetic is professional and modern, suitable for business presentations or financial reports
Free with trial A simple flat icon vector illustration of two hands adjusting a simple chart with a downturn arrow, symbolizing risk mitigation in a business setting. The simple chart with a downturn arrow is orange with dark gray elements, indicating loss control. White background. Minimalist style with sharp edges and no shadows. Orange and Gray color palette. Vector graphics with rounded corners. High. Performance decrease illustrations Business Downturn Graph Two Hands Hold Downward Trend Chart. A simple flat icon vector illustration of two hands adjusting a simple chart with a downturn arrow, symbolizing risk mitigation in a business setting. The simple chart with a downturn arrow is orange with dark gray elements, indicating loss control. White background. Minimalist style with sharp edges and no shadows. Orange and Gray color palette. Vector graphics with rounded corners. High
Free with trial Illustration shows a man with a red downward arrow symbolizing decline or loss, set against a blue background, conveying concern and reflection. Generative AI. Performance decrease vectors Man Standing with Red Downward Arrow Representing Decline or Loss Vector Illustration. Illustration shows a man with a red downward arrow symbolizing decline or loss, set against a blue background, conveying concern and reflection. Generative AI
Free with trial Oil barrel resting on a reflective surface, accompanied by an increasing graph in the background, illustrating the ongoing crisis in the stock market and its impact on prices. Performance decrease illustrations Oil barrel price increasing showing stock market graph showing crisis. Oil barrel resting on a reflective surface, accompanied by an increasing graph in the background, illustrating the ongoing crisis in the stock market and its impact on prices
Free with trial Arrows up and down with human pictogram figures showing business growth versus decline, career promotion concept, minimal paper cut icons on yellow background. Performance decrease illustrations Arrows up and down with human pictogram figures showing business growth versus decline
Free with trial A pile of Bitcoin coins with red downward arrows and a declining stock chart in the background, symbolizing a decrease in cryptocurrency value. Performance decrease illustrations Bitcoin Value Decline with Red Arrows and Stock Chart. A pile of Bitcoin coins with red downward arrows and a declining stock chart in the background, symbolizing a decrease in cryptocurrency value.
Free with trial Business people are riding the roller coaster of a falling stock market. Symbolizes the risk or recession of decline, falling investment and economic crisis. Planning to finish work concept. Performance decrease vectors Planning to Finish Work Concept. Business people Riding on Falling Down Stock market Roller Coaster. Business people are riding the roller coaster of a falling stock market.Symbolizes the risk or recession of decline, falling investment and economic crisis. Planning to finish work concept
Free with trial A 3D graph chart on a plain white background, representing data visualization and statistics. Performance decrease illustrations 3D Graph Chart on White Background. A 3D graph chart on a plain white background, representing data visualization and statistics
Free with trial A digital illustration of a centered document with the word 'Results' clearly written on it, set against a solid dark blue background, where numerous colorful percentage symbols of varying sizes float chaotically around the document, creating a dynamic and cluttered visual effect that conveys confusion, data overload, and the complexity of interpreting statistical outcomes in a modern analytical. Performance decrease illustrations Document with results text surrounded by colorful percentage symbols on dark background. A digital illustration of a centered document with the word 'Results' clearly written on it, set against a solid dark blue background, where numerous colorful percentage symbols of varying sizes float chaotically around the document, creating a dynamic and cluttered visual effect that conveys confusion, data overload, and the complexity of interpreting statistical outcomes in a modern analytical
Free with trial A flat design illustration of a bar chart with bars decreasing in height, accompanied by a red arrow pointing downwards, symbolizing a negative trend or financial loss. Performance decrease illustrations Bar chart showing a downward trend. A flat design illustration of a bar chart with bars decreasing in height, accompanied by a red arrow pointing downwards, symbolizing a negative trend or financial loss
Free with trial Red arrow points downward on dark background. Represents decline loss or negative trend. Shows falling stock market economy or business results. Useful for financial, reports analytics. Performance decrease illustrations Red arrow points downward on dark background. Represents decline loss or negative trend. Shows falling stock market economy or
Free with trial A visual representation of business growth and financial data with 3D charts. This image effectively conveys concepts of analytics, progress, and reporting in a modern and engaging way. Performance decrease illustrations 3d bar chart and pie chart representing financial data and growth on a blueprint isolated on white background. A visual representation of business growth and financial data with 3D charts. This image effectively conveys concepts of analytics, progress, and reporting in a modern and engaging way
Free with trial A stylized, abstract arrow graphic descends diagonally from the upper left to the lower right. The arrow is composed of three distinct, curved layers in vibrant colors: teal, orange, and a lighter shade of orange. The smooth, flowing lines suggest movement and direction. This graphic is ideal for representing concepts like decline, progress, data trends, or simple directional indicators in various design projects. Performance decrease vectors Abstract Downward Arrow with Layers. A stylized, abstract arrow graphic descends diagonally from the upper left to the lower right. The arrow is composed of three distinct, curved layers in vibrant colors: teal, orange, and a lighter shade of orange. The smooth, flowing lines suggest movement and direction. This graphic is ideal for representing concepts like decline, progress, data trends, or simple directional indicators in various design projects.
Free with trial A minimalistic 3D bar chart with descending glossy columns in blue and green is displayed on a white background. This image represents decline, analysis, and market trends. Performance decrease illustrations Minimalistic 3D bar chart with descending glossy columns in blue and green on a white background. A minimalistic 3D bar chart with descending glossy columns in blue and green is displayed on a white background. This image represents decline, analysis, and market trends
Free with trial Hand-drawn illustration of a bar graph with bars and a prominent arrow showcasing a downward trend. Concepts of decline, loss, or negative growth in various business and educational settings. Performance decrease vectors Hand-Drawn Decreasing Bar Graph Illustration. hand-drawn illustration of a bar graph with bars and a prominent arrow showcasing a downward trend. Concepts of decline, loss, or negative growth in various business and educational settings
Free with trial A clean, minimalist vector illustration of a bar chart featuring three distinct columns. The columns are colored in vibrant orange, teal, and yellow, representing different data points or categories. The chart is set against a white background with a dark blue axis line, making it ideal for presentations, reports, and infographics focused on data visualization, business growth, or financial analysis. Performance decrease vectors Simple Bar Chart with Three Columns. A clean, minimalist vector illustration of a bar chart featuring three distinct columns. The columns are colored in vibrant orange, teal, and yellow, representing different data points or categories. The chart is set against a white background with a dark blue axis line, making it ideal for presentations, reports, and infographics focused on data visualization, business growth, or financial analysis.