Free with trial The image displays a graph with a red line trending downward, suggesting a decrease or decline in the represented data over a period of time. The background of the graph is gray with a grid pattern, and the red line has fluctuations but overall points downwards, ending with a red arrowhead at the bottom right. Red downward arrow showing decrease illustrations A graph showing a downward trend with a red line indicating decline over time. The image displays a graph with a red line trending downward, suggesting a decrease or decline in the represented data over a period of time. The background of the graph is gray with a grid pattern, and the red line has fluctuations but overall points downwards, ending with a red arrowhead at the bottom right
Free with trial The image features two arrows, one green pointing upwards and one red pointing downwards. The green arrow on the left signifies an upward direction, often indicating increase or improvement. The red arrow on the right signifies a downward direction, typically representing decrease or decline. These arrows are commonly used in various contexts to indicate movement or status changes. Red downward arrow showing decrease illustrations Arrows showing up and down. The image features two arrows, one green pointing upwards and one red pointing downwards. The green arrow on the left signifies an upward direction, often indicating increase or improvement. The red arrow on the right signifies a downward direction, typically representing decrease or decline. These arrows are commonly used in various contexts to indicate movement or status changes
Free with trial A bar chart displayed on an easel, illustrating a negative trend. The bars, a mix of blue and grey, show a progressive decrease in value. A prominent red arrow curves downwards across the chart, signifying a decline or loss. The presentation suggests a financial report or business analysis with unfavorable results. Red downward arrow showing decrease illustrations Bar chart showing a downward trend with a red arrow indicating decline. A bar chart displayed on an easel, illustrating a negative trend. The bars, a mix of blue and grey, show a progressive decrease in value. A prominent red arrow curves downwards across the chart, signifying a decline or loss. The presentation suggests a financial report or business analysis with unfavorable results
Free with trial Red arrow declining on bar graph, business finance chart, downward trend, recession, financial data, blue background. Red downward arrow showing decrease illustrations Red arrow graph showing decline, business finance chart, downward trend, recession. Red arrow declining on bar graph, business finance chart, downward trend, recession, financial data, blue background
Free with trial Hand drawn bar chart illustration showing business decline with a downward red arrow. Red downward arrow showing decrease illustrations Hand drawn bar chart illustration showing business decline with a downward red arrow
Free with trial A Bitcoin coin with a downward trending red arrow on a graph showing a decline in value,. Red downward arrow showing decrease illustrations A Bitcoin coin with a downward trending red arrow on a graph showing a decline in value
Free with trial An image showing stacks of gold coins arranged with wooden blocks spelling 'COST' and a red arrow trending downwards, indicating a decrease in cost or expenses, symbolizing financial savings or reduced expenditure. Red downward arrow showing decrease illustrations Stacks of gold coins with a downward trend arrow and the word cost on wooden blocks. An image showing stacks of gold coins arranged with wooden blocks spelling 'COST' and a red arrow trending downwards, indicating a decrease in cost or expenses, symbolizing financial savings or reduced expenditure
Free with trial This image presents a simple visual showing a falling financial trend, using a red arrow that moves downward in a stepped motion to suggest a steady reduction over time. The arrow sits above the words financial decline, which reinforces the theme of reduced performance or weakening conditions. The pale background and central dividing line help keep the focus on the arrow and text, making the message clear without distraction. The overall layout communicates the idea of shrinking results, reduced revenue, or broader economic pressure. This type of visual is often used in reports, presentations, and articles that discuss downturns, risk, or negative outcomes in business or economic settings. The clean style makes it suitable for a wide range of professional uses where a direct and uncomplicated representation of loss or reduction is needed. The image can support topics such as market shifts, budget cuts, operational challenges, or general financial stress. It can also be used to highlight the impact of external factors that influence performance, helping viewers quickly understand the direction of change being described. Red downward arrow showing decrease illustrations Red downward arrow chart showing financial decline trend with financial decline text on pale background. This image presents a simple visual showing a falling financial trend, using a red arrow that moves downward in a stepped motion to suggest a steady reduction over time. The arrow sits above the words financial decline, which reinforces the theme of reduced performance or weakening conditions. The pale background and central dividing line help keep the focus on the arrow and text, making the message clear without distraction. The overall layout communicates the idea of shrinking results, reduced revenue, or broader economic pressure. This type of visual is often used in reports, presentations, and articles that discuss downturns, risk, or negative outcomes in business or economic settings. The clean style makes it suitable for a wide range of professional uses where a direct and uncomplicated representation of loss or reduction is needed. The image can support topics such as market shifts, budget cuts, operational challenges, or general financial stress. It can also be used to highlight the impact of external factors that influence performance, helping viewers quickly understand the direction of change being described.
Free with trial An image showing stacks of gold coins decreasing in size from left to right, each stack labeled with a percentage symbol, accompanied by a red arrow trending downward. Red downward arrow showing decrease illustrations Stacks of gold coins decreasing in size with percentage symbol and downward trend arrow. An image showing stacks of gold coins decreasing in size from left to right, each stack labeled with a percentage symbol, accompanied by a red arrow trending downward
Free with trial An image showing stacks of gold and silver coins on a reflective surface with a large gold dollar sign in the center, accompanied by a red arrow trending downwards, symbolizing a decrease in financial value or economic downturn. Red downward arrow showing decrease illustrations Stacks of coins with a dollar sign and a downward trend arrow indicating financial decline. An image showing stacks of gold and silver coins on a reflective surface with a large gold dollar sign in the center, accompanied by a red arrow trending downwards, symbolizing a decrease in financial value or economic downturn
Free with trial Cartoon bar graph on an easel with a red arrow indicating a downward trend. Clear details and vib. Red downward arrow showing decrease illustrations Cartoon Bar Graph Showing Downward Trend with Red Arrow chart bar chart. Cartoon bar graph on an easel with a red arrow indicating a downward trend. Clear details and vib
Free with trial A 3D bar graph displays a downward trend represented by a red arrow. The bars are composed of orange, green, and red cubes, illustrating fluctuating data points. The overall mood is one of decline or setback. Red downward arrow showing decrease illustrations Red Arrow Downward Trend Chart Showing Decreasing Business Growth Statistics with Green Orange. A 3D bar graph displays a downward trend represented by a red arrow. The bars are composed of orange, green, and red cubes, illustrating fluctuating data points. The overall mood is one of decline or setback
Free with trial Bar chart illustration showing a downward trend with a red arrow indicating a significant drop in values. Red downward arrow showing decrease vectors Bar chart illustration showing a downward trend with a red arrow indicating a significant drop in values
Free with trial This image features five diminishing stacks of shiny gold coins arranged in a row on a wooden surface, accompanied by a large red downward-pointing arrow on the right side, symbolizing financial loss, economic decline, or a decrease in savings and investment value. Red downward arrow showing decrease illustrations A conceptual illustration showing stacks of gold coins declining with a red downward pointing arrow. This image features five diminishing stacks of shiny gold coins arranged in a row on a wooden surface, accompanied by a large red downward-pointing arrow on the right side, symbolizing financial loss, economic decline, or a decrease in savings and investment value
Free with trial A compelling image depicting a red downward-pointing arrow dramatically positioned over a stack of financial reports visually communicating a significant market downturn or economic crisis The charts and graphs emphasize the severity of the decline Ideal for illustrating financial news or articles related to economic instability. Red downward arrow showing decrease illustrations Financial Crisis Red Downward Arrow on Stack of Financial Reports and Charts Showing Market Decline AI generated. A compelling image depicting a red downward-pointing arrow dramatically positioned over a stack of financial reports visually communicating a significant market downturn or economic crisis The charts and graphs emphasize the severity of the decline Ideal for illustrating financial news or articles related to economic instability
Free with trial 3D isometric business chart showing a downward trend with a red arrow and colorful bar graphs on a grid background, isolated on white. Red downward arrow showing decrease illustrations 3D isometric business chart showing a downward trend with a red arrow and colorful bar graphs on a grid background, isolated on
Free with trial Falling red arrow superimposed on a bar graph showing business decline negative growth insolvency financial crisis Can be used as a banner or header image. Red downward arrow showing decrease illustrations Falling red arrow superimposed on a bar graph showing business decline , negative growth, insolvency, financial crisis. Falling red arrow superimposed on a bar graph showing business decline negative growth insolvency financial crisis Can be used as a banner or header image
Free with trial The image depicts a red arrow graph with a blue glow, indicating a downward trend. it is set against a dark gray, textured wall illuminated by a spotlight from above, creating a dramatic effect. the arrow starts high on the left and descends sharply towards the bottom right, suggesting a significant decline in performance, such as in business or finance. the floor is a smooth, dark surface that reflects the light, adding depth to the scene. Red downward arrow showing decrease illustrations Red arrow graph showing downward trend. the image depicts a red arrow graph with a blue glow, indicating a downward trend. it is set against a dark gray, textured wall illuminated by a spotlight from above, creating a dramatic effect. the arrow starts high on the left and descends sharply towards the bottom right, suggesting a significant decline in performance, such as in business or finance. the floor is a smooth, dark surface that reflects the light, adding depth to the scene.
Free with trial Red arrow pointing down and coins showing stock market crash, investment loss, and financial crisis. Red downward arrow showing decrease illustrations Stock market crash showing a red downward arrow and gold coins. Red arrow pointing down and coins showing stock market crash, investment loss, and financial crisis
Free with trial A stark vector illustration of a bar chart showing a sharp decrease, indicated by a downward-pointing red arrow. This icon effectively represents economic downturns, financial losses, declining trends, or negative performance metrics. Ideal for business reports, financial analysis, or news graphics, vector design Generative AI. Red downward arrow showing decrease vectors . A stark vector illustration of a bar chart showing a sharp decrease, indicated by a downward-pointing red arrow. This icon effectively represents economic downturns, financial losses, declining trends, or negative performance metrics. Ideal for business reports, financial analysis, or news graphics, vector design Generative AI
Free with trial A downward red arrow piercing through stacks of golden coins, suggesting financial loss and recession with a warm, dramatic light, making it ideal for finance and investment related visuals. Red downward arrow showing decrease illustrations Falling Red Arrow Over Golden Coins Showing Economic Downturn. A downward red arrow piercing through stacks of golden coins, suggesting financial loss and recession with a warm, dramatic light, making it ideal for finance and investment related visuals
Free with trial Downward Trend Bar Chart Showing Losses with a Declining Red Arrow. Red downward arrow showing decrease vectors Downward Trend Bar Chart Showing Losses with a Declining Red Arrow
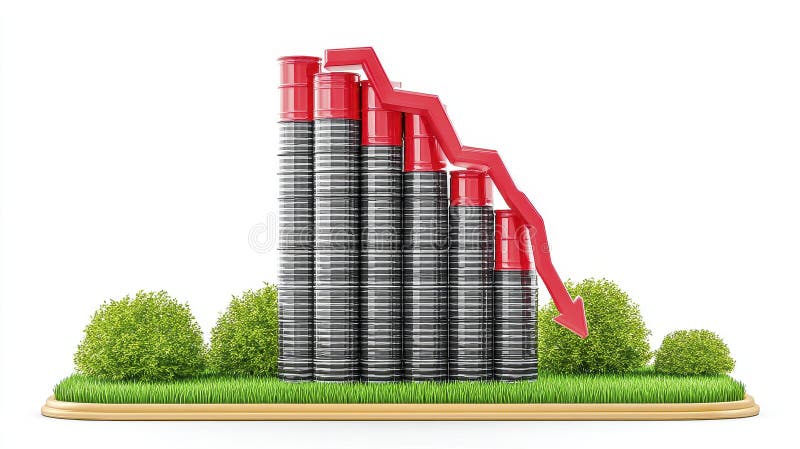
Free with trial 3D rendering of a bar graph showing a decline in production, represented by black and red cylinders on a grassy surface. The downward trend is emphasized by a red arrow AI generative. Red downward arrow showing decrease illustrations Declining Production 3D Render of Bar Graph Showing a Downward Trend. 3D rendering of a bar graph showing a decline in production, represented by black and red cylinders on a grassy surface. The downward trend is emphasized by a red arrow AI generative
Free with trial Stack of gold coins accompanied by a bold red downward arrow demonstrates a negative economic trend against a dark background, ideal for illustrating financial crisis, market decline, or investment risks. Red downward arrow showing decrease illustrations Gold Coins with Red Arrow Showing Economic Downturn on Dark Background. Stack of gold coins accompanied by a bold red downward arrow demonstrates a negative economic trend against a dark background, ideal for illustrating financial crisis, market decline, or investment risks
Free with trial Vector illustration showing financial decrease or money loss. Includes yellow coin stacks and a red downward arrow. Business and economy concept, isolated on white background. Red downward arrow showing decrease vectors Financial loss illustration with red downward arrow and stack of coins. Vector illustration showing financial decrease or money loss. Includes yellow coin stacks and a red downward arrow. Business and economy concept, isolated on white background.
Free with trial Red arrow showing downward trend over supermarket shelves with scarce product. Economic crisis and inflation impact on food supply or demand. Red downward arrow showing decrease illustrations Red arrow showing downward trend over supermarket shelves with scarce product
Free with trial A vector icon of a line graph showing a downward trend with a red arrow. Represents decline, loss, negative performance, or decreasing statistics. Useful for financial reports, business analytics, or illustrating unfavorable trends. Clear visual for decrease, vector design Generative AI. Red downward arrow showing decrease vectors Downward Trend Line Graph Vector Icon for Decline Loss, vector design Generative AI. A vector icon of a line graph showing a downward trend with a red arrow. Represents decline, loss, negative performance, or decreasing statistics. Useful for financial reports, business analytics, or illustrating unfavorable trends. Clear visual for decrease, vector design Generative AI
Free with trial Steep downward trending red line graph with an arrow on a whiteboard mounted on an easel. Red downward arrow showing decrease illustrations Whiteboard showing a steep downward trending red line graph on an easel chart data. Steep downward trending red line graph with an arrow on a whiteboard mounted on an easel
Free with trial Generative ai, The image is a red stock market graph showing a sharp decline, with a large, red arrow pointing down. The graph is set against a background of a grid pattern of red squares. The image suggests a negative economic trend. Red downward arrow showing decrease illustrations The image is a red stock chart showing a downward trend. The red arrow is pointing down, indicating that the stock market is in a. generative ai, The image is a red stock market graph showing a sharp decline, with a large, red arrow pointing down. The graph is set against a background of a grid pattern of red squares. The image suggests a negative economic trend
Free with trial Falling red arrow superimposed on a bar graph showing business decline trading losses financial ruin Can be used as a banner or header image. Red downward arrow showing decrease illustrations Falling red arrow superimposed on a bar graph showing business decline , trading losses, financial ruin. Falling red arrow superimposed on a bar graph showing business decline trading losses financial ruin Can be used as a banner or header image
Free with trial 3d Red arrow showing downward trend in stock market. Financial crisis concept with broken coins, investment risk, and money loss. Vector illustration. Red downward arrow showing decrease vectors 3d Red arrow downward trend in stock market. 3d Red arrow showing downward trend in stock market. Financial crisis concept with broken coins, investment risk, and money loss. Vector illustration
Free with trial This striking graphic illustrates a significant economic downturn or market crash with a bold red arrow plunging downwards. Rendered by Ai, the image uses simple colors to maximize impact setting the alarming decline against subtle background charts. It effectively communicates concepts of loss decrease and a strong negative trend in business metrics. Red downward arrow showing decrease illustrations Red arrow showing sharp financial market decline. This striking graphic illustrates a significant economic downturn or market crash with a bold red arrow plunging downwards. Rendered by Ai, the image uses simple colors to maximize impact setting the alarming decline against subtle background charts. It effectively communicates concepts of loss decrease and a strong negative trend in business metrics
Free with trial A drawn graphic showing the Indian currency INR symbol dropping alongside a downward red arrow, indicating recession and financial loss, isolated on an Alpha transparent background. Red downward arrow showing decrease vectors Indian Rupee depreciation red arrow down stylized sketch Alpha transparent. A drawn graphic showing the Indian currency INR symbol dropping alongside a downward red arrow, indicating recession and financial loss, isolated on an Alpha transparent background.
Free with trial Bankruptcy showing red 3d percentage symbol with downward arrow indicating decrease. Red downward arrow showing decrease illustrations Red 3D Percentage Symbol with Downward Arrow Indicating Decrease
Free with trial A 3D bar chart rendered in a vibrant pink color illustrates a significant downward trend. The bars decrease in height from left to right, culminating in a very short bar. A bold pink arrow, also in 3D, starts high on the left and sharply descends to the right, mirroring the decline shown by the bars. The entire graphic is isolated on a clean white background. Red downward arrow showing decrease illustrations Pink 3D Bar Chart Showing a Downward Trend with an Arrow graph decline. A 3D bar chart rendered in a vibrant pink color illustrates a significant downward trend. The bars decrease in height from left to right, culminating in a very short bar. A bold pink arrow, also in 3D, starts high on the left and sharply descends to the right, mirroring the decline shown by the bars. The entire graphic is isolated on a clean white background
Free with trial Light showing neon orange downward trend arrow with arrowhead on dark reflective surface. Red downward arrow showing decrease illustrations Neon Orange Downward Trend Arrow with Arrowhead on Dark Reflective Surface
Free with trial A detailed financial chart showing a downward trend in stock prices, represented by red candlesticks and a downward arrow. Red downward arrow showing decrease illustrations Downward stock market trend with red candlesticks. A detailed financial chart showing a downward trend in stock prices, represented by red candlesticks and a downward arrow
Free with trial A 3D rendering of a bar chart featuring three colorful columns: blue, orange, and green, increasing in height from left to right. Two prominent red downward arrows are positioned above the tallest green bar, clearly indicating a decline, decrease, or negative trend. The minimalist design on a clean white background makes it ideal for illustrating business performance, financial reports, economic downturns, sales drops, or any data visualization requiring a clear representation of a negative change or warning. Perfect for presentations, infographics, and analytical content. Red downward arrow showing decrease vectors 3D Bar Chart with Red Downward Arrows Showing Decline. A 3D rendering of a bar chart featuring three colorful columns: blue, orange, and green, increasing in height from left to right. Two prominent red downward arrows are positioned above the tallest green bar, clearly indicating a decline, decrease, or negative trend. The minimalist design on a clean white background makes it ideal for illustrating business performance, financial reports, economic downturns, sales drops, or any data visualization requiring a clear representation of a negative change or warning. Perfect for presentations, infographics, and analytical content.
Free with trial A simple line graph icon showing a downward trend with two arrows and the words "DECREASE DECLINE. Red downward arrow showing decrease illustrations Downward Trend Graph Icon with Decrease Decline Text chart. A simple line graph icon showing a downward trend with two arrows and the words "DECREASE DECLINE
Free with trial A red and yellow financial chart depicts a steep downward trend. Red candlestick bars form the base, with yellow lines showing price fluctuations. A large yellow arrow clearly indicates a sharp decline, suggesting a significant market drop. Red downward arrow showing decrease illustrations Red and Yellow Stock Market Chart with Steep Downward Trend. A red and yellow financial chart depicts a steep downward trend. Red candlestick bars form the base, with yellow lines showing price fluctuations. A large yellow arrow clearly indicates a sharp decline, suggesting a significant market drop
Free with trial A vibrant red arrow graph sharply declining against a dark, textured background, symbolizing a significant financial downturn or economic crisis. Red downward arrow showing decrease illustrations Red downward arrow graph on dark background showing financial crisis. A vibrant red arrow graph sharply declining against a dark, textured background, symbolizing a significant financial downturn or economic crisis
Free with trial A 3D rendered bar chart with bars in red, yellow, green, and blue, arranged in descending order of height. A thick black arrow curves downwards from the top left, crossing over the bars and pointing towards the bottom right, indicating a downward trend or decline. The image is set against a clean, white background. Red downward arrow showing decrease illustrations Colorful Bar Chart Showing Downward Trend with Black Arrow on White Background graph. A 3D rendered bar chart with bars in red, yellow, green, and blue, arranged in descending order of height. A thick black arrow curves downwards from the top left, crossing over the bars and pointing towards the bottom right, indicating a downward trend or decline. The image is set against a clean, white background
Free with trial A stark red arrow graphically depicts a significant downward trend on a white chart, symbolizing financial loss or market crash. Red downward arrow showing decrease illustrations Red arrow graph showing sharp financial decline. A stark red arrow graphically depicts a significant downward trend on a white chart, symbolizing financial loss or market crash
Free with trial A colorful bar chart illustrates a downward trend, with a prominent red arrow indicating a significant decrease in data. Red downward arrow showing decrease illustrations Bar chart showing declining trend with red arrow. A colorful bar chart illustrates a downward trend, with a prominent red arrow indicating a significant decrease in data
Free with trial A simple line graph showing a downward trend with an arrow pointing down on a white background. Red downward arrow showing decrease illustrations Downward trending line graph with arrow indicating decline business finance. A simple line graph showing a downward trend with an arrow pointing down on a white background
Free with trial A 3D render of a white bar chart with a red arrow graph descending across it. The background is a white grid. The chart is isolated on a white surface with reflections. Red downward arrow showing decrease illustrations Red arrow graph chart showing downward trend on white grid background bar chart financial. A 3D render of a white bar chart with a red arrow graph descending across it. The background is a white grid. The chart is isolated on a white surface with reflections
Free with trial A black icon showing a bar graph with a downward trending arrow indicating a decline. Red downward arrow showing decrease illustrations Black bar graph with downward trending arrow icon on white background chart decline. A black icon showing a bar graph with a downward trending arrow indicating a decline
Free with trial A simple red line graph showing a sharp downward trend with an arrow indicating a significant decrease, symbolizing loss or decline in performance. Red downward arrow showing decrease illustrations Red downward trending graph isolated on white background. A simple red line graph showing a sharp downward trend with an arrow indicating a significant decrease, symbolizing loss or decline in performance
Free with trial This vibrant illustration showcases a bold red arched arrow descending sharply against a clean white textured background. The drawing style mimics a crayon or colored pencil sketch giving it a playful and attention-grabbing aesthetic. Rendered by Ai, this graphic element is perfect for indicating trends direction or highlighting specific information on marketing materials or websites. It. Red downward arrow showing decrease illustrations Vibrant red crayon arrow showing downward motion. This vibrant illustration showcases a bold red arched arrow descending sharply against a clean white textured background. The drawing style mimics a crayon or colored pencil sketch giving it a playful and attention-grabbing aesthetic. Rendered by Ai, this graphic element is perfect for indicating trends direction or highlighting specific information on marketing materials or websites. It
Free with trial A businessman gestures towards a downward-trending red arrow on a graph, illustrating concepts of financial decline, market downturn, economic recession, investment loss, and business failure. The image is clean, using a white background, and ideal for presentations or articles related to financial crisis and negative trends, generated by AI. Red downward arrow showing decrease illustrations Businessman showing decreasing red graph arrow down. A businessman gestures towards a downward-trending red arrow on a graph, illustrating concepts of financial decline, market downturn, economic recession, investment loss, and business failure. The image is clean, using a white background, and ideal for presentations or articles related to financial crisis and negative trends, generated by AI.
Free with trial A dramatic business concept image showing a person in a business suit holding a glowing red line graph that is trending downwards with an arrow. The background is a blurred view of stock market ticker screens, clearly linking the downward trend to a financial market crash, recession, or investment loss. Generative AI. Red downward arrow showing decrease illustrations A person in a suit holding a plunging red arrow graph in front of stock market screens. A dramatic business concept image showing a person in a business suit holding a glowing red line graph that is trending downwards with an arrow. The background is a blurred view of stock market ticker screens, clearly linking the downward trend to a financial market crash, recession, or investment loss. Generative AI.
Free with trial A striking red arrow curves downwards, symbolizing a financial downturn economic recession or declining performance. This graphic conveys a clear message of loss, regression, or negative trends. Red downward arrow showing decrease illustrations Red downward arrow symbol showing decline and negative trend in business and finance. A striking red arrow curves downwards, symbolizing a financial downturn economic recession or declining performance. This graphic conveys a clear message of loss, regression, or negative trends
Free with trial The image depicts a bar chart with a downward trend. The bars, colored in blue, gradually decrease in height, indicating a decline. A large red arrow, pointing downwards, further emphasizes the downward trend. The chart is displayed on an easel, suggesting a presentation or analysis context. Red downward arrow showing decrease illustrations Chart showing decline. The image depicts a bar chart with a downward trend. The bars, colored in blue, gradually decrease in height, indicating a decline. A large red arrow, pointing downwards, further emphasizes the downward trend. The chart is displayed on an easel, suggesting a presentation or analysis context
Free with trial A 3D bar chart shows a downward trend with a prominent red arrow indicating a significant decrease in value. Red downward arrow showing decrease illustrations Red arrow graph showing steep decline in bar chart data. A 3D bar chart shows a downward trend with a prominent red arrow indicating a significant decrease in value
Free with trial The image depicts a bar graph with a downward trend. The graph has blue bars representing data values that decrease from left to right. A large red arrow further emphasizes the downward trend, indicating a significant decline in the data over time. The graph is displayed on an easel with wooden legs. Red downward arrow showing decrease illustrations Graph showing decline in data. The image depicts a bar graph with a downward trend. The graph has blue bars representing data values that decrease from left to right. A large red arrow further emphasizes the downward trend, indicating a significant decline in the data over time. The graph is displayed on an easel with wooden legs
Free with trial This minimalist vector illustration depicts a line chart indicating a negative performance or decline. The design features a clean blue line with circular data points connected by segments, ending in a sharp red arrow pointing downwards. The background is a soft, neutral shade, emphasizing the clear visual representation of financial loss or decreasing statistics. Red downward arrow showing decrease vectors A simple line graph showing a downward trend with a red arrow. This minimalist vector illustration depicts a line chart indicating a negative performance or decline. The design features a clean blue line with circular data points connected by segments, ending in a sharp red arrow pointing downwards. The background is a soft, neutral shade, emphasizing the clear visual representation of financial loss or decreasing statistics
Free with trial Laptop screen showing red downward stock chart and graph, on wooden desk with plant and notebook, concept of global financial crisis. 3D Rendering. Red downward arrow showing decrease illustrations Laptop displaying falling red stock market graph with downward arrow, indicating global financial crisis and economic recession. Laptop screen showing red downward stock chart and graph, on wooden desk with plant and notebook, concept of global financial crisis. 3D Rendering
Free with trial Laptop screen showing red downward stock chart and graph, on wooden desk with plant and notebook, concept of global financial crisis. 3D Rendering. Red downward arrow showing decrease illustrations Laptop displaying falling red stock market graph with downward arrow, indicating global financial crisis and economic recession. Laptop screen showing red downward stock chart and graph, on wooden desk with plant and notebook, concept of global financial crisis. 3D Rendering
Free with trial This minimalist graphic illustration features a bold red line chart indicating a significant decline. The visual composition uses a clean white background to emphasize the downward trajectory of the data points. The aesthetic is professional and modern, suitable for business presentations or financial reports. Red downward arrow showing decrease vectors A red line graph showing a downward trend on a white background. This minimalist graphic illustration features a bold red line chart indicating a significant. This minimalist graphic illustration features a bold red line chart indicating a significant decline. The visual composition uses a clean white background to emphasize the downward trajectory of the data points. The aesthetic is professional and modern, suitable for business presentations or financial reports
Free with trial Falling Graphs with Red Arrow Showing Decline, Economic Recession Concept, illustration. Red downward arrow showing decrease illustrations Falling Graphs with Red Arrow Showing Decline, Economic Recession Concept
Free with trial Stack of gold coins with a red down arrow indicates market fall or investment loss Perfect for financial and economic downturn illustrations. Red downward arrow showing decrease illustrations Declining Value Gold Coins Stack with Red Arrow Showing Decrease. Stack of gold coins with a red down arrow indicates market fall or investment loss Perfect for financial and economic downturn illustrations
Free with trial A visual representation of financial downturn, showing decreasing stacks of coins and a prominent red downward trending arrow. Red downward arrow showing decrease illustrations Financial decline illustrated by falling coin stacks and red arrow. A visual representation of financial downturn, showing decreasing stacks of coins and a prominent red downward trending arrow
Free with trial An image showing two arrows, one red pointing up with a percentage symbol and a white upward arrow inside, and one green pointing down with a percentage symbol and a white downward arrow inside, likely used to represent increase and decrease in percentages. Red downward arrow showing decrease illustrations Up and down percentage arrows for increase and decrease. An image showing two arrows, one red pointing up with a percentage symbol and a white upward arrow inside, and one green pointing down with a percentage symbol and a white downward arrow inside, likely used to represent increase and decrease in percentages
Free with trial A 3D bar chart illustrates a significant downward trend in data, emphasized by a bold red arrow pointing downwards. Red downward arrow showing decrease illustrations Bar chart showing declining trend with downward arrow. A 3D bar chart illustrates a significant downward trend in data, emphasized by a bold red arrow pointing downwards
Free with trial A whiteboard on an easel displaying a red bar graph with a downward trend, indicated by a large red arrow. Red downward arrow showing decrease illustrations A red graph on a whiteboard showing a downward trend. a whiteboard on an easel displaying a red bar graph with a downward trend, indicated by a large red arrow
Free with trial A red bar chart illustrates a significant decline with a bold red arrow pointing downwards, symbolizing financial loss, market downturn, or negative growth. Red downward arrow showing decrease illustrations Red bar chart showing downward trend and falling arrow. A red bar chart illustrates a significant decline with a bold red arrow pointing downwards, symbolizing financial loss, market downturn, or negative growth
Free with trial A 3d bar graph showing a downward trend with a red arrow indicating decline, representing business loss. Red downward arrow showing decrease vectors Bar chart with red arrow pointing down on white background. A 3d bar graph showing a downward trend with a red arrow indicating decline, representing business loss
Free with trial Red upward arrow icon with crossed downward line and bar chart showing growth and decline contrast. Red downward arrow showing decrease illustrations Red upward arrow with crossed down trend icon and bar chart. Red upward arrow icon with crossed downward line and bar chart showing growth and decline contrast
Free with trial A 3D rendered image depicts a colorful bar graph with bars in red, yellow, green, and blue. A thick black arrow curves downwards from the top left, pointing towards the right and indicating a negative trend or decline. The bars are arranged in descending order of height from left to right, further emphasizing the downward trajectory. The image is set against a clean white background, making the. Red downward arrow showing decrease illustrations Colorful Bar Graph Showing Downward Trend with Black Arrow on White Background chart. A 3D rendered image depicts a colorful bar graph with bars in red, yellow, green, and blue. A thick black arrow curves downwards from the top left, pointing towards the right and indicating a negative trend or decline. The bars are arranged in descending order of height from left to right, further emphasizing the downward trajectory. The image is set against a clean white background, making the
Free with trial The image depicts a bar chart showing a significant decline in values across five categories, accompanied by a bold downward red arrow emphasizing the sharp decrease. The bars progressively shorten from left to right, indicating a continuous drop in whatever metric is being measured. Red downward arrow showing decrease illustrations Declining trend illustrated with bar chart and downward arrow. The image depicts a bar chart showing a significant decline in values across five categories, accompanied by a bold downward red arrow emphasizing the sharp decrease. The bars progressively shorten from left to right, indicating a continuous drop in whatever metric is being measured
Free with trial A line graph displaying two lines, one red and one blue, both trending downward over time. The red line is consistently above the blue line and both show a significant decrease, with the red line ending in a sharp drop highlighted by a red arrow. Red downward arrow showing decrease illustrations Graph showing a decline in values over time with a notable drop. A line graph displaying two lines, one red and one blue, both trending downward over time. The red line is consistently above the blue line and both show a significant decrease, with the red line ending in a sharp drop highlighted by a red arrow
Free with trial Three stacks of golden coins showing a downward trend, indicated by a sharp red arrow, suggesting financial decline or loss. Red downward arrow showing decrease illustrations Gold coin stacks with descending red arrow on white background. Three stacks of golden coins showing a downward trend, indicated by a sharp red arrow, suggesting financial decline or loss
Free with trial A digital illustration features a clipboard with a financial chart showing a series of descending blue bars and a downward red arrow, indicating a negative trend. A magnifying glass, highlighting a dollar sign, is placed to the right. The background is light blue with small decorative elements in yellow and black, providing a clean and minimalistic design. Red downward arrow showing decrease vectors Financial chart showing a downward trend with a magnifying glass. A digital illustration features a clipboard with a financial chart showing a series of descending blue bars and a downward red arrow, indicating a negative trend. A magnifying glass, highlighting a dollar sign, is placed to the right. The background is light blue with small decorative elements in yellow and black, providing a clean and minimalistic design.
Free with trial A detailed close-up shot of a stock market chart display featuring multiple graphs and charts divided into sections representing different market aspects, including a red line graph labeled OTC Markets, a blue line graph showing a downward trend, another section with an upward trend marked by a red downward arrow, and additional charts on the right side displaying stock performance over time with. Red downward arrow showing decrease illustrations Close-up view of multiple stock market charts and graphs showing OTC markets performance with upward and downward trends. A detailed close-up shot of a stock market chart display featuring multiple graphs and charts divided into sections representing different market aspects, including a red line graph labeled OTC Markets, a blue line graph showing a downward trend, another section with an upward trend marked by a red downward arrow, and additional charts on the right side displaying stock performance over time with
Free with trial A simple graph with a red line trending downwards, signifying a decrease or fall in an unspecified metric, set against a dark background. Red downward arrow showing decrease illustrations Graph showing a downward trend with a red arrow indicating decline. A simple graph with a red line trending downwards, signifying a decrease or fall in an unspecified metric, set against a dark background
Free with trial A red downward trending graph on a white background, indicating a decline or decrease in value or quantity, with a red arrow pointing downwards to emphasize the trend. Red downward arrow showing decrease illustrations Downward trend graph showing decline in value or quantity over time. A red downward trending graph on a white background, indicating a decline or decrease in value or quantity, with a red arrow pointing downwards to emphasize the trend
Free with trial A 3D bar chart with white bars and red bases shows a downward trend. A thick red arrow points downwards across the grid background. Isolated on white. Red downward arrow showing decrease illustrations 3 D red arrow graph chart showing decline on white background image. A 3D bar chart with white bars and red bases shows a downward trend. A thick red arrow points downwards across the grid background. Isolated on white
Free with trial Bar chart illustrating financial decline with a red arrow pointing downwards towards a dollar symbol. Represents economic recession, loss, and market crash. Red downward arrow showing decrease illustrations Financial graph showing downward trend with red arrow and dollar sign. Bar chart illustrating financial decline with a red arrow pointing downwards towards a dollar symbol. Represents economic recession, loss, and market crash
Free with trial A blue zigzag arrow transforms into red, pointing sharply downwards. The composition uses flat style and presents visual of business decline. Red downward arrow showing decrease vectors Blue and Red Downward Trend Arrow on Black Background Showing Decline. A blue zigzag arrow transforms into red, pointing sharply downwards. The composition uses flat style and presents visual of business decline.
Free with trial A black industrial oil drum featuring a red downward arrow icon representing falling fuel market prices. Red downward arrow showing decrease illustrations Black oil barrel with a red down arrow showing a decrease in fuel prices. A black industrial oil drum featuring a red downward arrow icon representing falling fuel market prices