Free with trial Businessman rear view analyzing stock market crash with red arrow and financial charts on digital screen background showing economic downfall. Red downward arrow showing decrease illustrations Businessman watching stock market crash with falling red arrow and candlestick chart on large screen background reflecting. Businessman rear view analyzing stock market crash with red arrow and financial charts on digital screen background showing economic downfall
Free with trial This image depicts a central golden dollar sign symbolizing financial aspects, flanked by a red downward arrow indicating a decline and a green upward arrow showing growth. Additionally, a pie chart with three segments in different colors suggests analysis or distribution of financial data. Red downward arrow showing decrease illustrations Visual representation of economic fluctuations and financial performance metrics. This image depicts a central golden dollar sign symbolizing financial aspects, flanked by a red downward arrow indicating a decline and a green upward arrow showing growth. Additionally, a pie chart with three segments in different colors suggests analysis or distribution of financial data
Free with trial Illustration showing declining mortgage rates. Small house with coin stacks, red arrow symbolizes rates fall, potential real estate market changes. Financial concept, home buying. Red downward arrow showing decrease illustrations Illustration showing declining mortgage rates. Small house with coin stacks, red arrow symbolizes rates fall, potential real
Free with trial A downward trending graph with a red arrow pointing to the decline, set against a blue background with grid lines and various colored bars at the bottom. Red downward arrow showing decrease illustrations Downward trend analysis showing significant decline over time with various data points. A downward trending graph with a red arrow pointing to the decline, set against a blue background with grid lines and various colored bars at the bottom
Free with trial A graph showing a downward trend with a red line that peaks at the beginning and gradually decreases with fluctuations, ending with a downward arrow. Red downward arrow showing decrease illustrations Graph illustrating a downward trend with fluctuations and a decreasing pattern over time. A graph showing a downward trend with a red line that peaks at the beginning and gradually decreases with fluctuations, ending with a downward arrow
Free with trial A digital illustration of a bar graph with yellow bars decreasing in height from left to right, overlaid with a jagged red line connecting the top of each bar and ending in a downward-pointing arrow, symbolizing a negative trend or loss. Red downward arrow showing decrease illustrations A downward trending bar chart showing a consistent decline in performance metrics over a period. A digital illustration of a bar graph with yellow bars decreasing in height from left to right, overlaid with a jagged red line connecting the top of each bar and ending in a downward-pointing arrow, symbolizing a negative trend or loss
Free with trial A digital illustration of a bar graph with yellow bars decreasing in height from left to right, overlaid with a jagged red line connecting the top of each bar and ending in a downward-pointing arrow, symbolizing a negative trend or loss. Red downward arrow showing decrease illustrations A downward trending bar chart showing a consistent decline in performance metrics over a period. A digital illustration of a bar graph with yellow bars decreasing in height from left to right, overlaid with a jagged red line connecting the top of each bar and ending in a downward-pointing arrow, symbolizing a negative trend or loss
Free with trial 3D rendered financial graph with percentage signs showing downward trend. Falling arrow, bar chart, economic crisis, losses, financial decline, market crash, budget deficit, investment. Red downward arrow showing decrease illustrations 3D rendered financial graph with percentage signs showing downward trend. Falling arrow, bar chart, economic crisis, losses
Free with trial A striking 3D rendering of a red downward-pointing arrow dramatically positioned over detailed financial charts Illustrates concepts of market downturn economic crisis recession and financial loss Perfect for illustrating articles or presentations relating to financial markets. Red downward arrow showing decrease illustrations Red Down Arrow Over Financial Charts Showing Market Decline Recession Crisis Concept AI generated. A striking 3D rendering of a red downward-pointing arrow dramatically positioned over detailed financial charts Illustrates concepts of market downturn economic crisis recession and financial loss Perfect for illustrating articles or presentations relating to financial markets
Free with trial A close-up image depicting a red arrow pointing downwards positioned on a stack of documents and charts This represents a financial downturn or business decline illustrating concepts such as market crisis or economic loss A laptop is visible in the background. Red downward arrow showing decrease illustrations Financial Decline Red Arrow on Stack of Documents and Charts Showing Business Downturn AI generated. A close-up image depicting a red arrow pointing downwards positioned on a stack of documents and charts This represents a financial downturn or business decline illustrating concepts such as market crisis or economic loss A laptop is visible in the background
Free with trial This image shows several stacks of coins arranged from low to high, with a red arrow moving downward across the scene to indicate a drop in financial value. The coins are placed in a clean layout that highlights the contrast between growth and decline, creating a clear message about shifting economic conditions. The soft background helps keep attention on the arrow and the stacks, making the theme easy to understand. The downward motion suggests reduced performance, shrinking returns, or pressure within a financial setting. The combination of metal coins and a bold arrow gives the image a practical feel that can be used in discussions about budgeting, investment changes, or market adjustments. It can also support topics related to planning, forecasting, or understanding how external factors influence financial outcomes. The simple structure makes the message direct without adding unnecessary detail, allowing viewers to quickly grasp the idea of a downward trend. Red downward arrow showing decrease illustrations Descending red arrow over stacked coins showing market value decline on soft gradient background. This image shows several stacks of coins arranged from low to high, with a red arrow moving downward across the scene to indicate a drop in financial value. The coins are placed in a clean layout that highlights the contrast between growth and decline, creating a clear message about shifting economic conditions. The soft background helps keep attention on the arrow and the stacks, making the theme easy to understand. The downward motion suggests reduced performance, shrinking returns, or pressure within a financial setting. The combination of metal coins and a bold arrow gives the image a practical feel that can be used in discussions about budgeting, investment changes, or market adjustments. It can also support topics related to planning, forecasting, or understanding how external factors influence financial outcomes. The simple structure makes the message direct without adding unnecessary detail, allowing viewers to quickly grasp the idea of a downward trend.
Free with trial A striking image depicting a red arrow plummeting into a stack of business documents and financial charts The scene symbolizes economic downturn financial crisis or market decline perfect for illustrating articles on business news or financial analysis. Red downward arrow showing decrease illustrations Financial Crisis Concept Red Arrow Plunging into Stack of Business Documents and Charts Showing AI generated. A striking image depicting a red arrow plummeting into a stack of business documents and financial charts The scene symbolizes economic downturn financial crisis or market decline perfect for illustrating articles on business news or financial analysis
Free with trial A glowing red zigzag arrow points downward, representing a decline on a digital financial chart. The surface is gridded and dark, highlighting the red of the arrow. The arrow has a neon-like appearance and reflects off the glossy surface, signaling a decrease in value. The surrounding chart includes descending graphical elements indicating fluctuating data, conveying a downturn in financial performance or market trends. Red downward arrow showing decrease illustrations A large red arrow points downwards over a gridded financial chart showing a sharp decline in value. A glowing red zigzag arrow points downward, representing a decline on a digital financial chart. The surface is gridded and dark, highlighting the red of the arrow. The arrow has a neon-like appearance and reflects off the glossy surface, signaling a decrease in value. The surrounding chart includes descending graphical elements indicating fluctuating data, conveying a downturn in financial performance or market trends.
Free with trial A glowing red zigzag arrow points downward, representing a decline on a digital financial chart. The surface is gridded and dark, highlighting the red of the arrow. The arrow has a neon-like appearance and reflects off the glossy surface, signaling a decrease in value. The surrounding chart includes descending graphical elements indicating fluctuating data, conveying a downturn in financial performance or market trends. Red downward arrow showing decrease illustrations A large red arrow points downwards over a gridded financial chart showing a sharp decline in value. A glowing red zigzag arrow points downward, representing a decline on a digital financial chart. The surface is gridded and dark, highlighting the red of the arrow. The arrow has a neon-like appearance and reflects off the glossy surface, signaling a decrease in value. The surrounding chart includes descending graphical elements indicating fluctuating data, conveying a downturn in financial performance or market trends.
Free with trial A glowing red zigzag arrow points downward, representing a decline on a digital financial chart. The surface is gridded and dark, highlighting the red of the arrow. The arrow has a neon-like appearance and reflects off the glossy surface, signaling a decrease in value. The surrounding chart includes descending graphical elements indicating fluctuating data, conveying a downturn in financial performance or market trends. Red downward arrow showing decrease illustrations A large red arrow points downwards over a gridded financial chart showing a sharp decline in value. A glowing red zigzag arrow points downward, representing a decline on a digital financial chart. The surface is gridded and dark, highlighting the red of the arrow. The arrow has a neon-like appearance and reflects off the glossy surface, signaling a decrease in value. The surrounding chart includes descending graphical elements indicating fluctuating data, conveying a downturn in financial performance or market trends.
Free with trial A conceptual illustration featuring a red downward trend arrow pointing over stacks of gold coins that decrease in height to symbolize financial crisis, economic recession, market loss, and decreasing business profits or investment value. Red downward arrow showing decrease vectors A red downward arrow showing a financial downturn with stacks of gold coins decreasing in value to represent economic loss. A conceptual illustration featuring a red downward trend arrow pointing over stacks of gold coins that decrease in height to symbolize financial crisis, economic recession, market loss, and decreasing business profits or investment value
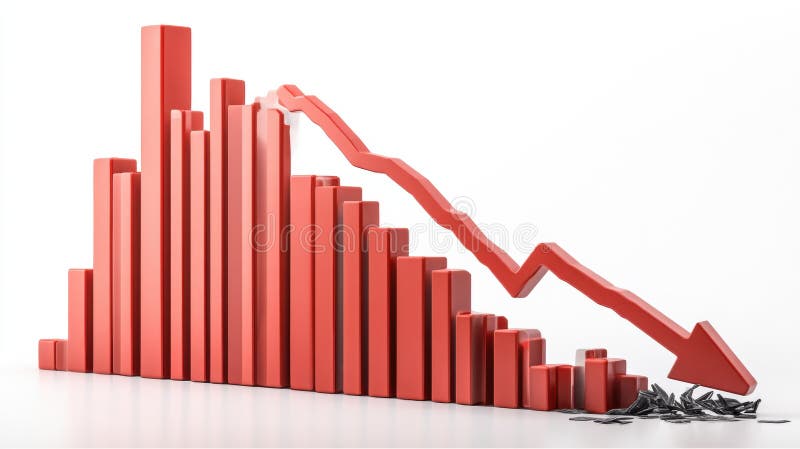
Free with trial A 3D rendering of a bar graph depicting a sharp decline in values. The red bars decrease in size, culminating in a large downward red arrow, symbolizing a significant economic downturn or market crash. The broken pieces at the bottom represent the loss or damage incurred. Red downward arrow showing decrease illustrations Red Bar Graph Showing Decline. A 3D rendering of a bar graph depicting a sharp decline in values. The red bars decrease in size, culminating in a large downward red arrow, symbolizing a significant economic downturn or market crash. The broken pieces at the bottom represent the loss or damage incurred.
Free with trial Tezos XTZ cryptocurrency value dip, price going down flat design. Vector eps illustration showing blue tezos icon over red downward graph with down arrow on blue background. Net worth decrease, digital wealth, profit loss illustration. Red downward arrow showing decrease vectors Tezos XTZ crypto currency price dip, worth going down, vector illustration. Tezos XTZ cryptocurrency value dip, price going down flat design. Vector eps illustration showing blue tezos icon over red downward graph with down arrow on blue background. Net worth decrease, digital wealth, profit loss illustration.
Free with trial Global Economic Down Fall Due to War, Inflation and Energy Crisis - Design Concept with Red World Map, Graph, Chart, Diagram Showing Steep Falling, Sharp Decrease of Profit or Results - Vector Design. Red downward arrow showing decrease vectors Global Economic Down Fall Due to War, Inflation and Energy Crisis - Design Concept with Red World Map, Graph, Chart, Diagram
Free with trial Isometric 3d red arrow pointing down over decreasing graph bars, concept of business loss. Red downward arrow showing decrease illustrations Red arrow pointing down over decreasing graph bars showing losses. Isometric 3d red arrow pointing down over decreasing graph bars, concept of business loss
Free with trial Economic crisis isometric vector illustration - business column chart with red arrow and falling column showing recession and crisis of economy, financial and banking indicators. Red downward arrow showing decrease vectors Economic crisis isometric vector illustration - business column chart with red arrow and falling column
Free with trial Two bar charts are displayed side by side. One shows a clear upward trend with a green arrow, while the other shows a downward trend with a red arrow. Red downward arrow showing decrease illustrations Bar charts showing contrasting upward and downward trends. Two bar charts are displayed side by side. One shows a clear upward trend with a green arrow, while the other shows a downward trend with a red arrow
Free with trial A visual representation of negative financial performance, illustrating a declining trend in business or market data with a prominent red arrow indicating a downward movement. Red downward arrow showing decrease illustrations Bar chart showing a downward trend with a red arrow. A visual representation of negative financial performance, illustrating a declining trend in business or market data with a prominent red arrow indicating a downward movement
Free with trial Financial concept image featuring a blue bar chart with a red downward arrow, illustrating decline, recession, or loss over time. Ideal for presentations, reports, infographics, economic forecasts, and business documentation. Clean, clear, and professional visual, created ai. Red downward arrow showing decrease illustrations Business bar chart showing financial decline with downward arrow. Financial concept image featuring a blue bar chart with a red downward arrow, illustrating decline, recession, or loss over time. Ideal for presentations, reports, infographics, economic forecasts, and business documentation. Clean, clear, and professional visual, created ai.
Free with trial A minimalist 3D bar chart rendered in white against a bright white background. The chart displays four bars of decreasing height, visually representing a sharp downward trend. A prominent white arrow, also pointing downwards, overlays the bars, emphasizing the decline. The composition is clean and abstract, suitable for representing financial or economic downturns. Red downward arrow showing decrease illustrations White 3D Bar Chart Showing a Sharp Downward Trend with Arrow on White Background graph. A minimalist 3D bar chart rendered in white against a bright white background. The chart displays four bars of decreasing height, visually representing a sharp downward trend. A prominent white arrow, also pointing downwards, overlays the bars, emphasizing the decline. The composition is clean and abstract, suitable for representing financial or economic downturns
Free with trial A red arrow graph sharply descends across a series of stacked white coins, illustrating a significant financial decline. The coins are arranged in decreasing height from left to right, emphasizing the downward trend. The image is set against a clean white background, isolating the visual representation of economic loss. Red downward arrow showing decrease illustrations Red Arrow Graph Showing Financial Decline with Stacks of White Coins on White Background. A red arrow graph sharply descends across a series of stacked white coins, illustrating a significant financial decline. The coins are arranged in decreasing height from left to right, emphasizing the downward trend. The image is set against a clean white background, isolating the visual representation of economic loss
Free with trial A red graph showing a downward trend with an arrow pointing down, isolated against a white area. It represents decline, loss, or a negative trend in business, finance, or the economy. Symbolizes market risk. Red downward arrow showing decrease illustrations Red graph with downward trend isolated on white background. use cases: business, finance. A red graph showing a downward trend with an arrow pointing down, isolated against a white area. It represents decline, loss, or a negative trend in business, finance, or the economy. Symbolizes market risk
Free with trial A red arrow points downwards over a bar graph indicating a significant financial decrease, isolated on white background. Red downward arrow showing decrease illustrations Red downward trending arrow and bar graph showing financial decline isolated on white background. A red arrow points downwards over a bar graph indicating a significant financial decrease, isolated on white background
Free with trial Generative ai, The image is of a red arrow pointing down, superimposed on a blue and red bar graph, symbolizing a downward trend, potentially indicating a financial or economic decline. Red downward arrow showing decrease illustrations A large red arrow points downwards over a gridded financial chart showing a sharp decline in value, with the bars of the chart. generative ai, The image is of a red arrow pointing down, superimposed on a blue and red bar graph, symbolizing a downward trend, potentially indicating a financial or economic decline
Free with trial A glowing red zigzag arrow points downward, representing a decline on a digital financial chart. The surface is gridded and dark, highlighting the red of the arrow. The arrow has a neon-like appearance and reflects off the glossy surface, signaling a decrease in value. The surrounding chart includes descending graphical elements indicating fluctuating data, conveying a downturn in financial performance or market trends. Red downward arrow showing decrease illustrations A large red arrow points downwards over a gridded financial chart showing a sharp decline in value. A glowing red zigzag arrow points downward, representing a decline on a digital financial chart. The surface is gridded and dark, highlighting the red of the arrow. The arrow has a neon-like appearance and reflects off the glossy surface, signaling a decrease in value. The surrounding chart includes descending graphical elements indicating fluctuating data, conveying a downturn in financial performance or market trends.
Free with trial A glowing red zigzag arrow points downward, representing a decline on a digital financial chart. The surface is gridded and dark, highlighting the red of the arrow. The arrow has a neon-like appearance and reflects off the glossy surface, signaling a decrease in value. The surrounding chart includes descending graphical elements indicating fluctuating data, conveying a downturn in financial performance or market trends. Red downward arrow showing decrease illustrations A large red arrow points downwards over a gridded financial chart showing a sharp decline in value. A glowing red zigzag arrow points downward, representing a decline on a digital financial chart. The surface is gridded and dark, highlighting the red of the arrow. The arrow has a neon-like appearance and reflects off the glossy surface, signaling a decrease in value. The surrounding chart includes descending graphical elements indicating fluctuating data, conveying a downturn in financial performance or market trends.
Free with trial A glowing red zigzag arrow points downward, representing a decline on a digital financial chart. The surface is gridded and dark, highlighting the red of the arrow. The arrow has a neon-like appearance and reflects off the glossy surface, signaling a decrease in value. The surrounding chart includes descending graphical elements indicating fluctuating data, conveying a downturn in financial performance or market trends. Red downward arrow showing decrease illustrations A large red arrow points downwards over a gridded financial chart showing a sharp decline in value. A glowing red zigzag arrow points downward, representing a decline on a digital financial chart. The surface is gridded and dark, highlighting the red of the arrow. The arrow has a neon-like appearance and reflects off the glossy surface, signaling a decrease in value. The surrounding chart includes descending graphical elements indicating fluctuating data, conveying a downturn in financial performance or market trends.
Free with trial A glowing red zigzag arrow points downward, representing a decline on a digital financial chart. The surface is gridded and dark, highlighting the red of the arrow. The arrow has a neon-like appearance and reflects off the glossy surface, signaling a decrease in value. The surrounding chart includes descending graphical elements indicating fluctuating data, conveying a downturn in financial performance or market trends. Red downward arrow showing decrease illustrations A large red arrow points downwards over a gridded financial chart showing a sharp decline in value. A glowing red zigzag arrow points downward, representing a decline on a digital financial chart. The surface is gridded and dark, highlighting the red of the arrow. The arrow has a neon-like appearance and reflects off the glossy surface, signaling a decrease in value. The surrounding chart includes descending graphical elements indicating fluctuating data, conveying a downturn in financial performance or market trends.
Free with trial A glowing red zigzag arrow points downward, representing a decline on a digital financial chart. The surface is gridded and dark, highlighting the red of the arrow. The arrow has a neon-like appearance and reflects off the glossy surface, signaling a decrease in value. The surrounding chart includes descending graphical elements indicating fluctuating data, conveying a downturn in financial performance or market trends. Red downward arrow showing decrease illustrations A large red arrow points downwards over a gridded financial chart showing a sharp decline in value. A glowing red zigzag arrow points downward, representing a decline on a digital financial chart. The surface is gridded and dark, highlighting the red of the arrow. The arrow has a neon-like appearance and reflects off the glossy surface, signaling a decrease in value. The surrounding chart includes descending graphical elements indicating fluctuating data, conveying a downturn in financial performance or market trends.
Free with trial Coronavirus economic crisis isometric vector illustration. Business column chart with red arrow and falling column showing recession and crisis of economy and banking indicators because of covid. Red downward arrow showing decrease vectors Coronavirus economic crisis isometric vector illustration - business column chart with red arrow and falling column. Coronavirus economic crisis isometric vector illustration. Business column chart with red arrow and falling column showing recession and crisis of economy and banking indicators because of covid.
Free with trial A simple illustration of a bar chart with a downward arrow showing decline, loss, negative growth, or decreasing business and financial performance. Red downward arrow showing decrease vectors Downward Trend Analytics Icon. A simple illustration of a bar chart with a downward arrow showing decline, loss, negative growth, or decreasing business and financial performance
Free with trial A bar chart showing a steady decline with a red downward arrow, symbolizing financial loss, economic downturn, business decline, or negative performance trends. Red downward arrow showing decrease illustrations Economic Downtrend Bar Chart for Business concept 3d Rendering. A bar chart showing a steady decline with a red downward arrow, symbolizing financial loss, economic downturn, business decline, or negative performance trends
Free with trial A bar chart showing a steady decline with a red downward arrow, symbolizing financial loss, economic downturn, business decline, or negative performance trends. Red downward arrow showing decrease illustrations Economic Downtrend Bar Chart for Business concept 3d Rendering. A bar chart showing a steady decline with a red downward arrow, symbolizing financial loss, economic downturn, business decline, or negative performance trends
Free with trial A bar chart showing a steady decline with a red downward arrow, symbolizing financial loss, economic downturn, business decline, or negative performance trends. Red downward arrow showing decrease illustrations Economic Downtrend Bar Chart for Business concept 3d Rendering. A bar chart showing a steady decline with a red downward arrow, symbolizing financial loss, economic downturn, business decline, or negative performance trends
Free with trial A bar chart showing a steady decline with a red downward arrow, symbolizing financial loss, economic downturn, business decline, or negative performance trends. Red downward arrow showing decrease illustrations Economic Downtrend Bar Chart for Business concept 3d Rendering. A bar chart showing a steady decline with a red downward arrow, symbolizing financial loss, economic downturn, business decline, or negative performance trends
Free with trial A bar chart showing a steady decline with a red downward arrow, symbolizing financial loss, economic downturn, business decline, or negative performance trends. Red downward arrow showing decrease illustrations Economic Downtrend Bar Chart for Business concept 3d Rendering. A bar chart showing a steady decline with a red downward arrow, symbolizing financial loss, economic downturn, business decline, or negative performance trends
Free with trial A bar chart showing a steady decline with a red downward arrow, symbolizing financial loss, economic downturn, business decline, or negative performance trends. Red downward arrow showing decrease illustrations Economic Downtrend Bar Chart for Business concept 3d Rendering. A bar chart showing a steady decline with a red downward arrow, symbolizing financial loss, economic downturn, business decline, or negative performance trends
Free with trial Flat style illustration showing a downward trending financial chart with dollar coin and bars. Red downward arrow showing decrease vectors Financial market decline showing loss with downward trend arrow. Flat style illustration showing a downward trending financial chart with dollar coin and bars.
Free with trial 3d render of stand holding tablet showing bright red descending graph, isolated on a transparent background. Red downward arrow showing decrease vectors 3d render of stand holding tablet showing bright red descending graph
Free with trial A simple and effective line graph illustrating the concept of debt reduction. The chart, on a clean white background, shows a green line trending downwards, representing a successful decrease in liabilities over time. A final red arrow emphasizes a significant or accelerated drop, symbolizing a successful financial strategy, cost-cutting, or achieving financial freedom. This vector illustration is perfect for presentations, articles, and infographics on personal or business finance, money management, and economic stability. Red downward arrow showing decrease vectors Debt Reduction Concept Graph Showing Downward Trend. A simple and effective line graph illustrating the concept of debt reduction. The chart, on a clean white background, shows a green line trending downwards, representing a successful decrease in liabilities over time. A final red arrow emphasizes a significant or accelerated drop, symbolizing a successful financial strategy, cost-cutting, or achieving financial freedom. This vector illustration is perfect for presentations, articles, and infographics on personal or business finance, money management, and economic stability.
Free with trial A detailed red financial graph illustrates a sharp downward trend in stock prices. Candlestick bars and a wavy line graph show a significant decline, with red arrows reinforcing the negative movement. The dark background features a grid, and a bright light emanates from the left side of the image. Red downward arrow showing decrease illustrations Red Financial Graph with Falling Stock Prices stock market. A detailed red financial graph illustrates a sharp downward trend in stock prices. Candlestick bars and a wavy line graph show a significant decline, with red arrows reinforcing the negative movement. The dark background features a grid, and a bright light emanates from the left side of the image
Free with trial This abstract financial graph visually represents a significant economic downturn or market decline. A prominent, bold red arrow sharply points downwards across a blue grid background, symbolizing loss, recession, or a negative trend. A lighter blue fluctuating line also shows a general downward trajectory, indicating market volatility or a secondary metric. This impactful illustration is ideal for conveying concepts of financial crisis, business failure, falling stock prices, or any situation involving a sharp decrease and poor performance. Red downward arrow showing decrease vectors Economic Downturn Graph with Red Arrow Showing Decline. This abstract financial graph visually represents a significant economic downturn or market decline. A prominent, bold red arrow sharply points downwards across a blue grid background, symbolizing loss, recession, or a negative trend. A lighter blue fluctuating line also shows a general downward trajectory, indicating market volatility or a secondary metric. This impactful illustration is ideal for conveying concepts of financial crisis, business failure, falling stock prices, or any situation involving a sharp decrease and poor performance.
Free with trial A person in a suit holding a magnifying glass showing blue upward and red downward percentage arrows. Red downward arrow showing decrease illustrations Person holding magnifying glass with percentage arrows hand blue. A person in a suit holding a magnifying glass showing blue upward and red downward percentage arrows.
Free with trial Two distinct bar charts are depicted against a white background. The left chart a downward trend with bars in blue, yellow, and purple, accompanied by a yellow coin with a dollar sign and an arrow pointing down towards it from a small graph indicating a rising trend. The right chart an upward trend with bars in red, green, and blue, and a green coin with a dollar sign connected to a circle with a. Red downward arrow showing decrease illustrations Bar charts showing financial growth and decline with dollar symbols. Two distinct bar charts are depicted against a white background. The left chart a downward trend with bars in blue, yellow, and purple, accompanied by a yellow coin with a dollar sign and an arrow pointing down towards it from a small graph indicating a rising trend. The right chart an upward trend with bars in red, green, and blue, and a green coin with a dollar sign connected to a circle with a
Free with trial Four simple bar chart are displayed against a white background. Two are solid black, one showing an upward trend with an arrow, and the other a downward trend with an arrow. The remaining two. Red downward arrow showing decrease vectors Four bar chart showing upward and downward trends graph. Four simple bar chart are displayed against a white background. Two are solid black, one showing an upward trend with an arrow, and the other a downward trend with an arrow. The remaining two
Free with trial Four colorful 3D arrows in red, orange, cyan, and green are pointing down, representing a decline, loss, or downward trend in a business or financial chart. Red downward arrow showing decrease vectors Set of Four Glossy 3D Arrows Showing a Downward Trend. Four colorful 3D arrows in red, orange, cyan, and green are pointing down, representing a decline, loss, or downward trend in a business or financial chart
Free with trial A silver laptop sits on a light brown wooden surface. Its screen displays a dark background with a grid pattern and a prominent red line graph sharply declining from left to right. The red line is brightly lit, creating a strong visual contrast against the dark background. The overall mood is one of concern or warning, suggesting a negative trend or decline. The image is clean and simple, focusing, generated by AI. Red downward arrow showing decrease illustrations Laptop Screen Showing Red Downward Trend Graph computer. A silver laptop sits on a light brown wooden surface. Its screen displays a dark background with a grid pattern and a prominent red line graph sharply declining from left to right. The red line is brightly lit, creating a strong visual contrast against the dark background. The overall mood is one of concern or warning, suggesting a negative trend or decline. The image is clean and simple, focusing, generated by AI.
Free with trial A flat design illustration of two bar charts, one green and one red, both showing a downward trend with arrows, representing financial or business decline. Red downward arrow showing decrease illustrations Bar chart showing declining trend isolated on white background. A flat design illustration of two bar charts, one green and one red, both showing a downward trend with arrows, representing financial or business decline
Free with trial A bar chart showing a steady decline with a red downward arrow, symbolizing financial loss, economic downturn, business decline, or negative performance trends. Red downward arrow showing decrease illustrations Economic Downtrend Bar Chart for Business concept 3d Rendering. A bar chart showing a steady decline with a red downward arrow, symbolizing financial loss, economic downturn, business decline, or negative performance trends
Free with trial Fall down chart, financial crisis. Decreasing arrow showing bankruptcy. Bad economic statistics with income loss. Money or price reduction report symbols, recession concept isolated vector set. Red downward arrow showing decrease vectors Fall down chart, financial crisis. Decreasing arrow showing bankruptcy. Bad economic statistics with income loss
Free with trial A bar chart showing a steady decline with a red downward arrow, symbolizing financial loss, economic downturn, business decline, or negative performance trends. Red downward arrow showing decrease illustrations Economic Downtrend Bar Chart for Business concept 3d Rendering. A bar chart showing a steady decline with a red downward arrow, symbolizing financial loss, economic downturn, business decline, or negative performance trends
Free with trial A bar chart showing a steady decline with a red downward arrow, symbolizing financial loss, economic downturn, business decline, or negative performance trends. Red downward arrow showing decrease illustrations Economic Downtrend Bar Chart for Business concept 3d Rendering. A bar chart showing a steady decline with a red downward arrow, symbolizing financial loss, economic downturn, business decline, or negative performance trends
Free with trial A bar chart showing a steady decline with a red downward arrow, symbolizing financial loss, economic downturn, business decline, or negative performance trends. Red downward arrow showing decrease illustrations Economic Downtrend Bar Chart for Business concept 3d Rendering. A bar chart showing a steady decline with a red downward arrow, symbolizing financial loss, economic downturn, business decline, or negative performance trends
Free with trial A red grid background displays a financial chart with alternating green and white candlesticks and a prominent white arrow pointing downwards. Red downward arrow showing decrease illustrations Red financial chart with green and white candlesticks showing downward trend. A red grid background displays a financial chart with alternating green and white candlesticks and a prominent white arrow pointing downwards
Free with trial A 3D bar chart with a red arrow indicating a significant downward trend, symbolizing financial loss or economic decline. Isolated on a white background. Red downward arrow showing decrease illustrations Bar chart showing a downward trend isolated on white background. A 3D bar chart with a red arrow indicating a significant downward trend, symbolizing financial loss or economic decline. Isolated on a white background
Free with trial The image depicts a bar graph displayed on an easel, illustrating a downward trend over time. The bars start high on the left and progressively decrease in height towards the right, with a red arrow emphasizing the decline. The graph's y-axis appears to measure an unspecified metric, while the x-axis represents a timeline. Red downward arrow showing decrease illustrations Graph showing decline over time. The image depicts a bar graph displayed on an easel, illustrating a downward trend over time. The bars start high on the left and progressively decrease in height towards the right, with a red arrow emphasizing the decline. The graph's y-axis appears to measure an unspecified metric, while the x-axis represents a timeline
Free with trial Isolated on transparent background downward arrow made of scattered red blocks. Red downward arrow showing decrease illustrations Graphic illustration showing downward trend with falling blocks design. Isolated on transparent background downward arrow made of scattered red blocks
Free with trial The image depicts a large golden coin with a dollar sign on it, accompanied by a bar graph showing a downward trend. A red downward arrow further emphasizes the decline. This visual representation suggests a decrease in the value of currency or economic downturn. Red downward arrow showing decrease illustrations Decreasing value of currency. The image depicts a large golden coin with a dollar sign on it, accompanied by a bar graph showing a downward trend. A red downward arrow further emphasizes the decline. This visual representation suggests a decrease in the value of currency or economic downturn
Free with trial Digital red graph with falling stock price on large screen in bright corporate office, concept of financial crisis and economic collapse, 3D Rendering. Red downward arrow showing decrease illustrations Red downward financial chart on screen in modern office showing market crash, economic recession, and global investment crisis. Digital red graph with falling stock price on large screen in bright corporate office, concept of financial crisis and economic collapse, 3D Rendering
Free with trial Digital red graph with falling stock price on large screen in bright corporate office, concept of financial crisis and economic collapse, 3D Rendering. Red downward arrow showing decrease illustrations Red downward financial chart on screen in modern office showing market crash, economic recession, and global investment crisis. Digital red graph with falling stock price on large screen in bright corporate office, concept of financial crisis and economic collapse, 3D Rendering
Free with trial A bar chart showing a downward trend is painted on an artist's canvas, symbolizing an economic downturn. The red arrow emphasizes the decline. Red downward arrow showing decrease illustrations Economic downturn depicted on artist\'s canvas. A bar chart showing a downward trend is painted on an artist's canvas, symbolizing an economic downturn. The red arrow emphasizes the decline
Free with trial A 3D rendered blue arrow symbol, depicted as a zig-zag line with an arrowhead pointing downwards, signifies a negative trend or decline. The object is isolated on a clean white background, making it suitable for representing financial data, economic downturns, or performance metrics. Red downward arrow showing decrease illustrations 3D Blue Arrow Graph Showing Downward Trend on White Background decrease. A 3D rendered blue arrow symbol, depicted as a zig-zag line with an arrowhead pointing downwards, signifies a negative trend or decline. The object is isolated on a clean white background, making it suitable for representing financial data, economic downturns, or performance metrics
Free with trial Financial business graph with bars decreasing and red arrow pointing down. Concept for economic recession or stock market decline. Red downward arrow showing decrease vectors Financial graph showing downward trend with arrow. Financial business graph with bars decreasing and red arrow pointing down. Concept for economic recession or stock market decline
Free with trial Bar chart showing decline, red arrow points down, financial crisis, recession, negative growth. Red downward arrow showing decrease illustrations Downward trend graph with white bars and red arrow. Bar chart showing decline, red arrow points down, financial crisis, recession, negative growth
Free with trial This image features a minimalist line graph with a red arrow pointing downwards, symbolizing a decline or loss. Below this, a detailed candlestick chart displays market volatility with fluctuating data points and numerical values on a dark background. The composition contrasts simple graphic design with intricate data visualization to represent economic downturns or negative performance metrics. Red downward arrow showing decrease vectors A simple line graph showing a downward trend alongside a complex financial chart. This image features a minimalist line graph with a red arrow pointing downwards. This image features a minimalist line graph with a red arrow pointing downwards, symbolizing a decline or loss. Below this, a detailed candlestick chart displays market volatility with fluctuating data points and numerical values on a dark background. The composition contrasts simple graphic design with intricate data visualization to represent economic downturns or negative performance metrics
Free with trial 3D illustration showing Bitcoin symbol with green upward and red downward arrows indicating price trends and market movement. Red downward arrow showing decrease illustrations Bitcoin price rising and falling with up and down arrows. 3D illustration showing Bitcoin symbol with green upward and red downward arrows indicating price trends and market movement
Free with trial This minimalist graphic illustration features a vertical bar chart with a prominent red arrow indicating a declining trend. The bars are rendered in varying shades of gray, arranged in descending order of height. A small blue globe icon is positioned near the arrow, symbolizing international or worldwide context. The overall design is clean, professional and suitable for business or financial. Red downward arrow showing decrease vectors A simple bar chart showing a downward trend with a global icon on a white background. This minimalist graphic illustration features a vertical bar chart with a prominent red arrow indicating a declining trend. The bars are rendered in varying shades of gray, arranged in descending order of height. A small blue globe icon is positioned near the arrow, symbolizing international or worldwide context. The overall design is clean, professional and suitable for business or financial
Free with trial 3D graphic depicts a steeply declining bar graph in red hues, showing economic loss. A downward-sloping arrow extends over the bars, illustrating the negative trend. The text reads "-40% PROFIT," emphasizing financial decline. The bars decrease in height from left to right, indicating progressive loss. The background is a dark grid, enhancing the focus on the graph. The visual conveys the concept of significant profit reduction and economic downturn. Red downward arrow showing decrease illustrations 3D Financial Concept of Profit Loss and Economic Decline. 3D graphic depicts a steeply declining bar graph in red hues, showing economic loss. A downward-sloping arrow extends over the bars, illustrating the negative trend. The text reads "-40% PROFIT," emphasizing financial decline. The bars decrease in height from left to right, indicating progressive loss. The background is a dark grid, enhancing the focus on the graph. The visual conveys the concept of significant profit reduction and economic downturn.
Free with trial Red downward arrow pointing towards green house icon with euro symbol isolated on transparent background. Red downward arrow showing decrease vectors Graphic showing decrease in interest rates for home loans. Red downward arrow pointing towards green house icon with euro symbol isolated on transparent background
Free with trial Close-up of a hand placing a wooden block with a red icon showing a person and a downward arrow, representing job cuts, layoffs, and workforce reduction in a business context next to pie charts. Red downward arrow showing decrease illustrations Business Downsizing and Layoff Concept with Wooden Blocks. Close-up of a hand placing a wooden block with a red icon showing a person and a downward arrow, representing job cuts, layoffs, and workforce reduction in a business context next to pie charts
Free with trial Illustration of a bar graph showing a downward trend with a red arrow. A yellow star is positioned at the end of the arrow. The graph consists of six colorful bars decreasing in height from left to right. Red downward arrow showing decrease illustrations Downward trend graph with star isolated on white background. Illustration of a bar graph showing a downward trend with a red arrow. A yellow star is positioned at the end of the arrow. The graph consists of six colorful bars decreasing in height from left to right
Free with trial A close-up shot of a hand stacking three wooden blocks, each featuring a significant symbol. The top block displays a green upward arrow, the middle a red downward arrow, and the bottom a black percentage symbol. This visual metaphor effectively represents concepts of increase, decrease, and percentage change. Ideal for illustrating financial topics like interest rates, inflation, economic trends, profit loss, discounts, or general business performance. The clean, minimalist background offers ample copy space for text or additional graphics, making it versatile for various editorial and commercial uses. Red downward arrow showing decrease illustrations Interest Rate or Percentage Change Concept with Wooden Blocks. A close-up shot of a hand stacking three wooden blocks, each featuring a significant symbol. The top block displays a green upward arrow, the middle a red downward arrow, and the bottom a black percentage symbol. This visual metaphor effectively represents concepts of increase, decrease, and percentage change. Ideal for illustrating financial topics like interest rates, inflation, economic trends, profit loss, discounts, or general business performance. The clean, minimalist background offers ample copy space for text or additional graphics, making it versatile for various editorial and commercial uses.
Free with trial A 3D financial visualization showing a sharp economic decline. A red downward arrow crashes through green and red bar charts, representing market loss, recession, and the impact on workforce and societ. Red downward arrow showing decrease illustrations 3D Economic Crisis Graph with Falling Red Arrow and People Icons. A 3D financial visualization showing a sharp economic decline. A red downward arrow crashes through green and red bar charts, representing market loss, recession, and the impact on workforce and societ
Free with trial A 3D financial visualization showing a sharp economic decline. A red downward arrow crashes through green and red bar charts, representing market loss, recession, and the impact on workforce and societ. Red downward arrow showing decrease illustrations 3D Economic Crisis Graph with Falling Red Arrow and People Icons. A 3D financial visualization showing a sharp economic decline. A red downward arrow crashes through green and red bar charts, representing market loss, recession, and the impact on workforce and societ
Free with trial A 3D financial visualization showing a sharp economic decline. A red downward arrow crashes through green and red bar charts, representing market loss, recession, and the impact on workforce and societ. Red downward arrow showing decrease illustrations 3D Economic Crisis Graph with Falling Red Arrow and People Icons. A 3D financial visualization showing a sharp economic decline. A red downward arrow crashes through green and red bar charts, representing market loss, recession, and the impact on workforce and societ