Free with trial A black industrial oil drum featuring a red downward arrow icon representing falling fuel market prices. Red downward arrow showing decrease illustrations Black oil barrel with a red down arrow showing a decrease in fuel prices. A black industrial oil drum featuring a red downward arrow icon representing falling fuel market prices
Free with trial A red graph on a transparent background displaying a downward trend with bars and a prominent arrow indicating a sharp decline. Red downward arrow showing decrease illustrations Graph showing a significant decline in trend with red bars and arrow. A red graph on a transparent background displaying a downward trend with bars and a prominent arrow indicating a sharp decline
Free with trial Blue bar chart illustrating financial decline with downward red arrow pointing to green dollar sign, isolated. Red downward arrow showing decrease illustrations Business graph showing decreasing performance with red arrow and dollar. Blue bar chart illustrating financial decline with downward red arrow pointing to green dollar sign, isolated
Free with trial A red line graph showing a downward trend on a gray grid background with white lines. Generative AI. Red downward arrow showing decrease illustrations A red line graph showing a downward trend on a gray grid background with white lines
Free with trial An image of a wooden easel holding a whiteboard with a bar graph and a red arrow indicating a downward trend, symbolizing a decrease or decline. Red downward arrow showing decrease illustrations A graph on an easel showing a decline in values over time with a downward trend. An image of a wooden easel holding a whiteboard with a bar graph and a red arrow indicating a downward trend, symbolizing a decrease or decline
Free with trial The image depicts a bar graph with a series of bars showing a downward trend. A red arrow is pointing downwards, indicating a decline in values over time. Red downward arrow showing decrease illustrations A downward trending graph with a red arrow indicating a decline in values. The image depicts a bar graph with a series of bars showing a downward trend. A red arrow is pointing downwards, indicating a decline in values over time
Free with trial Stat bars and falling arrow showing a downward trend. 3D illustration. Red downward arrow showing decrease illustrations Stat bars and falling arrow showing a downward trend. 3D illustration
Free with trial The image depicts a series of wooden blocks with percentage signs on them, stacked with coins, showing a decline in value as indicated by a red arrow trending downwards. Red downward arrow showing decrease illustrations Stacks of coins with percentage signs decline alongside a downward trend arrow. The image depicts a series of wooden blocks with percentage signs on them, stacked with coins, showing a decline in value as indicated by a red arrow trending downwards
Free with trial A digital abstract background showing a global financial crisis with red arrows, crashing charts, and a blue downward arrow on a dark grid. 3D Rendering. Red downward arrow showing decrease illustrations Abstract background of global financial crisis with red downward arrows and crashing stock market chart on dark fintech grid. A digital abstract background showing a global financial crisis with red arrows, crashing charts, and a blue downward arrow on a dark grid. 3D Rendering
Free with trial A graph showing a downward trend with a red arrow pointing downwards, indicating a decline or loss in value or quantity, set against a blue background with grid lines and faint white graphs. Red downward arrow showing decrease illustrations Declining trend indicated by red arrow on graph showing loss in value. A graph showing a downward trend with a red arrow pointing downwards, indicating a decline or loss in value or quantity, set against a blue background with grid lines and faint white graphs
Free with trial A 3D bar chart composed of four colored bars (orange, green, white, and blue) stands on a black base. A line graph with red dots connects the tops of the bars, showing a fluctuating trend that culminates in a sharp downward movement indicated by a red arrow. This visual represents a negative financial trend or economic decline. Red downward arrow showing decrease illustrations 3D Bar Chart with Downward Trend Line and Arrow Indicating Financial Decline graph. A 3D bar chart composed of four colored bars (orange, green, white, and blue) stands on a black base. A line graph with red dots connects the tops of the bars, showing a fluctuating trend that culminates in a sharp downward movement indicated by a red arrow. This visual represents a negative financial trend or economic decline
Free with trial A sharp red arrow graph depicting a significant decline and financial loss, isolated on a white background. Red downward arrow showing decrease illustrations Red downward trending arrow graph showing financial loss isolated on white background. A sharp red arrow graph depicting a significant decline and financial loss, isolated on a white background
Free with trial A red line graph showing a downward trend on a white grid background indicating decline or loss. Generative AI. Red downward arrow showing decrease illustrations A red line graph showing a downward trend on a white grid background indicating decline or loss
Free with trial The image depicts a bar graph with a series of red bars that are progressively decreasing in height from left to right. A large red arrow is pointing downwards, emphasizing the downward trend. Red downward arrow showing decrease illustrations Graph showing a downward trend with a large red arrow pointing downwards. The image depicts a bar graph with a series of red bars that are progressively decreasing in height from left to right. A large red arrow is pointing downwards, emphasizing the downward trend
Free with trial Computer Screen Showing Downward Trend Graph in Red. Stock Market Decrease and Economic Problems. Red downward arrow showing decrease vectors Computer Screen Showing Downward Trend Graph in Red. Stock Market Decrease and Economic Problems
Free with trial This dramatic AI-generated visualization features a prominent 3D red decline arrow falling sharply against a shadowed, professional gray backdrop. Perfect for business professionals and marketers seeking to illustrate financial loss, negative trends, or economic recession data with a powerful, metaphorical image. Red downward arrow showing decrease illustrations Curved 3D red arrow pointing downward on a dark background showing financial or economic decline. This dramatic AI-generated visualization features a prominent 3D red decline arrow falling sharply against a shadowed, professional gray backdrop. Perfect for business professionals and marketers seeking to illustrate financial loss, negative trends, or economic recession data with a powerful, metaphorical image.
Free with trial A 3D bar graph with blue bars decreasing in height from left to right, accompanied by a large red arrow pointing downwards, symbolizing a sharp decline or drop in data over a certain period. Red downward arrow showing decrease illustrations Graph showing a significant decline in values over time with a red arrow indicating downward trend. A 3D bar graph with blue bars decreasing in height from left to right, accompanied by a large red arrow pointing downwards, symbolizing a sharp decline or drop in data over a certain period
Free with trial The image displays a graph with a red line trending downward, suggesting a decrease or decline in the represented data over a period of time. The background of the graph is gray with a grid pattern, and the red line has fluctuations but overall points downwards, ending with a red arrowhead at the bottom right. Red downward arrow showing decrease illustrations A graph showing a downward trend with a red line indicating decline over time. The image displays a graph with a red line trending downward, suggesting a decrease or decline in the represented data over a period of time. The background of the graph is gray with a grid pattern, and the red line has fluctuations but overall points downwards, ending with a red arrowhead at the bottom right
Free with trial Blue bar graph with a downward trending arrow and a red heart above, representing a decrease in love or affection. Red downward arrow showing decrease vectors Blue bar graph showing decrease in love and affection. Blue bar graph with a downward trending arrow and a red heart above, representing a decrease in love or affection
Free with trial Two contrasting graphs are displayed on a white background. The left graph a green upward trending arrow and dotted line representing profit. The. Red downward arrow showing decrease illustrations Upward green arrow graph indicating profit growth next to downward red arrow graph showing financial loss on white. Two contrasting graphs are displayed on a white background. The left graph a green upward trending arrow and dotted line representing profit. The
Free with trial Two contrasting graphs are displayed on a white background. The left graph a green upward trending arrow and dotted line representing profit. The. Red downward arrow showing decrease illustrations Upward green arrow graph indicating profit growth next to downward red arrow graph showing financial loss on white. Two contrasting graphs are displayed on a white background. The left graph a green upward trending arrow and dotted line representing profit. The
Free with trial Red arrow declining on bar graph, business finance chart, downward trend, recession, financial data, blue background. Red downward arrow showing decrease illustrations Red arrow graph showing decline, business finance chart, downward trend, recession. Red arrow declining on bar graph, business finance chart, downward trend, recession, financial data, blue background
Free with trial A striking image depicting a large red downward arrow dramatically positioned over financial charts This illustrates market downturn economic recession or financial crisis visually Ideal for articles and presentations concerning economic hardship. Red downward arrow showing decrease illustrations Dramatic Red Down Arrow on Financial Charts Showing Market Decline Recession and Economic Crisis AI generated. A striking image depicting a large red downward arrow dramatically positioned over financial charts This illustrates market downturn economic recession or financial crisis visually Ideal for articles and presentations concerning economic hardship
Free with trial Magnifying glass showing falling dollar currency value with red downward arrow for finance and business concepts. Red downward arrow showing decrease vectors Magnifying glass showing falling dollar currency value with red downward arrow
Free with trial Red arrow with a broken line indicating a sharp decline, showing a financial downturn. Red downward arrow showing decrease vectors Red arrow showing financial decline with broken line and downward trend. Red arrow with a broken line indicating a sharp decline, showing a financial downturn.
Free with trial A Bitcoin coin with a downward trending red arrow on a graph showing a decline in value,. Red downward arrow showing decrease illustrations A Bitcoin coin with a downward trending red arrow on a graph showing a decline in value
Free with trial 3D illustration of stacked gold coins with a red downward arrow, symbolizing financial loss, market decline, or economic downturn. Perfect for finance presentations, investment reports, economic analysis, and business-related visuals showing negative trends. Red downward arrow showing decrease illustrations . 3D illustration of stacked gold coins with a red downward arrow, symbolizing financial loss, market decline, or economic downturn. Perfect for finance presentations, investment reports, economic analysis, and business-related visuals showing negative trends.
Free with trial Stacks of coins visually represent decreasing wealth, signified by a downward-pointing red arrow, indicating financial loss or decline for illustrating economic concepts. Red downward arrow showing decrease illustrations Coin Stack with Red Arrow Showing Financial Decline. Stacks of coins visually represent decreasing wealth, signified by a downward-pointing red arrow, indicating financial loss or decline for illustrating economic concepts
Free with trial A 3D bar chart with a red arrow showing a downward trend. This image symbolizes economic decline, financial issues, and negative business performance. Red downward arrow showing decrease illustrations Red arrow showing downward trend on a 3D bar chart representing economic decline. A 3D bar chart with a red arrow showing a downward trend. This image symbolizes economic decline, financial issues, and negative business performance.
Free with trial An image showing stacks of gold coins arranged with wooden blocks spelling 'COST' and a red arrow trending downwards, indicating a decrease in cost or expenses, symbolizing financial savings or reduced expenditure. Red downward arrow showing decrease illustrations Stacks of gold coins with a downward trend arrow and the word cost on wooden blocks. An image showing stacks of gold coins arranged with wooden blocks spelling 'COST' and a red arrow trending downwards, indicating a decrease in cost or expenses, symbolizing financial savings or reduced expenditure
Free with trial Abstract red and yellow candlestick chart on dark background with descending arrow, representing global financial crisis and market crash. 3D Rendering. Red downward arrow showing decrease illustrations Abstract background showing downward yellow arrow and red candlestick chart indicating global financial crisis and stock market. Abstract red and yellow candlestick chart on dark background with descending arrow, representing global financial crisis and market crash. 3D Rendering
Free with trial Financial chart with red and yellow candlesticks and a downward yellow arrow, on a dark background, concept of market crash and recession. 3D Rendering. Red downward arrow showing decrease illustrations Abstract financial chart with red and yellow candlesticks showing a downward trend and falling market data on dark background. 3D. Financial chart with red and yellow candlesticks and a downward yellow arrow, on a dark background, concept of market crash and recession. 3D Rendering
Free with trial Red arrow descending over digital candlestick chart with grid background, representing financial crash, stock market collapse, and recession. 3D Rendering. Red downward arrow showing decrease illustrations Red downward arrow on digital chart showing financial market crash and global economic recession with candlestick graph overlay on. Red arrow descending over digital candlestick chart with grid background, representing financial crash, stock market collapse, and recession. 3D Rendering
Free with trial This image presents a simple visual showing a falling financial trend, using a red arrow that moves downward in a stepped motion to suggest a steady reduction over time. The arrow sits above the words financial decline, which reinforces the theme of reduced performance or weakening conditions. The pale background and central dividing line help keep the focus on the arrow and text, making the message clear without distraction. The overall layout communicates the idea of shrinking results, reduced revenue, or broader economic pressure. This type of visual is often used in reports, presentations, and articles that discuss downturns, risk, or negative outcomes in business or economic settings. The clean style makes it suitable for a wide range of professional uses where a direct and uncomplicated representation of loss or reduction is needed. The image can support topics such as market shifts, budget cuts, operational challenges, or general financial stress. It can also be used to highlight the impact of external factors that influence performance, helping viewers quickly understand the direction of change being described. Red downward arrow showing decrease illustrations Red downward arrow chart showing financial decline trend with financial decline text on pale background. This image presents a simple visual showing a falling financial trend, using a red arrow that moves downward in a stepped motion to suggest a steady reduction over time. The arrow sits above the words financial decline, which reinforces the theme of reduced performance or weakening conditions. The pale background and central dividing line help keep the focus on the arrow and text, making the message clear without distraction. The overall layout communicates the idea of shrinking results, reduced revenue, or broader economic pressure. This type of visual is often used in reports, presentations, and articles that discuss downturns, risk, or negative outcomes in business or economic settings. The clean style makes it suitable for a wide range of professional uses where a direct and uncomplicated representation of loss or reduction is needed. The image can support topics such as market shifts, budget cuts, operational challenges, or general financial stress. It can also be used to highlight the impact of external factors that influence performance, helping viewers quickly understand the direction of change being described.
Free with trial Dual financial chart with green upward and red downward bars and coin accents, ideal for finance articles, market reports, stock visuals, and economic presentations. Red downward arrow showing decrease vectors Stock market bar chart showing rising green bars and falling red bars with coins. Dual financial chart with green upward and red downward bars and coin accents, ideal for finance articles, market reports, stock visuals, and economic presentations
Free with trial A versatile collection of colorful down arrow icons, presented in a modern flat design style. This set features a variety of arrow shapes and styles in vibrant shades of blue, green, yellow, and red, all pointing downwards on a light background. These clean, vector graphic elements are perfect for user interface (UI) design, web buttons, download symbols, infographics showing a decrease or negative trend, and navigation indicators in apps or presentations. An essential toolkit for any graphic designer's collection. Red downward arrow showing decrease vectors Colorful Flat Design Down Arrow Icon Set. A versatile collection of colorful down arrow icons, presented in a modern flat design style. This set features a variety of arrow shapes and styles in vibrant shades of blue, green, yellow, and red, all pointing downwards on a light background. These clean, vector graphic elements are perfect for user interface (UI) design, web buttons, download symbols, infographics showing a decrease or negative trend, and navigation indicators in apps or presentations. An essential toolkit for any graphic designer's collection.
Free with trial A 3D bar graph showing a downward trend with a red arrow indicating a decline. Red downward arrow showing decrease illustrations Decreasing bar graph with downward trend. A 3D bar graph showing a downward trend with a red arrow indicating a decline
Free with trial An image showing stacks of gold coins decreasing in size from left to right, each stack labeled with a percentage symbol, accompanied by a red arrow trending downward. Red downward arrow showing decrease illustrations Stacks of gold coins decreasing in size with percentage symbol and downward trend arrow. An image showing stacks of gold coins decreasing in size from left to right, each stack labeled with a percentage symbol, accompanied by a red arrow trending downward
Free with trial This 3D render depicts a stark red downward trend line superimposed over a grid background, with a bar chart showing declining values. The composition visually represents financial loss, economic downturn, market crash, or negative performance. The bold red color and sharp angles convey urgency and a sense of crisis, making it ideal for illustrating concepts related to business failure, stock market decline, or any situation involving a significant negative trajectory. Red downward arrow showing decrease illustrations Red Downward Trend Graph with Bar Chart. This 3D render depicts a stark red downward trend line superimposed over a grid background, with a bar chart showing declining values. The composition visually represents financial loss, economic downturn, market crash, or negative performance. The bold red color and sharp angles convey urgency and a sense of crisis, making it ideal for illustrating concepts related to business failure, stock market decline, or any situation involving a significant negative trajectory.
Free with trial A bar graph showing a downward trend with a red arrow indicating a decline. Red downward arrow showing decrease illustrations Decreasing bar graph with downward arrow isolated on white background. A bar graph showing a downward trend with a red arrow indicating a decline
Free with trial A visual representation of a business or financial metric showing a significant decline, depicted by a series of blue bars and a descending red arrow. Red downward arrow showing decrease illustrations Bar chart with red arrow indicating a downward trend. A visual representation of a business or financial metric showing a significant decline, depicted by a series of blue bars and a descending red arrow
Free with trial An image showing stacks of gold and silver coins on a reflective surface with a large gold dollar sign in the center, accompanied by a red arrow trending downwards, symbolizing a decrease in financial value or economic downturn. Red downward arrow showing decrease illustrations Stacks of coins with a dollar sign and a downward trend arrow indicating financial decline. An image showing stacks of gold and silver coins on a reflective surface with a large gold dollar sign in the center, accompanied by a red arrow trending downwards, symbolizing a decrease in financial value or economic downturn
Free with trial A vibrant, hand-drawn style downward-pointing arrow featuring a yellow to orange gradient fill with a distinctive red speckled texture and a dark outline. Isolated on a clean white background, this graphic element is perfect for indicating direction, downloads, navigation, or drawing attention. Ideal for web design, UI UX, presentations, infographics, and marketing materials requiring a bold and modern visual cue. Red downward arrow showing decrease illustrations Textured Gradient Down Arrow Icon on White Background. A vibrant, hand-drawn style downward-pointing arrow featuring a yellow to orange gradient fill with a distinctive red speckled texture and a dark outline. Isolated on a clean white background, this graphic element is perfect for indicating direction, downloads, navigation, or drawing attention. Ideal for web design, UI UX, presentations, infographics, and marketing materials requiring a bold and modern visual cue.
Free with trial A close-up of paper cutouts, showing a red background and a declining green arrow. Red downward arrow showing decrease illustrations Red paper with green arrow up. A close-up of paper cutouts, showing a red background and a declining green arrow
Free with trial A black line graph with a zigzagging downward trend and an arrow pointing down. Clear details and vibrant colo. Red downward arrow showing decrease illustrations Black line graph showing a sharp downward trend on white background chart decline. A black line graph with a zigzagging downward trend and an arrow pointing down. Clear details and vibrant colo
Free with trial Cartoon bar graph on an easel with a red arrow indicating a downward trend. Clear details and vib. Red downward arrow showing decrease illustrations Cartoon Bar Graph Showing Downward Trend with Red Arrow chart bar chart. Cartoon bar graph on an easel with a red arrow indicating a downward trend. Clear details and vib
Free with trial Red falling arrow and desperate businessman silhouette representing stock market crash, investment loss and financial crisis. Red downward arrow showing decrease illustrations Stock market crash showing a desperate businessman and red falling arrow on digital screen. Red falling arrow and desperate businessman silhouette representing stock market crash, investment loss and financial crisis
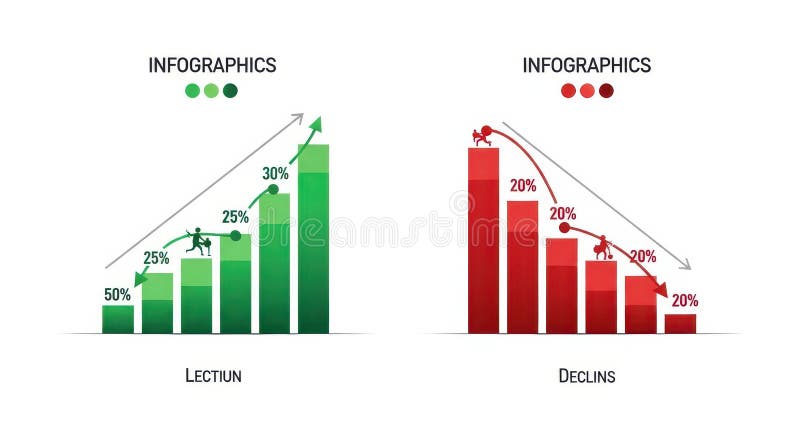
Free with trial The image displays two infographics side by side. the left infographic, titled "lection," depicts a green bar graph showing growth, starting at 50% and increasing to 30% with a figure climbing the bars. an upward-pointing arrow indicates positive growth. the right infographic, titled "declins," shows a red bar graph illustrating decline, starting at 20% and decreasing to 20% with a figure falling down the bars. a downward-pointing arrow indicates negative growth. Red downward arrow showing decrease illustrations Infographics showing growth and decline charts. the image displays two infographics side by side. the left infographic, titled "lection," depicts a green bar graph showing growth, starting at 50% and increasing to 30% with a figure climbing the bars. an upward-pointing arrow indicates positive growth. the right infographic, titled "declins," shows a red bar graph illustrating decline, starting at 20% and decreasing to 20% with a figure falling down the bars. a downward-pointing arrow indicates negative growth.
Free with trial A simple red line graph showing a sharp downward trend, indicating a significant decrease or loss in value, isolated against a clean white background for clarity. Red downward arrow showing decrease illustrations Red downward trending graph isolated on white background. A simple red line graph showing a sharp downward trend, indicating a significant decrease or loss in value, isolated against a clean white background for clarity
Free with trial This image features five diminishing stacks of shiny gold coins arranged in a row on a wooden surface, accompanied by a large red downward-pointing arrow on the right side, symbolizing financial loss, economic decline, or a decrease in savings and investment value. Red downward arrow showing decrease illustrations A conceptual illustration showing stacks of gold coins declining with a red downward pointing arrow. This image features five diminishing stacks of shiny gold coins arranged in a row on a wooden surface, accompanied by a large red downward-pointing arrow on the right side, symbolizing financial loss, economic decline, or a decrease in savings and investment value
Free with trial Laptop on desk showing red falling stock chart, digital graphic style, office background, concept of global financial market crash. 3D Rendering. Red downward arrow showing decrease illustrations Red downward stock market chart on laptop screen showing financial crisis data in modern office with soft lighting and digital. Laptop on desk showing red falling stock chart, digital graphic style, office background, concept of global financial market crash. 3D Rendering
Free with trial The image features two arrows, one green pointing upwards and one red pointing downwards. The green arrow on the left signifies an upward direction, often indicating increase or improvement. The red arrow on the right signifies a downward direction, typically representing decrease or decline. These arrows are commonly used in various contexts to indicate movement or status changes. Red downward arrow showing decrease illustrations Arrows showing up and down. The image features two arrows, one green pointing upwards and one red pointing downwards. The green arrow on the left signifies an upward direction, often indicating increase or improvement. The red arrow on the right signifies a downward direction, typically representing decrease or decline. These arrows are commonly used in various contexts to indicate movement or status changes
Free with trial A red bar chart illustrates a steep downward trend with a red arrow indicating a significant decrease in value. Red downward arrow showing decrease illustrations Red bar chart showing sharp decline. A red bar chart illustrates a steep downward trend with a red arrow indicating a significant decrease in value
Free with trial A compelling image depicting a red downward-pointing arrow dramatically positioned over a stack of financial reports visually communicating a significant market downturn or economic crisis The charts and graphs emphasize the severity of the decline Ideal for illustrating financial news or articles related to economic instability. Red downward arrow showing decrease illustrations Financial Crisis Red Downward Arrow on Stack of Financial Reports and Charts Showing Market Decline AI generated. A compelling image depicting a red downward-pointing arrow dramatically positioned over a stack of financial reports visually communicating a significant market downturn or economic crisis The charts and graphs emphasize the severity of the decline Ideal for illustrating financial news or articles related to economic instability
Free with trial A flat design illustration of a bar chart showing a declining trend, with a red arrow pointing downwards, symbolizing a decrease in performance or value. Red downward arrow showing decrease illustrations Bar chart with a downward trend isolated on white background. A flat design illustration of a bar chart showing a declining trend, with a red arrow pointing downwards, symbolizing a decrease in performance or value
Free with trial This minimalist vector illustration depicts a financial chart with a bold red arrow pointing downwards, symbolizing a significant decline or loss. The graphic features clean lines and a simple aesthetic, emphasizing the negative movement of the data points. The stark contrast between the red elements and the plain background makes it an effective visual for concepts related to economic downturns,. Red downward arrow showing decrease vectors A red line graph showing a sharp downward trend on a white background. This minimalist vector illustration depicts a financial chart with a bold red arrow pointing downwards, symbolizing a significant decline or loss. The graphic features clean lines and a simple aesthetic, emphasizing the negative movement of the data points. The stark contrast between the red elements and the plain background makes it an effective visual for concepts related to economic downturns,
Free with trial This minimalist vector illustration depicts a financial chart with a prominent red arrow pointing downwards, symbolizing a significant decline in value or performance. The graphic features clean lines and a simple color palette, emphasizing the negative trend against a neutral backdrop. Below the chart, numerical data points are displayed in a rectangular box, highlighting the extent of the loss. Red downward arrow showing decrease vectors A red line graph showing a sharp downward trend on a white background. This minimalist vector illustration depicts a financial chart with a prominent red arrow. This minimalist vector illustration depicts a financial chart with a prominent red arrow pointing downwards, symbolizing a significant decline in value or performance. The graphic features clean lines and a simple color palette, emphasizing the negative trend against a neutral backdrop. Below the chart, numerical data points are displayed in a rectangular box, highlighting the extent of the loss.
Free with trial 3D isometric business chart showing a downward trend with a red arrow and colorful bar graphs on a grid background, isolated on white. Red downward arrow showing decrease illustrations 3D isometric business chart showing a downward trend with a red arrow and colorful bar graphs on a grid background, isolated on
Free with trial This clean vector graphic depicts a vertical thermometer with a red liquid column indicating a downward trend. A red arrow points toward a snowflake icon, symbolizing cooling weather or a decrease in thermal energy. The design uses a minimalist style with clear numerical markings against a plain white background, suitable for weather reports or climate data visualization. Red downward arrow showing decrease vectors A graphic illustration of a thermometer showing a drop in temperature levels. This clean vector graphic depicts a vertical thermometer with a red liquid column indicating a downward trend. A red arrow points toward a snowflake icon, symbolizing cooling weather or a decrease in thermal energy. The design uses a minimalist style with clear numerical markings against a plain white background, suitable for weather reports or climate data visualization
Free with trial This minimalist vector illustration depicts a declining line chart against a clean background. The graphic features a prominent red arrow pointing downward, symbolizing a negative trend or financial loss. The composition uses a professional color palette of muted grays and a bold red accent to highlight the downward movement of the data points. Red downward arrow showing decrease vectors A simple line graph showing a downward trend in business performance metrics. This minimalist vector illustration depicts a declining line chart against a clean background. The graphic features a prominent red arrow pointing downward, symbolizing a negative trend or financial loss. The composition uses a professional color palette of muted grays and a bold red accent to highlight the downward movement of the data points
Free with trial The image depicts a dollar sign in the center with a red downward arrow on the left and a green upward arrow on the right. This visual metaphor represents financial trends, specifically a decrease and an increase in monetary value or economic indicators. Red downward arrow showing decrease illustrations Financial trend illustration showing increase and decrease with dollar sign. The image depicts a dollar sign in the center with a red downward arrow on the left and a green upward arrow on the right. This visual metaphor represents financial trends, specifically a decrease and an increase in monetary value or economic indicators
Free with trial 3d Red arrow showing downward trend in stock market. Financial crisis concept with broken coins, investment risk, and money loss. Vector illustration. Red downward arrow showing decrease vectors 3d Red arrow downward trend in stock market. 3d Red arrow showing downward trend in stock market. Financial crisis concept with broken coins, investment risk, and money loss. Vector illustration
Free with trial Concept of decline and decrease. Red arrow showing downward trend, falling graph, negative movement. Red downward arrow showing decrease vectors Red arrow pointing downwards staircase falling graph. Concept of decline and decrease. Red arrow showing downward trend, falling graph, negative movement
Free with trial A 3D illustration shows a red arrow graph descending sharply over a series of stacked white coins. The coins are arranged in decreasing height, visually representing a financial decline or loss. The composition is set against a clean white background. Red downward arrow showing decrease illustrations A red arrow graph showing a downward trend over stacked white coins on a white background. A 3D illustration shows a red arrow graph descending sharply over a series of stacked white coins. The coins are arranged in decreasing height, visually representing a financial decline or loss. The composition is set against a clean white background
Free with trial Conceptual illustration showing a stock market crash. Red arrows pointing down against a chart background, symbolizing financial loss, economic downturn, and investment risk. Recession and crisis. Red downward arrow showing decrease illustrations Stock market crash financial crisis recession investment loss economic downturn red arrows downward trend chart. Conceptual illustration showing a stock market crash. Red arrows pointing down against a chart background, symbolizing financial loss, economic downturn, and investment risk. Recession and crisis.
Free with trial A drawn graphic showing the Indian currency INR symbol dropping alongside a downward red arrow, indicating recession and financial loss, isolated on an Alpha transparent background. Red downward arrow showing decrease vectors Indian Rupee depreciation red arrow down stylized sketch Alpha transparent. A drawn graphic showing the Indian currency INR symbol dropping alongside a downward red arrow, indicating recession and financial loss, isolated on an Alpha transparent background.
Free with trial The image shows an easel holding a canvas with a bar chart. The bar chart displays a series of green vertical bars that initially increase in height but then decrease, illustrating a downward trend. A red line with an arrowhead at the end emphasizes the declining trend. Red downward arrow showing decrease illustrations Illustration of a bar chart on an easel showing a downward trend. The image shows an easel holding a canvas with a bar chart. The bar chart displays a series of green vertical bars that initially increase in height but then decrease, illustrating a downward trend. A red line with an arrowhead at the end emphasizes the declining trend
Free with trial Bar graph illustrating financial downturn, with a red arrow pointing down and a dollar sign. Economic recession concept. Red downward arrow showing decrease vectors Financial graph showing decline with dollar sign and red arrow. Bar graph illustrating financial downturn, with a red arrow pointing down and a dollar sign. Economic recession concept
Free with trial A data visualization graph displays the average digs per game metric over a time period from 0 to 100 on the x-axis with the number of digs quantified on the y-axis, featuring an orange line that starts high and gradually decreases to indicate declining performance while remaining slightly above a comparative blue line to show relative improvement, enhanced by a red upward-pointing arrow. Red downward arrow showing decrease illustrations Statistical graph showing average digs per game with orange line trending downward over time period, sports analytics. A data visualization graph displays the average digs per game metric over a time period from 0 to 100 on the x-axis with the number of digs quantified on the y-axis, featuring an orange line that starts high and gradually decreases to indicate declining performance while remaining slightly above a comparative blue line to show relative improvement, enhanced by a red upward-pointing arrow
Free with trial Bankruptcy showing red 3d percentage symbol with downward arrow indicating decrease. Red downward arrow showing decrease illustrations Red 3D Percentage Symbol with Downward Arrow Indicating Decrease
Free with trial A symbolic representation of a stock market crash. A downward trending arrow made of green and red blocks against a blue background. Visualizes financial decline and economic downturn. A powerful image for finance concepts. Red downward arrow showing decrease illustrations Stock market crash concept image showing a downward trend arrow made of blocks on a blue background. A symbolic representation of a stock market crash. A downward trending arrow made of green and red blocks against a blue background. Visualizes financial decline and economic downturn. A powerful image for finance concepts.
Free with trial A 3D rendered image of a red graph trending downwards with a large red arrow pointing down, set against a grey grid surface and a gradient grey background. Red downward arrow showing decrease illustrations A 3d red graph showing a sharp decline in trend on a grey grid surface. A 3D rendered image of a red graph trending downwards with a large red arrow pointing down, set against a grey grid surface and a gradient grey background
Free with trial Business chart showing negative trend with red arrow and descending bars. Red downward arrow showing decrease vectors Business chart showing negative trend with red arrow and descending bars
Free with trial A 3D bar chart rendered in a vibrant pink color illustrates a significant downward trend. The bars decrease in height from left to right, culminating in a very short bar. A bold pink arrow, also in 3D, starts high on the left and sharply descends to the right, mirroring the decline shown by the bars. The entire graphic is isolated on a clean white background. Red downward arrow showing decrease illustrations Pink 3D Bar Chart Showing a Downward Trend with an Arrow graph decline. A 3D bar chart rendered in a vibrant pink color illustrates a significant downward trend. The bars decrease in height from left to right, culminating in a very short bar. A bold pink arrow, also in 3D, starts high on the left and sharply descends to the right, mirroring the decline shown by the bars. The entire graphic is isolated on a clean white background
Free with trial A line graph displaying a downward trend with a red arrow indicating a significant drop, multiple blue lines represent different data sets. Red downward arrow showing decrease illustrations Graph showing a sharp decline in value over time with multiple data lines. A line graph displaying a downward trend with a red arrow indicating a significant drop, multiple blue lines represent different data sets
Free with trial Red arrow going down representing a stock market crash with a broker silhouette watching it. Red downward arrow showing decrease illustrations Stock market crash showing a red arrow going down and a broker watching it. Red arrow going down representing a stock market crash with a broker silhouette watching it
Free with trial Red arrow line graph showing decline with axes on turquoise blue. Recession, crisis and decrease concept. Flat design. EPS 8 vector illustration, no transparency, no gradients. Red downward arrow showing decrease vectors Arrow, graph, decline, recession. Red arrow line graph showing decline with axes on turquoise blue. Recession, crisis and decrease concept. Flat design. EPS 8 vector illustration, no transparency, no gradients
Free with trial Light showing neon orange downward trend arrow with arrowhead on dark reflective surface. Red downward arrow showing decrease illustrations Neon Orange Downward Trend Arrow with Arrowhead on Dark Reflective Surface
Free with trial A symbolic image showing a downward red arrow over stacks of coins representing financial decline or economic recession. Red downward arrow showing decrease illustrations A red arrow points down towards stacks of coins against a blurred gray background. A symbolic image showing a downward red arrow over stacks of coins representing financial decline or economic recession
Free with trial A 3D bar graph showing a declining trend with gradient bars transitioning from yellow to red, accompanied by a downward arrow, all on a white background. Red downward arrow showing decrease illustrations Downward trend graph with gradient bars and arrow isolated on white background. A 3D bar graph showing a declining trend with gradient bars transitioning from yellow to red, accompanied by a downward arrow, all on a white background