Free with trial Freehand drawing of businesswoman atop height in a growth chart facing an economic reset with value losses. Business metaphor for recession, investment, entrepreneurship, risk, decrease, crisis. Sales decrease illustrations Drawn Business Woman Facing Economic Crash. Freehand drawing of businesswoman atop height in a growth chart facing an economic reset with value losses. Business metaphor for recession, investment, entrepreneurship, risk, decrease, crisis
Free with trial Increase, recession, growth, decline, success business flat concept illustration. Graph arrows depict increase, decrease business. Vector template element for infographic, web, presentation, networks. Sales decrease vectors Increase, recession, growth, decline, success business arrows. F. Increase, recession, growth, decline, success business flat concept illustration. Graph arrows depict increase, decrease business. Vector template element for infographic, web, presentation, networks.
Free with trial Bankrupt sales schedule down. Pop art retro vector illustration kitsch vintage. Sales decrease vectors Bankrupt sales schedule down
Free with trial Business cartoon showing a leader stressed out by declining sales while the team remains calm. Sales decrease illustrations Stressed
Free with trial Cartoon of declining sales, businessman CEO is trying to convince the audience that there is an upward trend. Sales decrease illustrations Upward Trend
Free with trial Businesswoman woman panic, bankruptcy financial collapse. sales schedule down. Pop art retro vector illustration vintage kitsch. Sales decrease vectors Businesswoman woman panic, bankruptcy financial collapse. sales schedule down
Free with trial Cool infographics for your business or marketing presentation. These are vector infographs that help you to give a great data visualization examples to your clients or partners. Available in EPS when you download. Sales decrease vectors Infographics - Sales Conversion. Cool infographics for your business or marketing presentation. These are vector infographs that help you to give a great data visualization examples to your clients or partners. Available in EPS when you download.
Free with trial Schedule statistics concept. A team of analysts plans a working week a month, analyzes sales. A man with a tablet, a woman with a pencil stand against backdrop of cityscape. Flat vector illustration. Sales decrease vectors Schedule statistics concept. A team of analysts plans a working week a month, analyzes sales. A man with a tablet, a woman with a
Free with trial Housing market crash with price drop and decline in home sales tiny person concept. Real estate property purchase recession and value collapse vector illustration. Economy recession and drop forecast. Sales decrease vectors Housing market crash with price drop and decline in sales tiny person concept. Housing market crash with price drop and decline in home sales tiny person concept. Real estate property purchase recession and value collapse vector illustration. Economy recession and drop forecast.
Free with trial Revenue sign in gold and glossy letters on a white background and a checkerboard pattern floor for an interesting header for sales and revenue concept with copy space. 3d Rendering - Illustration. Sales decrease illustrations Revenue sign in golden glossy letters. Revenue sign in gold and glossy letters on a white background and a checkerboard pattern floor for an interesting header for sales and revenue concept with copy space. 3d Rendering - Illustration
Free with trial This striking graphic illustrates a significant economic downturn or market crash with a bold red arrow plunging downwards. Rendered by Ai, the image uses simple colors to maximize impact setting the alarming decline against subtle background charts. It effectively communicates concepts of loss decrease and a strong negative trend in business metrics. Sales decrease illustrations Red arrow showing sharp financial market decline. This striking graphic illustrates a significant economic downturn or market crash with a bold red arrow plunging downwards. Rendered by Ai, the image uses simple colors to maximize impact setting the alarming decline against subtle background charts. It effectively communicates concepts of loss decrease and a strong negative trend in business metrics
Free with trial A minimalist black and white icon featuring a lightning bolt symbol within a circle. A jagged arrow, representing a downward trend or decline, originates from the top of the circle and points towards the bottom right. The lightning bolt is positioned to the left of the arrow's path. This graphic symbolizes concepts like energy loss, power decrease, economic downturn, or a negative trend in performance. Its clean design makes it suitable for various digital and print applications. Sales decrease vectors Lightning Bolt Downward Trend Icon. A minimalist black and white icon featuring a lightning bolt symbol within a circle. A jagged arrow, representing a downward trend or decline, originates from the top of the circle and points towards the bottom right. The lightning bolt is positioned to the left of the arrow's path. This graphic symbolizes concepts like energy loss, power decrease, economic downturn, or a negative trend in performance. Its clean design makes it suitable for various digital and print applications.
Free with trial A minimalist, black and white graphic representing a downward trend. A thick, bold arrow points diagonally down and to the right, symbolizing a decline. Below it, a jagged, irregular line graph mirrors this downward trajectory, depicting volatility and a general decrease. This imagery is ideal for illustrating financial losses, market downturns, negative performance, or any concept of falling or decreasing values. Sales decrease vectors Down Trend Arrow and Jagged Line Graph. A minimalist, black and white graphic representing a downward trend. A thick, bold arrow points diagonally down and to the right, symbolizing a decline. Below it, a jagged, irregular line graph mirrors this downward trajectory, depicting volatility and a general decrease. This imagery is ideal for illustrating financial losses, market downturns, negative performance, or any concept of falling or decreasing values.
Free with trial Downward trending line graph with sad face emotion, classic phone icon, and computer monitor. Ideal for business loss, analytics, communication issues, technology, finance, statistics simple flat. Sales decrease vectors Declining Sales Graph with Sad Face, Phone Icon, and Monitor Display. Downward trending line graph with sad face emotion, classic phone icon, and computer monitor. Ideal for business loss, analytics, communication issues, technology, finance, statistics simple flat
Free with trial 3D Illustration decrease wood brick chart round. Sales decrease illustrations Increase wood brick chart round 2. 3D Illustration decrease wood brick chart round
Free with trial Vector set of business illustrations with characters. Sharing economy. Failed business sales. Human resourse, job hunting. Time management. Liquid, fluid background. Sales decrease vectors Vector set of business illustrations with characters. Sharing economy. Failed business sales. Human resourse, job
Free with trial Discounts and Sales Icons Set. Collection of simple linear web icons such Discount Gift, Discount Coupons, Sales, Black friday, Discount Search, Coupon Presenting and others. Editable vector stroke. Sales decrease vectors Discounts and Sales Icons Set. Editable vector stroke. Discounts and Sales Icons Set. Collection of simple linear web icons such Discount Gift, Discount Coupons, Sales, Black friday, Discount Search, Coupon Presenting and others. Editable vector stroke.
Free with trial Circular percentage icon indicating a decrease or reduction, useful for financial concepts like interest rate changes, sales, discounts, and data analysis in business and economics. Sales decrease vectors Decreasing percentage rate circular icon illustration. Circular percentage icon indicating a decrease or reduction, useful for financial concepts like interest rate changes, sales, discounts, and data analysis in business and economics
Free with trial Histogram chart customizable to explain the decrease of your business Arrow Down TO KNOW: File include: EPS10 (opened with all program) fully editable with layers. Easy to custom. Sales decrease vectors Histogram Graph like a waterfall with Red Down. Histogram chart customizable to explain the decrease of your business Arrow Down TO KNOW: File include: EPS10 (opened with all program) fully editable with layers. Easy to custom.
Free with trial Shopping decline concept. Shopping cart with a sad face and downward trend bar chart challenges in retail and declining sales. For business, economics, retail trends, marketing analysis. Sales decrease vectors Shopping Cart Decline Concept with Sad Face and Falling Bar Chart ation. Shopping decline concept. Shopping cart with a sad face and downward trend bar chart challenges in retail and declining sales. For business, economics, retail trends, marketing analysis
Free with trial Illustration of a descending bar graph with an arrow signifying decline. Percentage symbol indicates decrease. Minimalist flat style, on black background. Sales decrease vectors Declining bar graph with percentage drop indicator icon. Illustration of a descending bar graph with an arrow signifying decline. Percentage symbol indicates decrease. Minimalist flat style, on black background.
Free with trial Increase, recession, growth, decline, success business flat concept illustration. Graph arrows depict steps of increase and decrease business. Vector elements for infographic, presentation, networks. Sales decrease vectors Increase, recession, growth, decline, step business arrows. Flat. Increase, recession, growth, decline, success business flat concept illustration. Graph arrows depict steps of increase and decrease business. Vector elements for infographic, presentation, networks.
Free with trial A graph showing negative growth with a big green arrow crashing through a floor isolated on a white background. Sales decrease illustrations Sales Through The Floor Graph. A graph showing negative growth with a big green arrow crashing through a floor isolated on a white background
Free with trial The graph displays two lines, one green and one red. The green line is ascending, indicating growth or progress, while the red line is descending, suggesting a decline or decrease. Sales decrease illustrations A graph with a green line and a red line. The graph displays two lines, one green and one red. The green line is ascending, indicating growth or progress, while the red line is descending, suggesting a decline or decrease
Free with trial Vectors stock of declining business chart with hot balloon, failure business concept. Sales decrease vectors Loss Business Sales Chart Declining With Balloon, Bankrupt. Vectors stock of declining business chart with hot balloon, failure business concept
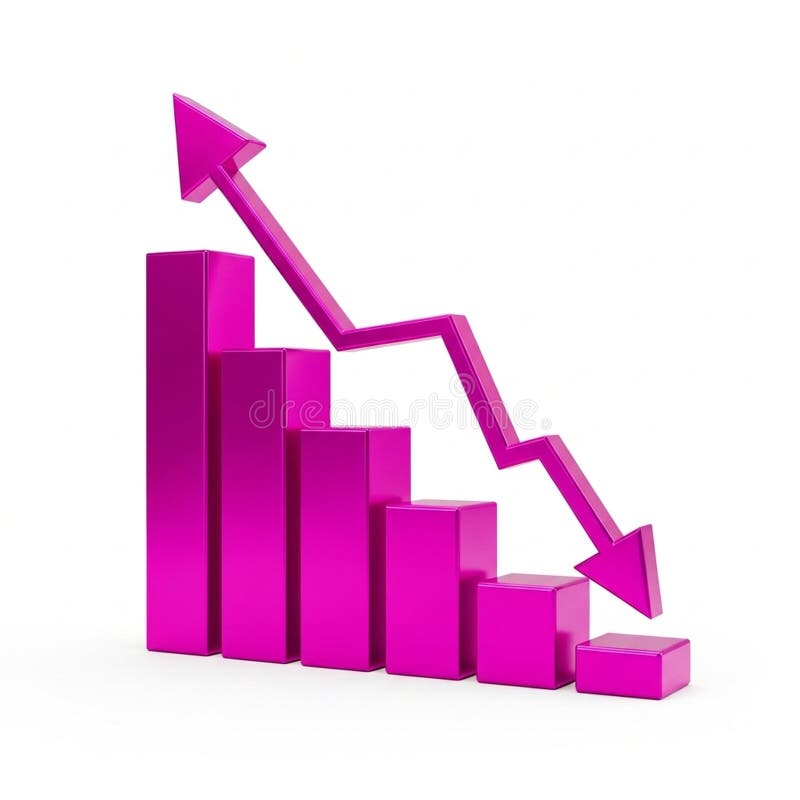
Free with trial A vibrant pink 3D bar chart illustrates financial data with a prominent downward-trending arrow superimposed. The bars decrease in height from left to right, signifying a decline. An upward-pointing arrow is positioned at the top left, indicating a contrasting upward trend. The graphic is isolated on a white background, making it suitable for presentations on financial performance, market trends,. Sales decrease illustrations 3D Pink Bar Chart with Downward Trend Arrow and Upward Trend Arrow graph statistics. A vibrant pink 3D bar chart illustrates financial data with a prominent downward-trending arrow superimposed. The bars decrease in height from left to right, signifying a decline. An upward-pointing arrow is positioned at the top left, indicating a contrasting upward trend. The graphic is isolated on a white background, making it suitable for presentations on financial performance, market trends,
Free with trial A 3D rendered bar chart illustrating a significant downward trend. Three blue, rounded bars are displayed on a clean white background with subtle grid lines. A prominent, bold red arrow sharply descends across the bars, clearly indicating a decline, decrease, or negative progression. This graphic is ideal for representing financial losses, market downturns, business challenges, economic recession, or any statistical data showing a negative trend. It conveys concepts of risk, failure, and reduction in a clear, impactful visual manner for presentations, reports, and analytical content. Sales decrease vectors Downward Trend Bar Chart with Red Arrow. A 3D rendered bar chart illustrating a significant downward trend. Three blue, rounded bars are displayed on a clean white background with subtle grid lines. A prominent, bold red arrow sharply descends across the bars, clearly indicating a decline, decrease, or negative progression. This graphic is ideal for representing financial losses, market downturns, business challenges, economic recession, or any statistical data showing a negative trend. It conveys concepts of risk, failure, and reduction in a clear, impactful visual manner for presentations, reports, and analytical content.
Free with trial A bold, three-dimensional red percentage symbol (%) is depicted against a clean white background. The symbol is stylized with a downward-pointing arrow integrated into its design, suggesting a decrease or reduction. This graphic is ideal for illustrating concepts related to discounts, sales, negative growth, financial losses, or declining trends in various business and economic contexts. Sales decrease vectors Red Percentage Symbol with Downward Arrow. A bold, three-dimensional red percentage symbol (%) is depicted against a clean white background. The symbol is stylized with a downward-pointing arrow integrated into its design, suggesting a decrease or reduction. This graphic is ideal for illustrating concepts related to discounts, sales, negative growth, financial losses, or declining trends in various business and economic contexts.
Free with trial A visual representation of a downward trend, where colorful stacks of translucent tokens decrease in height. Sales decrease illustrations Financial Decline Chart with Colored Tokens. A visual representation of a downward trend, where colorful stacks of translucent tokens decrease in height
Free with trial A 3D bar chart rendered in a vibrant pink color illustrates a significant downward trend. The bars decrease in height from left to right, culminating in a very short bar. A bold pink arrow, also in 3D, starts high on the left and sharply descends to the right, mirroring the decline shown by the bars. The entire graphic is isolated on a clean white background. Sales decrease illustrations Pink 3D Bar Chart Showing a Downward Trend with an Arrow graph decline. A 3D bar chart rendered in a vibrant pink color illustrates a significant downward trend. The bars decrease in height from left to right, culminating in a very short bar. A bold pink arrow, also in 3D, starts high on the left and sharply descends to the right, mirroring the decline shown by the bars. The entire graphic is isolated on a clean white background
Free with trial A clean, minimalist 3D bar chart made of translucent blue blocks illustrates a steady decline. This powerful visual represents concepts like economic downturn, financial recession, reduced sales, or negative performance data, making it ideal for business reports and presentations. Sales decrease illustrations Economic Downturn Concept with Blue Bar Graph. A clean, minimalist 3D bar chart made of translucent blue blocks illustrates a steady decline. This powerful visual represents concepts like economic downturn, financial recession, reduced sales, or negative performance data, making it ideal for business reports and presentations
Free with trial Red arrow indicating percent decrease sales reduction important finance concept. Sales decrease illustrations Percentage reduction symbol arrow pointing down. Red arrow indicating percent decrease sales reduction important finance concept
Free with trial A vibrant red 80% sign, perfect for sales and promotions, stands out against a clean white background, ideal for business and marketing. Sales decrease illustrations Eye-catching 80% off sign in bold red, ideal for promotional use and sales announcements. A vibrant red 80% sign, perfect for sales and promotions, stands out against a clean white background, ideal for business and marketing
Free with trial A 3D bar chart rendered in a vibrant pink color illustrates a downward trend. The bars decrease in height from left to right, representing a decline in data or performance. A thick pink arrow with a sharp point follows the descending path of the bars, reinforcing the concept of a decrease. The chart is presented in isolation against a clean white background, making the visual elements stand out. Sales decrease illustrations Pink Bar Chart with a Downward Trending Arrow Symbolizing Decline graph magenta. A 3D bar chart rendered in a vibrant pink color illustrates a downward trend. The bars decrease in height from left to right, representing a decline in data or performance. A thick pink arrow with a sharp point follows the descending path of the bars, reinforcing the concept of a decrease. The chart is presented in isolation against a clean white background, making the visual elements stand out
Free with trial 3d renderer illustration. White Business people with red arrow falling. Decrease concept. white background. Sales decrease illustrations 3d White people with red arrow falling. Decrease concept. 3d renderer illustration. White Business people with red arrow falling. Decrease concept. white background
Free with trial 3d renderer illustration. White Business people with red arrow falling. Decrease concept. white background. Sales decrease illustrations 3d White people with red arrow falling. Decrease concept. 3d renderer illustration. White Business people with red arrow falling. Decrease concept. white background
Free with trial A hand-drawn bar chart shows a downward trend with a line graph indicating a significant decrease in value over time. Sales decrease vectors Downturn graph illustrating declining trends and financial loss. A hand-drawn bar chart shows a downward trend with a line graph indicating a significant decrease in value over time
Free with trial A stylized, flat design illustration of a bar chart depicting a downward trend. The bars are colored red, yellow, and blue, arranged in decreasing height from left to right. A prominent red arrow points downwards across the chart, emphasizing the decline. The graphic is set against a clean white background, making it ideal for presentations, reports, and financial concepts related to loss, decrease, or negative performance. Sales decrease illustrations Declining Bar Chart with Downward Arrow. A stylized, flat design illustration of a bar chart depicting a downward trend. The bars are colored red, yellow, and blue, arranged in decreasing height from left to right. A prominent red arrow points downwards across the chart, emphasizing the decline. The graphic is set against a clean white background, making it ideal for presentations, reports, and financial concepts related to loss, decrease, or negative performance.
Free with trial This image presents a detailed analysis of business performance metrics, including market share, quarterly sales, and key performance indicators (KPIs. Sales decrease illustrations Comprehensive business performance metrics and growth analysis. This image presents a detailed analysis of business performance metrics, including market share, quarterly sales, and key performance indicators (KPIs
Free with trial Illustration of a business man desperately trying to raise sales, conceptual corporate graphic. Sales decrease vectors Raising sales. Illustration of a business man desperately trying to raise sales, conceptual corporate graphic
Free with trial Negative sales chart and falling business man, conceptual corporate graphic. Sales decrease vectors Falling sales chart. Negative sales chart and falling business man, conceptual corporate graphic
Free with trial Housing market crash with price drop and decline in home sales tiny person concept. Real estate property purchase recession and value collapse vector illustration. Economy recession and drop forecast. Sales decrease vectors Housing market crash with price drop and decline in sales tiny person concept. Housing market crash with price drop and decline in home sales tiny person concept. Real estate property purchase recession and value collapse vector illustration. Economy recession and drop forecast.
Free with trial This image depicts a bar graph with a clear downward trend. Blue bars decrease in height from left to right, representing a decline in value. A bold red arrow overlays the bars, visually emphasizing the negative trend. A blue line also shows a downward trend. The image conveys a sense of loss, recession, or negative performance and is suitable for illustrating financial or economic concepts. Sales decrease illustrations Declining Bar Graph with Downward Trend Lines. This image depicts a bar graph with a clear downward trend. Blue bars decrease in height from left to right, representing a decline in value. A bold red arrow overlays the bars, visually emphasizing the negative trend. A blue line also shows a downward trend. The image conveys a sense of loss, recession, or negative performance and is suitable for illustrating financial or economic concepts.
Free with trial Vector illustration showing oil price decrease with dollar sign drop barrel fuel pump and declining graph representing economic impact and market trends in black and white style calm. Generative AI. Sales decrease vectors Oil price drop concept with dollar sign barrel pump and graph vector illustration. Vector illustration showing oil price decrease with dollar sign drop barrel fuel pump and declining graph representing economic impact and market trends in black and white style calm. Generative AI
Free with trial Revenue sign in gold and glossy letters on a white background and a checkerboard pattern floor for an interesting header for sales and revenue concept with copy space. 3d Rendering - Illustration. Sales decrease illustrations Revenue sign in gold and glossy letters
Free with trial Recession, growth, decline, reduction, downward, success of business. Flat concept illustration. Pencil graph arrows depict increase, decrease business. Vector infographic for web, presentation. Sales decrease vectors Increase, recession, growth, decline, reduction, success business. Pencil arrow graphs. Recession, growth, decline, reduction, downward, success of business. Flat concept illustration. Pencil graph arrows depict increase, decrease business. Vector infographic for web, presentation.
Free with trial A collection of nine simple black icons on a white background depicting concepts of decrease loss and downward trends using graphs charts and arrows. Sales decrease vectors Set of black decline icons showing business failure and data reduction. A collection of nine simple black icons on a white background depicting concepts of decrease loss and downward trends using graphs charts and arrows
Free with trial A collection of nine simple, solid black icons on a white background, illustrating concepts of decline, loss, and negative trends using various charts like bar graphs, line graphs, and pie charts with downward pointing arrows. Sales decrease vectors Set of black icons representing financial decrease and downward trends. A collection of nine simple, solid black icons on a white background, illustrating concepts of decline, loss, and negative trends using various charts like bar graphs, line graphs, and pie charts with downward pointing arrows
Free with trial Black and white icon of a bar graph with short bars and a downward pointing arrow. Sales decrease illustrations Bar graph with short bars and a downward pointing arrow bar chart decrease. Black and white icon of a bar graph with short bars and a downward pointing arrow
Free with trial A vibrant, glossy 3D red arrow points directly downwards, rendered with smooth, rounded edges. The clear, transparent background makes this versatile graphic ideal for various design applications. It effectively symbolizes concepts like decrease, download, decline, navigation, or drawing attention to content below. Perfect for web interfaces, mobile apps, presentations, infographics, and marketing materials requiring a clear directional indicator or a visual representation of downward trends. Sales decrease illustrations 3D Red Down Arrow Icon on Transparent Background. A vibrant, glossy 3D red arrow points directly downwards, rendered with smooth, rounded edges. The clear, transparent background makes this versatile graphic ideal for various design applications. It effectively symbolizes concepts like decrease, download, decline, navigation, or drawing attention to content below. Perfect for web interfaces, mobile apps, presentations, infographics, and marketing materials requiring a clear directional indicator or a visual representation of downward trends.
Free with trial Black and white icon of a bar graph showing a downward trend with an arrow pointing down. Sales decrease illustrations Downward trending bar graph with arrow indicating decrease bar chart decline. Black and white icon of a bar graph showing a downward trend with an arrow pointing down
Free with trial Cat businessman shows on the chart the decrease in sales. Sales decrease vectors Cat businessman
Free with trial A red downward arrow and a red bar chart showing a decline are presented on a white background. Sales decrease illustrations Red Downward Arrow and Bar Chart Symbolizing Decrease and Decline Keywords: decrease, decline, down, arrow, bar. A red downward arrow and a red bar chart showing a decline are presented on a white background
Free with trial Revenue sign in gold and glossy letters on a white background and a brick pattern floor for an interesting header for sales and revenue concept with copy space. 3d Rendering - Illustration. Sales decrease illustrations Revenue sign in gold and glossy letters
Free with trial Up and down sign with green and black arrows in flat style showing movement direction and sales change. Vector illustration of a sales bar chart icon used as an elevator symbol or universal pictogram. Sales decrease vectors Up and down sign with green and black arrows in flat style showing movement direction
Free with trial A yellow line graph shows a steep decline against a dark background, potentially representing a downturn in sales or investments. Sales decrease illustrations Declining Graph on Black Background. A yellow line graph shows a steep decline against a dark background, potentially representing a downturn in sales or investments
Free with trial Trading chart showing numbers increase and decrease on different globe areas. Financial market, investment, economy analyzing concept. Sales decrease illustrations Trading chart showing numbers increase and decrease on globe areas. Trading chart showing numbers increase and decrease on different globe areas. Financial market, investment, economy analyzing concept
Free with trial A bold red arrow with a zigzag pattern points downwards, symbolizing a negative trend, loss, or decrease. Sales decrease vectors Red arrow indicating downward trend or decline. A bold red arrow with a zigzag pattern points downwards, symbolizing a negative trend, loss, or decrease
Free with trial A bright yellow arrow curves downwards indicating a downward trend, decrease, or decline. Ideal for presentations on finance, market analysis, or performance changes. Sales decrease illustrations Yellow arrow pointing downward showing a decline or falling trend. A bright yellow arrow curves downwards indicating a downward trend, decrease, or decline. Ideal for presentations on finance, market analysis, or performance changes
Free with trial Three identical red arrows, each featuring a white percentage symbol (%) prominently displayed, are shown pointing downwards against a black background. The arrows have a slightly rounded, three-dimensional appearance, suggesting a concept of decrease or reduction. This visual could represent sales, discounts, or declining economic indicators. Sales decrease illustrations Three red arrows pointing down with percentage signs. Three identical red arrows, each featuring a white percentage symbol (%) prominently displayed, are shown pointing downwards against a black background. The arrows have a slightly rounded, three-dimensional appearance, suggesting a concept of decrease or reduction. This visual could represent sales, discounts, or declining economic indicators
Free with trial The image features a bold red downward-pointing arrow with a white zero percent symbol ('0%') centered inside it. This design is often used to indicate a zero percent change or a complete reduction, typically in contexts such as sales, interest rates, or financial metrics. Sales decrease illustrations Red downward arrow with zero percent symbol. The image features a bold red downward-pointing arrow with a white zero percent symbol ('0%') centered inside it. The image features a bold red downward-pointing arrow with a white zero percent symbol ('0%') centered inside it. This design is often used to indicate a zero percent change or a complete reduction, typically in contexts such as sales, interest rates, or financial metrics
Free with trial A stark red arrow plunges downwards into an empty shopping cart, symbolizing a decline in sales or consumer spending. Sales decrease illustrations Red arrow points down into empty shopping cart symbolizing decline. A stark red arrow plunges downwards into an empty shopping cart, symbolizing a decline in sales or consumer spending
Free with trial Germany Stock Exchange market crisis red market price down chart fall / Stock analysis or forex charts graph Business and finance money crisis red negative drop in sales economic fall. Sales decrease illustrations Germany Stock Exchange market crisis red market price down chart fall Business and finance money crisis red negative drop in sales. Germany Stock Exchange market crisis red market price down chart fall / Stock analysis or forex charts graph Business and finance money crisis red negative drop in sales economic fall
Free with trial A vibrant, flat-design illustration depicts a bar graph with a downward-trending arrow, suggesting a decline in data. The graph features bars in red, yellow, green, and blue, set against a clean white background. The composition is simple, yet conveys a clear message of financial or performance decrease. Sales decrease illustrations Colorful Bar Graph with Declining Trend and Arrows, Business Concept. A vibrant, flat-design illustration depicts a bar graph with a downward-trending arrow, suggesting a decline in data. The graph features bars in red, yellow, green, and blue, set against a clean white background. The composition is simple, yet conveys a clear message of financial or performance decrease
Free with trial A graphic representing a 50 percent reduction or decline, depicted by a red arrow and percentage. Sales decrease illustrations Red downward arrow indicating 50 percent decrease within a curved arc. A graphic representing a 50 percent reduction or decline, depicted by a red arrow and percentage
Free with trial Falling arrow on Euro textured sales graphic. 3D illustration. Sales decrease illustrations Falling arrow on Euro textured sales graphic. 3D illustration
Free with trial Colorful bar chart illustrating a gradual decrease against a transparent background, highlighting a decline in data and signaling a negative financial trend or recession. Sales decrease vectors Bar chart gradually decreasing with transparent background. Colorful bar chart illustrating a gradual decrease against a transparent background, highlighting a decline in data and signaling a negative financial trend or recession
Free with trial Illustration showing declining sales after initial product launch and strategic recovery using drip promotions, seasonal marketing refreshes, and bundle offers. Sales decrease illustrations . illustration showing declining sales after initial product launch and strategic recovery using drip promotions, seasonal marketing refreshes, and bundle offers.
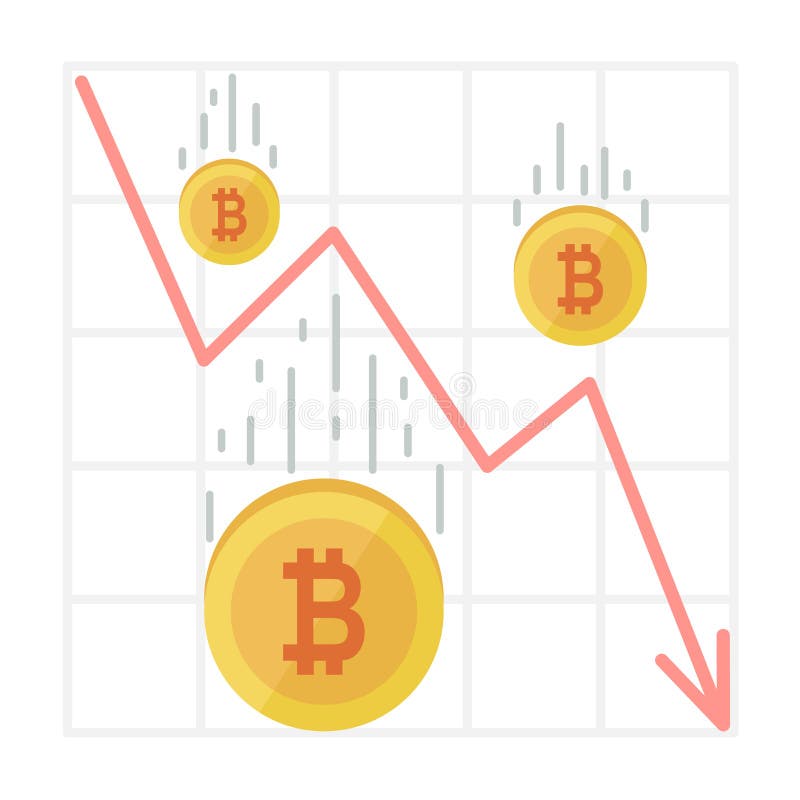
Free with trial Bitcoin Fall Chart. Cryptocurrency decline graph in flat style. Web money price crash, red sales arrow down vector Illustration. Sales decrease vectors Bitcoin Fall Chart. Cryptocurrency decline graph in flat style. Web money price crash
Free with trial Revenue sign in gold and glossy letters on a white background and a brick pattern floor for an interesting header for sales and revenue concept with copy space. 3d Rendering - Illustration. Sales decrease illustrations Revenue sign in gold and glossy letters
Free with trial Product decline 3D icon representing a decrease in sales and demand isolated on white background. Sales decrease illustrations Product decline 3D icon illustration. Product decline 3D icon representing a decrease in sales and demand isolated on white background
Free with trial A red $10 price tag sticker displays a promotional offer. This image is perfect for retail sales and discounted product pricing, indicating a special deal for consumers CREATED AI. Sales decrease illustrations Red $10 Price Tag Sticker Displaying Promotional Offer for Retail Sales and Discounted Product Pricing. A red $10 price tag sticker displays a promotional offer. This image is perfect for retail sales and discounted product pricing, indicating a special deal for consumers CREATED AI
Free with trial This image shows a colorful 3D bar graph representing growth or progress. The bars increase in height, then decrease slightly before another sharp increase, indicating fluctuations in data. The wooden background adds a rustic and visually appealing contrast. Sales decrease illustrations Colorful Bar Graph on Wooden Background. This image shows a colorful 3D bar graph representing growth or progress. The bars increase in height, then decrease slightly before another sharp increase, indicating fluctuations in data. The wooden background adds a rustic and visually appealing contrast.
Free with trial This image shows a downward-trending red arrow graph, generated by AI, illustrating a significant decline. The visual representation is clear and effective in communicating a negative trend, potentially in stock prices, sales figures, or other quantifiable data. Sales decrease illustrations Downward Trending Graph. This image shows a downward-trending red arrow graph, generated by AI, illustrating a significant decline. The visual representation is clear and effective in communicating a negative trend, potentially in stock prices, sales figures, or other quantifiable data.
Free with trial 3d renderer illustration. White Business people with red arrow falling. Decrease concept. white background. Sales decrease illustrations 3d White people with red arrow falling. Decrease concept. 3d renderer illustration. White Business people with red arrow falling. Decrease concept. white background
Free with trial A vibrant red, three-dimensional zigzag arrow sharply points downwards and to the right, set against a transparent background. This striking graphic effectively symbolizes decline, loss, and negative trends across various sectors. It is ideal for illustrating financial downturns, market crashes, economic recessions, falling stock prices, or any situation depicting a decrease in performance. Perfect for business presentations, financial reports, infographics, and news articles requiring a clear visual representation of a downward trajectory or crisis. Sales decrease illustrations Red Downward Zigzag Arrow on Transparent Background. A vibrant red, three-dimensional zigzag arrow sharply points downwards and to the right, set against a transparent background. This striking graphic effectively symbolizes decline, loss, and negative trends across various sectors. It is ideal for illustrating financial downturns, market crashes, economic recessions, falling stock prices, or any situation depicting a decrease in performance. Perfect for business presentations, financial reports, infographics, and news articles requiring a clear visual representation of a downward trajectory or crisis.
Free with trial Bar chart icon with downward arrow showing declining business performance, financial loss, recession, negative trend, market crash analytics and falling sales report. Sales decrease vectors Bar chart icon with downward arrow showing declining business performance, financial
Free with trial Continuous one single line drawing of young manager giving presentation about decreased product sales but remained stable. Brainstorming over project concept. Vector illustration on white background. Sales decrease vectors Continuous one single line drawing of young manager giving presentation about decreased product sales but remained stable.
Free with trial Trend disintegrating revenue chart illustration decrease loss, downturn metrics, performance data trend disintegrating revenue chart. Sales decrease illustrations Trend disintegrating revenue chart