Free with trial A vibrant bar graph graphic with a gradient of colors, representing data visualization and statistical analysis. The bars vary in height, indicating different values or categories. The image is set against a clean white background, making it suitable for a variety of applications, including presentations, reports, and website design. The color palette adds visual interest and can be used to represent trends, comparisons, or performance metrics. Sales decrease illustrations Colorful Bar Graph Illustrating Data and Statistics. A vibrant bar graph graphic with a gradient of colors, representing data visualization and statistical analysis. The bars vary in height, indicating different values or categories. The image is set against a clean white background, making it suitable for a variety of applications, including presentations, reports, and website design. The color palette adds visual interest and can be used to represent trends, comparisons, or performance metrics.
Free with trial Colorful bar graph chart depicted with crayons. Set against a rustic wooden background, implying decline or financial loss. Perfect for business, economics, and data visualization concepts. Sales decrease illustrations Falling Bar Graph with Crayons Good Resolution Stock Photo. Colorful bar graph chart depicted with crayons. Set against a rustic wooden background, implying decline or financial loss. Perfect for business, economics, and data visualization concepts.
Free with trial A downward trending graph chart isolated on a white background, representing financial loss, downturn, or market analysis. Sales decrease illustrations Downward graph chart on white background. A downward trending graph chart isolated on a white background, representing financial loss, downturn, or market analysis
Free with trial Graph of Fixed cost, variable costs, mixed cost to compare vector. Sales decrease vectors Graph of Fixed cost, variable costs, mixed cost to compare
Free with trial A stark red downward arrow dominates this compelling graphic, set against a pristine white background. This impactful 3D render visualizes a decreasing trend, effectively representing economic downturns and financial losses. The image's concise nature makes it ideal for illustrating negative market performance, business losses, or budget reduction. Use this conceptual illustration to depict. Sales decrease illustrations Declining trend represented by a red arrow on a white background depicting economic downturn or financial losses. A stark red downward arrow dominates this compelling graphic, set against a pristine white background. This impactful 3D render visualizes a decreasing trend, effectively representing economic downturns and financial losses. The image's concise nature makes it ideal for illustrating negative market performance, business losses, or budget reduction. Use this conceptual illustration to depict
Free with trial A 3D rendered icon depicting a downward trend graph is presented on a black circular background with a polished gold rim. The graph features golden bars of decreasing height and a golden line graph with a downward-pointing arrow, clearly illustrating a decline. The entire icon is isolated on a white background, emphasizing its metallic gold and black elements. Sales decrease illustrations Gold Downward Trend Graph Icon on Black Circle with Gold Rim on White Background chart. A 3D rendered icon depicting a downward trend graph is presented on a black circular background with a polished gold rim. The graph features golden bars of decreasing height and a golden line graph with a downward-pointing arrow, clearly illustrating a decline. The entire icon is isolated on a white background, emphasizing its metallic gold and black elements
Free with trial This image displays two distinct charts illustrating annual revenue performance over quarters. The left chart features a line graph with shaded areas, showing trends and cumulative revenue. The right chart presents a bar graph with stacked segments, offering a clear comparison of revenue contributions across different quarters. Both charts use a clean, modern design with blue, green, and gray color palettes, suitable for business presentations, financial reports, and data visualization. Sales decrease illustrations Annual Revenue Performance Charts: Line and Bar Graphs. This image displays two distinct charts illustrating annual revenue performance over quarters. The left chart features a line graph with shaded areas, showing trends and cumulative revenue. The right chart presents a bar graph with stacked segments, offering a clear comparison of revenue contributions across different quarters. Both charts use a clean, modern design with blue, green, and gray color palettes, suitable for business presentations, financial reports, and data visualization.
Free with trial Depiction of a fluctuating red market graph displayed over a dark digital backdrop with house icons. The visualization suggests property value changes over time The image is. Sales decrease illustrations Housing market graph showing an upward trending property value chart. Depiction of a fluctuating red market graph displayed over a dark digital backdrop with house icons. The visualization suggests property value changes over time The image is
Free with trial A 3D bar chart illustrates a significant downward trend in data, emphasized by a bold red arrow pointing downwards. Sales decrease illustrations Bar chart showing declining trend with downward arrow. A 3D bar chart illustrates a significant downward trend in data, emphasized by a bold red arrow pointing downwards
Free with trial A colorful, hand-drawn illustration depicting a large percentage symbol surrounded by various financial and statistical icons. This doodle-style artwork includes bar graphs, pie charts, stacks of coins, dollar signs, and arrows indicating growth and decline. The sketch effectively visualizes concepts like interest rates, economic trends, business analytics, investment returns, and market data. Isolated on a white background, this versatile image is perfect for presentations, infographics, financial reports, and educational materials related to business, finance, and statistics. Sales decrease illustrations Hand Drawn Finance and Percentage Concept Illustration. A colorful, hand-drawn illustration depicting a large percentage symbol surrounded by various financial and statistical icons. This doodle-style artwork includes bar graphs, pie charts, stacks of coins, dollar signs, and arrows indicating growth and decline. The sketch effectively visualizes concepts like interest rates, economic trends, business analytics, investment returns, and market data. Isolated on a white background, this versatile image is perfect for presentations, infographics, financial reports, and educational materials related to business, finance, and statistics.
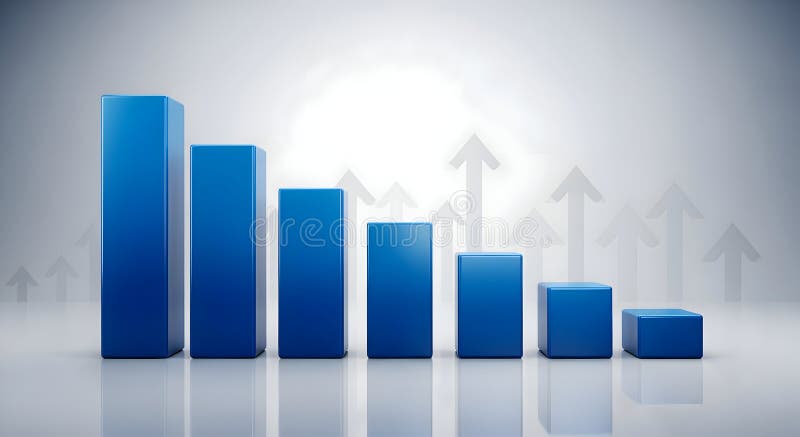
Free with trial A 3D render of a blue bar chart displaying a downward trend, with bars decreasing in height from left to right. The background features a subtle pattern of translucent upward-pointing arrows, suggesting growth or recovery despite the current decline. The scene is set against a clean, gradient gray backdrop with reflections, creating a modern and professional aesthetic. This image is ideal for representing financial downturns, market analysis, economic challenges, or the concept of overcoming obstacles. Sales decrease illustrations Declining Blue Bar Chart with Upward Arrows Background. A 3D render of a blue bar chart displaying a downward trend, with bars decreasing in height from left to right. The background features a subtle pattern of translucent upward-pointing arrows, suggesting growth or recovery despite the current decline. The scene is set against a clean, gradient gray backdrop with reflections, creating a modern and professional aesthetic. This image is ideal for representing financial downturns, market analysis, economic challenges, or the concept of overcoming obstacles.
Free with trial A red bar chart illustrates a significant decline with a bold red arrow pointing downwards, symbolizing financial loss, market downturn, or negative growth. Sales decrease illustrations Red bar chart showing downward trend and falling arrow. A red bar chart illustrates a significant decline with a bold red arrow pointing downwards, symbolizing financial loss, market downturn, or negative growth
Free with trial Declining Bar Chart with Downward Trend Arrow Illustration. Sales decrease vectors Declining Bar Chart with Downward Trend Arrow Illustration
Free with trial 3d bar graph illustrating financial growth with upward green arrow and downward red arrows indicating trends. Sales decrease vectors Bar graph rising with arrows showing increase decrease. 3d bar graph illustrating financial growth with upward green arrow and downward red arrows indicating trends
Free with trial Laptop displaying a bar chart indicating growth and analysis ,Generative ai. Sales decrease illustrations Laptop with bar chart, visualizing growth, analysis, and business trends. Laptop displaying a bar chart indicating growth and analysis ,Generative ai
Free with trial A sleek, 3D rendered bar chart made of translucent blue glass illustrates a significant downward trend. The descending steps represent a decline in profits, a market downturn, or negative business results, symbolizing financial challenges and the need for strategic re-evaluation. The clean, minimalist design focuses attention on the datas story of loss and regression. Sales decrease illustrations Blue Glass Bar Chart Showing a Downward Trend. A sleek, 3D rendered bar chart made of translucent blue glass illustrates a significant downward trend. The descending steps represent a decline in profits, a market downturn, or negative business results, symbolizing financial challenges and the need for strategic re-evaluation. The clean, minimalist design focuses attention on the datas story of loss and regression
Free with trial A minimalist black and white icon representing a bar graph. The graph features several vertical bars of varying heights, arranged in a sequence that initially ascends to a peak and then descends. This versatile graphic symbolizes data, statistics, growth, decline, trends, and analysis. Its clean design makes it suitable for presentations, reports, websites, and applications related to finance, business, technology, and research. Sales decrease vectors Black Bar Graph Icon with Ascending and Descending Bars. A minimalist black and white icon representing a bar graph. The graph features several vertical bars of varying heights, arranged in a sequence that initially ascends to a peak and then descends. This versatile graphic symbolizes data, statistics, growth, decline, trends, and analysis. Its clean design makes it suitable for presentations, reports, websites, and applications related to finance, business, technology, and research.
Free with trial Red arrows indicate business growth and decline, along with percentage symbols for financial data and market trends. Sales decrease vectors Up and down arrows with percentage symbol business icon. Red arrows indicate business growth and decline, along with percentage symbols for financial data and market trends
Free with trial A dynamic 3D visualization of financial data, featuring an upward trending blue arrow graph, a series of white and blue bar graphs, and two pie charts. The composition is set against a dark blue, grid-like background, symbolizing data analysis, business growth, and financial success. This image is ideal for presentations, reports, and websites related to finance, economics, and market trends. Sales decrease illustrations 3D Financial Growth Chart with Pie Charts and Bar Graph. A dynamic 3D visualization of financial data, featuring an upward trending blue arrow graph, a series of white and blue bar graphs, and two pie charts. The composition is set against a dark blue, grid-like background, symbolizing data analysis, business growth, and financial success. This image is ideal for presentations, reports, and websites related to finance, economics, and market trends.
Free with trial A shiny 3D red arrow with a white percent symbol dramatically plunges downwards, symbolizing discounts, sales, falling prices, or economic downturn. Perfect for financial or retail promotions. Sales decrease vectors 3d red arrow with percent symbol pointing down indicating price reduction or sale isolated on white background. A shiny 3D red arrow with a white percent symbol dramatically plunges downwards, symbolizing discounts, sales, falling prices, or economic downturn. Perfect for financial or retail promotions
Free with trial This is an isometric 3D illustration depicting a dynamic data visualization. It features a combination of bar charts and a line graph, showcasing rising trends and fluctuating data points. The color palette includes shades of blue, teal, and coral, creating a modern and professional aesthetic. This graphic is ideal for representing financial reports, business analytics, market trends, growth, and performance metrics in a visually engaging and easy-to-understand format. Sales decrease illustrations Isometric 3D Bar and Line Graph with Data Visualization. This is an isometric 3D illustration depicting a dynamic data visualization. It features a combination. This is an isometric 3D illustration depicting a dynamic data visualization. It features a combination of bar charts and a line graph, showcasing rising trends and fluctuating data points. The color palette includes shades of blue, teal, and coral, creating a modern and professional aesthetic. This graphic is ideal for representing financial reports, business analytics, market trends, growth, and performance metrics in a visually engaging and easy-to-understand format.
Free with trial A graphic illustration of a downward trend represented by a bar chart and a descending arrow within a black-rimmed circle. The chart consists of three black bars of decreasing height, with a thick black arrow pointing diagonally downwards from the shortest bar. The icon is set against a plain white background. Sales decrease illustrations Black Downward Trend Graph Icon with Arrow in Circle on White Background chart data. A graphic illustration of a downward trend represented by a bar chart and a descending arrow within a black-rimmed circle. The chart consists of three black bars of decreasing height, with a thick black arrow pointing diagonally downwards from the shortest bar. The icon is set against a plain white background
Free with trial Red arrow for decline, green for progress. Stock market trends, statistics, and analytics. Falling and rising concepts, comparison. Sales decrease vectors Red and green downward arrows showing fall and growth isolated. Red arrow for decline, green for progress. Stock market trends, statistics, and analytics. Falling and rising concepts, comparison
Free with trial A 3d bar graph showing a downward trend with a red arrow indicating decline, representing business loss. Sales decrease vectors Bar chart with red arrow pointing down on white background. A 3d bar graph showing a downward trend with a red arrow indicating decline, representing business loss
Free with trial A simple line drawing depicts a person presenting a declining bar chart on a whiteboard, viewed through a magnifying. Sales decrease illustrations Decline Analysis Magnifying Glass on Falling Chart, Business. A simple line drawing depicts a person presenting a declining bar chart on a whiteboard, viewed through a magnifying.
Free with trial A bar graph with a descending arrow, symbolizing economic decline and financial downturn, set against a blue background. Sales decrease illustrations Downward Trend - A Visual Representation of Economic Decline. A bar graph with a descending arrow, symbolizing economic decline and financial downturn, set against a blue background
Free with trial Growth vector icon. Graph or diagram with arrow going up and down. Vector illustration. Sales decrease vectors Growth vector icon. Graph or diagram with arrow going up and down. Vector
Free with trial Illustration of bear and arrow up. Ai illustration. Sales decrease illustrations Illustration of bear and arrow up Ai illustration
Free with trial Data visualization dashboard with various charts and graphs, immersive wallpaper background Generative AI. Sales decrease illustrations Data visualization dashboard with various charts and graphs
Free with trial A pen rests on piece of paper with bar chart, suggesting data analysis, business planning, or financial reporting ,Generative ai. Sales decrease illustrations Pen and paper with bar chart, a visual representation of data analysis. A pen rests on piece of paper with bar chart, suggesting data analysis, business planning, or financial reporting ,Generative ai
Free with trial Doodle style business chart showing decline with a downwards arrow. Sales decrease vectors Doodle style business chart showing decline with a downwards arrow
Free with trial Percent Discount Circle Icon Green Financial Symbol Illustration. Sales decrease vectors Percent Discount Circle Icon Green Financial Symbol Illustration
Free with trial A colorful bar chart with upward and downward arrows and various icons, representing data and analytics. Sales decrease vectors Colorful Bar Chart with Downward Arrows and Icons graph data. A colorful bar chart with upward and downward arrows and various icons, representing data and analytics
Free with trial A striking digital illustration features a bold red and white bullseye target with a prominent red percentage symbol at its precise center, set against a stark black background and surrounded by a constellation of smaller white and red percentage signs that radiate outward, creating a modern and minimalist visual metaphor for goals, accuracy, metrics, business growth, and data-driven success. Sales decrease illustrations A digital illustration of a red and white target with a percentage sign in the center, surrounded by smaller percentage symbols on. A striking digital illustration features a bold red and white bullseye target with a prominent red percentage symbol at its precise center, set against a stark black background and surrounded by a constellation of smaller white and red percentage signs that radiate outward, creating a modern and minimalist visual metaphor for goals, accuracy, metrics, business growth, and data-driven success
Free with trial This clear and simple graph illustrates two opposing trends over time. Trend A, depicted in red, shows a steady decline, starting from a high value and decreasing as time progresses. In contrast, Trend B, shown in blue, demonstrates a consistent upward trajectory, beginning at zero and increasing over the same time period. The intersection point signifies a critical juncture where the values of both trends are equal. This visual is ideal for explaining concepts like competition, growth versus decline, or contrasting performance metrics. Sales decrease vectors Conflicting Trends: Upward vs. Downward Trajectories on a Graph. This clear and simple graph illustrates two opposing trends over time. Trend A, depicted in red, shows a steady decline, starting from a high value and decreasing as time progresses. In contrast, Trend B, shown in blue, demonstrates a consistent upward trajectory, beginning at zero and increasing over the same time period. The intersection point signifies a critical juncture where the values of both trends are equal. This visual is ideal for explaining concepts like competition, growth versus decline, or contrasting performance metrics.
Free with trial Collection of simple black vector icons representing financial charts, data analysis graphs, and business statistics. Includes trend arrows, magnifier, and settings symbols. Sales decrease illustrations Set of black business graph and chart icons for data analysis. Collection of simple black vector icons representing financial charts, data analysis graphs, and business statistics. Includes trend arrows, magnifier, and settings symbols
Free with trial Gleaming golden ten percent rendering against a peach background evokes value This is ideal for marketing materials announcing sales and promotions. Sales decrease illustrations Golden Ten Percent Discount Sale Offer Promotion Announcement Rendering. Gleaming golden ten percent rendering against a peach background evokes value This is ideal for marketing materials announcing sales and promotions
Free with trial Red arrow going down stock icon on white background. Bankruptcy, financial market crash icon for your web site design, logo, app, UI. graph chart down trend symbol. chart going down sign. Sales decrease vectors Red arrow going down stock icon on white background. Bankruptcy, financial market crash icon for your web site design, logo, app
Free with trial Visual representation of decline or negative trend. Downward arrow over a multi-colored bar chart, signifying reduction or decrease. Sales decrease vectors Red arrow pointing down at colorful decreasing bar chart graph. Visual representation of decline or negative trend. Downward arrow over a multi-colored bar chart, signifying reduction or decrease
Free with trial Colorful 3D pie chart render with segments in green, orange, yellow against soft green background. Minimalist design highlights data visualization concept. Useful for business reports. Sales decrease illustrations Colorful 3D pie chart render with segments in green, orange, yellow against soft green background. Minimalist design highlights
Free with trial Declining Bar Graph with Arrow Shows Downtrend and Loss in Business. Sales decrease vectors Declining Bar Graph with Arrow Shows Downtrend and Loss in Business
Free with trial Set of fire flame icons with downward arrows representing hot sales and discounts. Sales decrease vectors Fire flame icon with downward arrow for hot deals and price drop. Set of fire flame icons with downward arrows representing hot sales and discounts
Free with trial A magnifying glass focuses on a declining digital bar chart projected from a smartphone, symbolizing a deep dive into financial data, market analysis, or business performance review. This concept represents the critical scrutiny of a downturn, recession, or investment loss in the modern digital age. Sales decrease illustrations Financial Data Analysis Shows Market Decline on Mobile. A magnifying glass focuses on a declining digital bar chart projected from a smartphone, symbolizing a deep dive into financial data, market analysis, or business performance review. This concept represents the critical scrutiny of a downturn, recession, or investment loss in the modern digital age
Free with trial A striking visual of numerous modern cars stacked in a pyramid formation against a clean, light grey background. The vehicles, ranging in color from blue and red to brown, silver, and grey, decrease in size towards the top, creating a sense of hierarchy and accumulation. This conceptual image represents themes such as the automotive market, consumerism, wealth, growth, and the sheer volume of vehicles in today's society, making it ideal for articles on industry trends, finance, or transportation. Sales decrease illustrations AI generated. Automotive Pyramid Stack: Car Market and Consumerism. A striking visual of numerous modern cars stacked in a pyramid formation against a clean, light grey background. The vehicles, ranging in color from blue and red to brown, silver, and grey, decrease in size towards the top, creating a sense of hierarchy and accumulation. This conceptual image represents themes such as the automotive market, consumerism, wealth, growth, and the sheer volume of vehicles in today's society, making it ideal for articles on industry trends, finance, or transportation.
Free with trial A 3D business growth down sign UI icon, isolated on a white background. Symbolizing a decline in business, finance, or market performance. Sales decrease illustrations Business Growth Down Sign UI Icon 3D Isolated on White Background. A 3D business growth down sign UI icon, isolated on a white background. Symbolizing a decline in business, finance, or market performance.
Free with trial A bar graph shows decreasing values with a downward trending arrow representing business failure and economic loss. Sales decrease vectors Declining Bar Graph with Downward Arrow: Business Loss and Failure. A bar graph shows decreasing values with a downward trending arrow representing business failure and economic loss.
Free with trial This image shows a circular badge with a scalloped edge and a blue gradient background. The badge prominently features the text '25% OFF' in bold, white and light blue colors, indicating a discount promotion. It is likely used for advertising sales or special offers in retail or online shopping environments. Sales decrease illustrations A promotional badge displaying a twenty-five percent discount offer. This image shows a circular badge with a scalloped edge and a blue gradient background. The badge prominently features the text '25% OFF' in bold, white and light blue colors, indicating a discount promotion. It is likely used for advertising sales or special offers in retail or online shopping environments
Free with trial A hand holding a magnifying glass focuses on a downward-trending graph, symbolizing economic decline or financial loss. The image is set against a vibrant yellow background, creating a strong visual contrast. The magnifying glass highlights the concept of scrutiny and analysis, while the graph clearly illustrates a negative trend. This image is suitable for illustrating concepts related to business, finance, economics, market analysis, and economic forecasts. Sales decrease illustrations Analyzing Economic Downturn: Magnifying Glass Over Declining Graph. A hand holding a magnifying glass focuses on a downward-trending graph, symbolizing economic decline or financial loss. The image is set against a vibrant yellow background, creating a strong visual contrast. The magnifying glass highlights the concept of scrutiny and analysis, while the graph clearly illustrates a negative trend. This image is suitable for illustrating concepts related to business, finance, economics, market analysis, and economic forecasts.
Free with trial A striking image depicting a large red arrow pointing sharply downward against a background of a falling stock market graph The image represents the concept of a financial crisis and market downturn Ideal for illustrating economic instability. Sales decrease illustrations Falling Stock Market Graph Red Arrow Down Global Financial Crisis Business Loss. A striking image depicting a large red arrow pointing sharply downward against a background of a falling stock market graph The image represents the concept of a financial crisis and market downturn Ideal for illustrating economic instability
Free with trial Discount Percentage in Gear Symbol, Yellow Financial Concept, Sale Rate. Sales decrease vectors Discount Percentage in Gear Symbol, Yellow Financial Concept, Sale Rate
Free with trial Cracked Wineglass with Percentage Sign Reflecting Financial Instability. Sales decrease vectors Cracked Wineglass with Percentage Sign Reflecting Financial Instability
Free with trial Bankruptcy, financial market crash, Red arrow going down stock icon on white background. suitable for web site design, logo, app, UI. graph chart down trend symbol. chart going down sign. Sales decrease vectors Bankruptcy, financial market crash, Red arrow going down stock icon on white background. suitable for web site design, logo, app
Free with trial Icon financial loss analytics with declining bar chart, down arrow and dollar sign, gear with cross for failed settings, minimal outline symbol for business report. Sales decrease vectors Icon financial loss analytics with declining bar chart, down arrow and dollar sign, gear with cross for failed settings, minimal
Free with trial Three prominent red arrows point downwards, each displaying a white percentage symbol. This imagery powerfully represents declining prices, sales, and financial reduction, ideal for marketing and economic contexts. Sales decrease illustrations Three red downward arrows with percentage symbols symbolizing falling prices and discounts isolated on white background. Three prominent red arrows point downwards, each displaying a white percentage symbol. This imagery powerfully represents declining prices, sales, and financial reduction, ideal for marketing and economic contexts
Free with trial A 3D bar chart with red, blue, and orange bars displayed on a white board with a red frame and easel legs. Isolated on a transparent background. Sales decrease vectors 3 D Bar Chart on Easel isolated on a transparent background graph data. A 3D bar chart with red, blue, and orange bars displayed on a white board with a red frame and easel legs. Isolated on a transparent background
Free with trial Pink bar graph showing a downward trend on a pink background, financial concept. Sales decrease illustrations Pink bar graph showing a downward trend on a pink background, financial concept
Free with trial A bold red downward arrow pointing to indicate a zero percent value, perfect for financial, sales, or discount graphics. Clean and modern design with a transparent background for easy integration into various projects. Sales decrease illustrations Red downward arrow with zero percent symbol on transparent background. A bold red downward arrow pointing to indicate a zero percent value, perfect for financial, sales, or discount graphics. Clean and modern design with a transparent background for easy integration into various projects
Free with trial A man in a suit presents a digital interface showing a cost reduction chart with a downward arrow, illustrating financial decline and business challenges. Sales decrease illustrations Man presenting cost reduction chart with downward arrow and percentage sign in a digital interface. a man in a suit presents a digital interface showing a cost reduction chart with a downward arrow, illustrating financial decline and business challenges.
Free with trial Business chart showing negative trend with red arrow and descending bars. Sales decrease vectors Business chart showing negative trend with red arrow and descending bars
Free with trial Financial Downturn or Loss Represented by Dollar Sign and Downward Arrow. Sales decrease vectors Financial Downturn or Loss Represented by Dollar Sign and Downward Arrow
Free with trial Financial crisis concept with red descending arrow. AI generative. Sales decrease illustrations Financial crisis concept with red descending arrow.
Free with trial Financial crisis concept with red descending arrow. AI generative. Sales decrease illustrations Financial crisis concept with red descending arrow.
Free with trial Financial crisis concept with red descending arrow. AI generative. Sales decrease illustrations Financial crisis concept with red descending arrow.
Free with trial Graph chart going up and down sign arrows flat design vector illustration on white background. Sales decrease vectors Graph chart going up and down sign arrows flat design vector illustration
Free with trial Blue bar chart illustrating financial decline with downward red arrow pointing to green dollar sign, isolated. Sales decrease illustrations Business graph showing decreasing performance with red arrow and dollar. Blue bar chart illustrating financial decline with downward red arrow pointing to green dollar sign, isolated
Free with trial Hand drawn bar graph showing a sharp downward trend with a descending arrow. Sales decrease vectors Hand drawn bar graph showing a sharp downward trend with a descending arrow
Free with trial Financial crisis concept with red descending arrow. AI generative. Sales decrease illustrations Financial crisis concept with red descending arrow.
Free with trial Financial crisis concept with red descending arrow. AI generative. Sales decrease illustrations Financial crisis concept with red descending arrow.
Free with trial Financial crisis concept with red descending arrow. AI generative. Sales decrease illustrations Financial crisis concept with red descending arrow.
Free with trial A bar chart displaying varying data points, with a prominent red bar signifying a downturn or negative outcome amidst generally positive trends, highlighting a specific area of concern. Sales decrease illustrations Bar chart with one red bar indicating a decline isolated on white background. A bar chart displaying varying data points, with a prominent red bar signifying a downturn or negative outcome amidst generally positive trends, highlighting a specific area of concern
Free with trial Glossy polished 3D red segmented downward arrow, ideal for illustrating market decline, economic downturn, financial loss, stock market crashes, business recession, and corporate financial downturn concepts for financial reports, marketing assets and business content , stunning visual effect. Sales decrease vectors Red Arrow Shows Decline with Statistics Concept and Economic Downturn. Glossy polished 3D red segmented downward arrow, ideal for illustrating market decline, economic downturn, financial loss, stock market crashes, business recession, and corporate financial downturn concepts for financial reports, marketing assets and business content , stunning visual effect
Free with trial Discount Sunburst Badge Graphic Black and White Commercial Sale Announcement. Sales decrease vectors Discount Sunburst Badge Graphic Black and White Commercial Sale Announcement
Free with trial Black bar chart with decreasing bar heights showing a downward trend on white background. Sales decrease illustrations Black bar chart showing a downward trend on a white background graph decline. Black bar chart with decreasing bar heights showing a downward trend on white background
Free with trial A detailed illustration of a business growth chart with multiple lines, representing profit, trend, and loss, along with various financial indicators and icons. Sales decrease vectors Business growth chart with multiple lines and various financial indicators. A detailed illustration of a business growth chart with multiple lines, representing profit, trend, and loss, along with various financial indicators and icons
Free with trial Nine flat design icons depict various data charts and graphs in muted blue and teal tones. Sales decrease vectors Collection of nine flat design data charts and graphs analysis statistics. Nine flat design icons depict various data charts and graphs in muted blue and teal tones.
Free with trial Peach colored discount coupon with percentage symbol floats on minimalist white background. This simple, clean 3D render promotes savings, sales, offers and deals in retail and. Sales decrease illustrations Peach colored discount coupon with percentage symbol floats on minimalist white background. This simple, clean 3D render promotes
Free with trial A digital illustration representing economic concepts of supply and demand. On the left, a blue arrow points upwards labeled "DEMAND" with a crowd of stylized figures. On the right, a red arrow points downwards labeled "SUPPLY" with another crowd and various business-related icons. The two sides are separated by a glowing energy effect on a dark, futuristic background. Sales decrease illustrations Conceptual illustration of supply and demand with contrasting arrows and crowds. A digital illustration representing economic concepts of supply and demand. On the left, a blue arrow points upwards labeled "DEMAND" with a crowd of stylized figures. On the right, a red arrow points downwards labeled "SUPPLY" with another crowd and various business-related icons. The two sides are separated by a glowing energy effect on a dark, futuristic background
Free with trial Slide switch with TSA, tax sheltered annuary text. Financial, Management, Economic. close up of slide switch,Business Concept. 3D rendering on green background. Sales decrease illustrations Slide switch with TSA, tax sheltered annuary text. Financial, Management, Economic.close up of slide switch
Free with trial Slide switch with TSA, tax sheltered annuary text. Financial, Management, Economic. close up of slide switch,Business Concept. 3D rendering on blue background. Sales decrease illustrations Slide switch with TSA, tax sheltered annuary text. Financial, Management, Economic.close up of slide switch. slide switch with TSA, tax sheltered annuary text. Financial, Management, Economic.close up of slide switch,Business Concept.3D rendering on blue background.
Free with trial Business decline concept showing a decreasing financial trend with wooden blocks and red downward arrows. Vibrant yellow background provides ample copy space image features clean, natural light. Ideal for financial reports, web banners, presentations, or marketing collateral. Sales decrease illustrations Business Decline Trend Blocks with Red Arrows on Yellow Background Copy Space. Business decline concept showing a decreasing financial trend with wooden blocks and red downward arrows. Vibrant yellow background provides ample copy space image features clean, natural light. Ideal for financial reports, web banners, presentations, or marketing collateral.