Free with trial Market trend icon in comic style. Decline arrow with magnifier cartoon vector illustration on white isolated background. Decrease splash effect business concept. Decrease financial trends vectors Market trend icon in comic style. Decline arrow with magnifier cartoon vector illustration on white isolated background. Decrease
Free with trial Set of circular dollar currency icons with up and down arrows representing profit, loss, exchange and rate changes flat and glyph styles in black, red and green for business and finance use. Decrease financial trends vectors Money Currency Icons With Up And Down Arrows Showing Increase And Decrease Financial Trends. Set of circular dollar currency icons with up and down arrows representing profit, loss, exchange and rate changes flat and glyph styles in black, red and green for business and finance use.
Free with trial Multiple red graphs with different shaped arrowhead endings indicating negative trends. Decrease financial trends vectors Arrows down. Multiple red graphs with different shaped arrowhead endings indicating negative trends
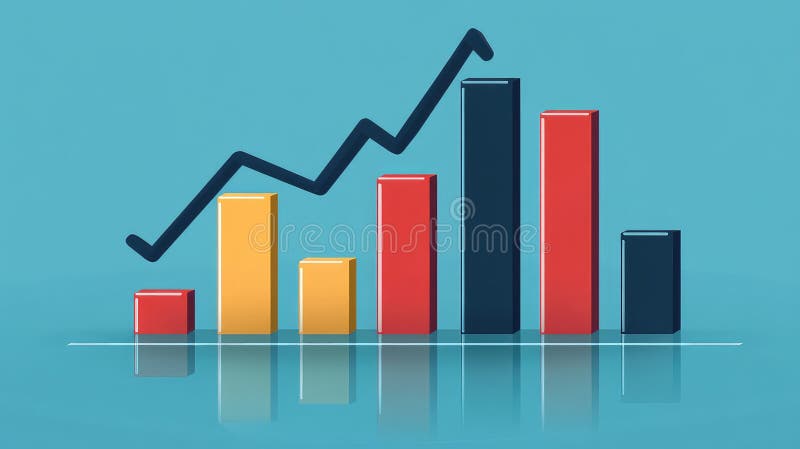
Free with trial Increase and decrease three-dimensional bar graph. Decrease financial trends vectors Orange bar graph with arrow. Increase and decrease three-dimensional bar graph
Free with trial 3D render of falling bar chart with red arrow showing the decline. Decrease financial trends illustrations Declining bar chart with arrow. 3D render of falling bar chart with red arrow showing the decline
Free with trial The image shows two percentage symbols, one in red with a downward arrow indicating a decrease or loss, and another in green with an upward arrow indicating an increase or gain. This visual metaphor is commonly used to represent opposing financial trends, such as inflation versus deflation, market decline versus growth, or loss versus profit. Decrease financial trends illustrations Opposite financial trends represented by percentage symbols with upward and downward arrows. The image shows two percentage symbols, one in red with a downward arrow indicating a decrease or loss, and another in green with an upward arrow indicating an increase or gain. This visual metaphor is commonly used to represent opposing financial trends, such as inflation versus deflation, market decline versus growth, or loss versus profit
Free with trial An arrow plunges, depicted on the side of a stack of books, representing the death of the old-fashioned publishing industry in an era of e-books and new media. Decrease financial trends illustrations Decline of Publishing Industry - Falling Sales. An arrow plunges, depicted on the side of a stack of books, representing the death of the old-fashioned publishing industry in an era of e-books and new media
Free with trial Arrow graph going down illustration isolated on white background. Downward trend. Business chart cartoon. Decrease financial trends illustrations Arrow graph going down illustration isolated on white background
Free with trial The hands are holding a tablets with stock quote charts on the screens. The fall and increase in the shares price graphs. The trader`s computers, sell, buy buttons. Business flat concept illustration. Decrease financial trends vectors The tablet computers with stock quote charts on the screens. The hands are holding a tablets with stock quote charts on the screens. The fall and increase in the shares price graphs. The trader`s computers, sell, buy buttons. Business flat concept illustration.
Free with trial Percentage with up and down arrows line icon. Percent symbol showing increase and decrease. Financial analytics sign for banking, credit, interest rates, statistics, and economic trends. Decrease financial trends vectors Percentage with up and down arrows line icon. Percent symbol showing increase and decrease. Financial analytics sign for banking
Free with trial Candlestick chart displaying financial data trends with red and green bars on a white background. Each candlestick represents price movement over a specific time period, reflecting opening, closing, high, and low prices. Green candles indicate a price increase, while red ones signify a decrease. Vertical lines, or wicks, extend above and below the body of the candle, showing price extremes. This visualization is commonly used in financial markets to analyze stock prices and trends. Decrease financial trends illustrations Candlestick chart displaying financial data trends with red and green bars on a
Free with trial The image shows two arrows, one red pointing downward and the other green pointing upward, each accompanied by a percentage symbol. This visual metaphor typically represents a decrease and an increase in percentage values, respectively. Such symbols are often used in financial, statistical, or performance contexts to indicate trends or changes over time. Decrease financial trends illustrations Visual representation of increasing and decreasing percentage trends with directional arrows. The image shows two arrows, one red pointing downward and the other green pointing upward, each accompanied by a percentage symbol. This visual metaphor typically represents a decrease and an increase in percentage values, respectively. Such symbols are often used in financial, statistical, or performance contexts to indicate trends or changes over time
Free with trial A straightforward vector illustration of a simple red down-pointing arrow, indicating decline or decrease. Useful for financial charts, warning signs, negative trends, and downward movement. Represents reduction, lowering, and adverse changes, vector design Generative AI. Decrease financial trends vectors Simple Red Down Arrow Icon, Decline and Decrease Indicator, vector design Generative AI. A straightforward vector illustration of a simple red down-pointing arrow, indicating decline or decrease. Useful for financial charts, warning signs, negative trends, and downward movement. Represents reduction, lowering, and adverse changes, vector design Generative AI
Free with trial Financial trends illustrated with colored arrows and dollar coin symbols. Decrease financial trends illustrations Financial trends illustrated with colored arrows and dollar coin symbols
Free with trial Arrows with dollar signs indicating financial trends and market directions. Decrease financial trends illustrations Arrows with dollar signs indicating financial trends and market directions
Free with trial A display of financial data with charts, graphs, and statistics showing market trends and analysis details. Decrease financial trends illustrations Financial data charts showcasing stock market trends. A display of financial data with charts, graphs, and statistics showing market trends and analysis details
Free with trial Economic decline, financial loss, market trends, business analysis, payment reminder, schedule planning. Downward trend graph with sad face icon. Economic decline and financial loss. Decrease financial trends vectors Economic Decline and Financial Trends with Calendar Reminder and Graph Symbols. Economic decline, financial loss, market trends, business analysis, payment reminder, schedule planning. Downward trend graph with sad face icon. Economic decline and financial loss
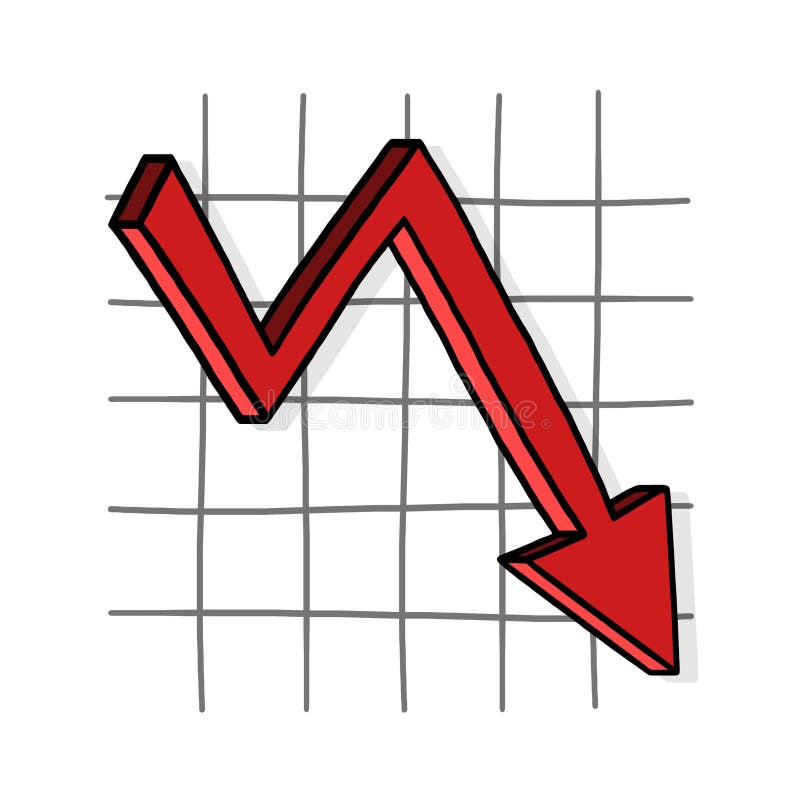
Free with trial A stark red arrow zigzags downwards, powerfully representing economic downturns, market crashes, and negative financial trends. This visual signifies a crisis or significant drop. Decrease financial trends illustrations Red downward arrow symbolizing financial decline and economic recession trends. A stark red arrow zigzags downwards, powerfully representing economic downturns, market crashes, and negative financial trends. This visual signifies a crisis or significant drop
Free with trial A collection of icons featuring increase and decrease symbols in various styles, ideal for financial and business presentations on white background. Decrease financial trends vectors A collection of icons featuring increase and decrease symbols in various styles, ideal for financial and business presentations
Free with trial Analyze Market Trends on Phone Screen with Desk Details and Financial Analysis , immersive atmosphere. Decrease financial trends illustrations Analyze Market Trends on Phone Screen with Desk Details and Financial Analysis
Free with trial This image depicts a financial market stock chart with green and red candlesticks. The candlesticks represent price movements over specific time intervals, with green indicating an increase in value and red indicating a decrease. The chart is set against a dark background, highlighting the candlesticks clearly. This type of chart is commonly used by traders and investors to analyze market trends. Decrease financial trends illustrations Financial market stock chart
Free with trial That the image is generated using AI. Dynamic financial market data display with rising stock trends. Decrease financial trends illustrations Dynamic financial market data display with rising stock trends
Free with trial This image presents an abstract view of financial trends through black and orange bar graphs, symbolizing data analysis and market metrics. Decrease financial trends illustrations Abstract representation of financial trends with black and orange bar graphs on dark background. This image presents an abstract view of financial trends through black and orange bar graphs, symbolizing data analysis and market metrics
Free with trial A professional hand gesture overlays a dynamic financial graph, representing market trends and data analysis essential for effective investment strategies. Scalp. Decrease financial trends illustrations Professional Hand Gesture Over Financial Graph Displaying Market Trends and Data Analysis for Investment and Trading. A professional hand gesture overlays a dynamic financial graph, representing market trends and data analysis essential for effective investment strategies. Scalp
Free with trial The image depicts a dollar sign symbol flanked by a downward red arrow on the left and an upward green arrow on the right, representing contrasting financial trends such as economic decline and growth. Decrease financial trends illustrations Financial trends illustrated by contrasting arrows and dollar symbol. The image depicts a dollar sign symbol flanked by a downward red arrow on the left and an upward green arrow on the right, representing contrasting financial trends such as economic decline and growth
Free with trial Exploring real estate investment strategies. hand interacting with blocks representing financial growth, property market trends, and investment planning. a visual concept for wealth management. Decrease financial trends illustrations Real estate investment strategy planning financial growth property market trends and analysis concept. exploring real estate investment strategies. hand interacting with blocks representing financial growth, property market trends, and investment planning. a visual concept for wealth management.
Free with trial A vibrant and detailed bar chart with a line graph overlay, showcasing financial data trends over time. The chart features a variety of colors, including shades of green, purple, and blue, with data points marked by small diamond shapes. The background is a dark blue grid, providing a stark contrast to the colorful data visualization. Decrease financial trends illustrations Colorful bar chart and line graph representing financial data trends. A vibrant and detailed bar chart with a line graph overlay, showcasing financial data trends over time. The chart features a variety of colors, including shades of green, purple, and blue, with data points marked by small diamond shapes. The background is a dark blue grid, providing a stark contrast to the colorful data visualization
Free with trial This image features neon icons representing financial news, investment growth, stock market trends, and credit card transactions, ideal for business and finance themes. Decrease financial trends vectors Vector art of neon icons representing financial news, investment growth, stock market trends, and credit card transactions on a. This image features neon icons representing financial news, investment growth, stock market trends, and credit card transactions, ideal for business and finance themes
Free with trial A blue percentage sign with a downward arrow symbolizes financial decline. It represents loss, reduction, and negative trends in business and the economy. Decrease financial trends vectors Vector art of blue percentage sign with downward arrow indicating a decrease or loss in value, representing financial decline or. A blue percentage sign with a downward arrow symbolizes financial decline. It represents loss, reduction, and negative trends in business and the economy
Free with trial This image depicts an abstract representation of data trends and financial growth using blue waves and lines. The design is modern and dynamic, with various waves and lines intersecting and overlapping to create a sense of movement and progression. The blue color scheme gives the image a cool and professional look, making it suitable for use in business and finance-related contexts. Decrease financial trends illustrations Abstract representation of data trends and financial growth with blue waves. This image depicts an abstract representation of data trends and financial growth using blue waves and lines. The design is modern and dynamic, with various waves and lines intersecting and overlapping to create a sense of movement and progression. The blue color scheme gives the image a cool and professional look, making it suitable for use in business and finance-related contexts
Free with trial The image depicts two sets of bar graphs with upward and downward arrows, illustrating contrasting financial trends. The left side shows a positive growth trend with increasing green bars and upward arrows, while the right side displays a mix of declining and rising red bars with both downward and upward arrows, indicating volatility or mixed performance in financial metrics. Decrease financial trends illustrations Contrasting trends in financial growth and decline through bar and arrow graphics. The image depicts two sets of bar graphs with upward and downward arrows, illustrating contrasting financial trends. The left side shows a positive growth trend with increasing green bars and upward arrows, while the right side displays a mix of declining and rising red bars with both downward and upward arrows, indicating volatility or mixed performance in financial metrics
Free with trial Financial graph depicting declining trends with stock market data in blue and black lines, on a white background. Concept of financial downturn. 3D Rendering. Decrease financial trends illustrations Financial graph with declining trends and stock market data on white background. 3D Rendering. Financial graph depicting declining trends with stock market data in blue and black lines, on a white background. Concept of financial downturn. 3D Rendering
Free with trial This abstract image represents detailed data visualization of financial market trends featuring line graphs and bar charts on a dark backdrop. Decrease financial trends illustrations Abstract Data Visualization of Financial Market Trends with Line Graph and Bar Chart on Dark Background. This abstract image represents detailed data visualization of financial market trends featuring line graphs and bar charts on a dark backdrop
Free with trial This compelling macro photography showcases a stark decline in investment fund values. The blue cubes, transitioning to red arrows pointing downward, vividly illustrate the negative trends in the stock market. This visual representation of investment data highlights the critical need for in-depth financial analysis and proactive investment strategies. The chart, created using advanced AI. Decrease financial trends illustrations Macro Financial Chart Depicts Declining Investment Funds A Visual Analysis of Market Trends and Potential Risks. This compelling macro photography showcases a stark decline in investment fund values. The blue cubes, transitioning to red arrows pointing downward, vividly illustrate the negative trends in the stock market. This visual representation of investment data highlights the critical need for in-depth financial analysis and proactive investment strategies. The chart, created using advanced AI
Free with trial A vibrant illustration of a bar graph with arrows, representing financial trends and market analysis. The image conveys economic performance and business insights. Decrease financial trends vectors Vector art of colorful bar graph with arrows indicating growth and decline, symbolizing financial trends, market analysis, and. A vibrant illustration of a bar graph with arrows, representing financial trends and market analysis. The image conveys economic performance and business insights
Free with trial This image displays financial performance indicators, highlighting data trends and market volatility. It represents economic analysis and strategic decision-making processes. Decrease financial trends vectors Vector art of financial performance indicators, showcasing data trends, market volatility, and economic analysis for strategic. This image displays financial performance indicators, highlighting data trends and market volatility. It represents economic analysis and strategic decision-making processes
Free with trial A vibrant 3D bar graph illustration shows financial growth trends with colorful bars. Perfect for business presentations, analytics, and creative projects. Decrease financial trends illustrations Colorful 3D bar graph illustration depicting financial growth and performance trends with vibrant hues and clean modern design for. A vibrant 3D bar graph illustration shows financial growth trends with colorful bars. Perfect for business presentations, analytics, and creative projects
Free with trial Graph depicting 3D line and bar data visualization in red, white background, financial trends concept. Decrease financial trends illustrations Graph showing 3D line and bar data visualization in red, white background, financial trends concept
Free with trial Red down arrow and green up arrow with percentage signs represent financial rate changes market fluctuations price adjustments and economic trends. Decrease financial trends vectors Percentage up and down arrows indicating financial rate increase and decrease. Red down arrow and green up arrow with percentage signs represent financial rate changes market fluctuations price adjustments and economic trends
Free with trial Flat Design Illustration of NPL Risk Analysis with Declining Bar Chart, Highlighting Financial Trends and Risks. Ideal. Decrease financial trends illustrations Flat Design Illustration of NPL Risk Analysis with Declining Bar Chart, Highlighting Financial Trends and Risks. Ideal
Free with trial Close-up of a fluctuating red graph line on a digital screen, symbolizing market trends and financial performance, Generative AI. Decrease financial trends illustrations Close-up of a fluctuating red graph line on a digital screen, symbolizing market trends and financial performance
Free with trial A visually striking representation of financial decline, featuring a red arrow pointing downward on a sleek graph. Ideal for illustrating market trends and economic analysis. Decrease financial trends illustrations Red Arrow Graph Depicting Financial Decline and Market Trends. A visually striking representation of financial decline, featuring a red arrow pointing downward on a sleek graph. Ideal for illustrating market trends and economic analysis
Free with trial A green zigzag arrow graph pointing downwards, symbolizing a decrease, decline, or downward trend. This can be used for financial charts showing a market drop or for any data visualization representing a reduction or loss. vector design Generative AI. Decrease financial trends vectors Green Arrow Graph Pointing Down for Financial and Data Trends, vector design Generative AI. A green zigzag arrow graph pointing downwards, symbolizing a decrease, decline, or downward trend. This can be used for financial charts showing a market drop or for any data visualization representing a reduction or loss. vector design Generative AI
Free with trial A black outline graphic of a line trending downwards. This icon represents decline, decrease, negative trends, statistics, analysis, or negative performance in a simple graphic outline style, suitable for financial, business, or statistical visuals. , vector design Generative AI. Decrease financial trends vectors Outline graphic of a downward sloping line, symbolizing decline trends , vector design Generative AI. A black outline graphic of a line trending downwards. This icon represents decline, decrease, negative trends, statistics, analysis, or negative performance in a simple graphic outline style, suitable for financial, business, or statistical visuals. , vector design Generative AI
Free with trial The image features a collection of red percentage symbols and arrows, both upward and downward, scattered across a white background. The upward arrows indicate positive growth or increases, while the downward arrows suggest declines or decreases in value. The combination of these elements visually represents financial trends, market fluctuations, and percentage-based changes, often seen in stock. Decrease financial trends illustrations Dynamic financial symbols illustrating market trends and percentage changes. The image features a collection of red percentage symbols and arrows, both upward and downward, scattered across a white background. The upward arrows indicate positive growth or increases, while the downward arrows suggest declines or decreases in value. The combination of these elements visually represents financial trends, market fluctuations, and percentage-based changes, often seen in stock
Free with trial Financial Capability Month Financial chart with 3d bar graph and line plot illustrating market trends. Decrease financial trends illustrations Financial Capability Month Financial chart with 3d bar graph and line plot illustrating market trends
Free with trial Iced over business graph or chart, visualizing declining winter season sales trends A business financial chart or graph, rendered as if made of ice or heavily frosted. The lines of the graph are. Decrease financial trends illustrations Iced over business graph or chart, visualizing declining winter season sales trends A business financial chart or graph, rendered
Free with trial Bar Chart Growth And Decline Line And Solid Icon Set. Financial Performance, Economic Trends, Business Analysis Symbol Collection. Data Visualization And Market Trends. Isolated Vector Illustration. Decrease financial trends vectors Bar Chart Growth And Decline Line And Solid Icon Set. Financial Performance, Economic Trends, Business Analysis Symbol
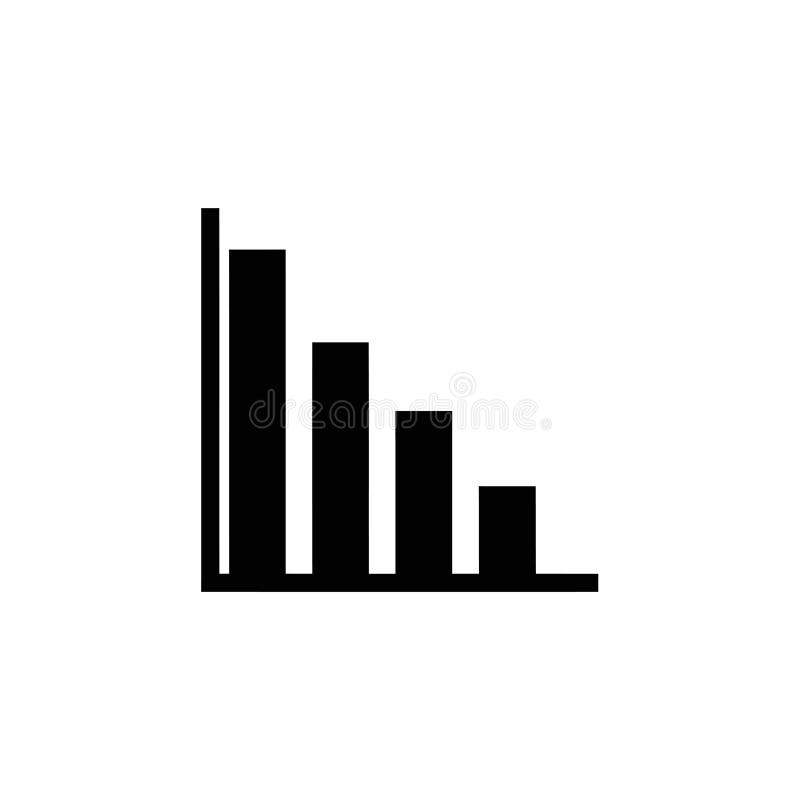
Free with trial This vector illustration depicts a descending bar graph, representing decline and negative trends. It is suitable for financial reports, business analysis, and presentations. Decrease financial trends vectors Illustration of a descending bar graph, , representing decline, decrease, and negative trends in business or finance. This vector illustration depicts a descending bar graph, representing decline and negative trends. It is suitable for financial reports, business analysis, and presentations
Free with trial This breathtaking panoramic image showcases a dynamic financial graph rendered in a striking shade of blue. The prominent percentage sign overlaid on the visual data adds a powerful emphasis on key market indicators. The horizontal panoramic format allows for a comprehensive overview of the data, revealing significant trends and patterns within the investment landscape. From potential stock. Decrease financial trends illustrations Panoramic Blue Financial Graph with Percentage Symbol A Visual Representation of Market Trends and Investment Data. This breathtaking panoramic image showcases a dynamic financial graph rendered in a striking shade of blue. The prominent percentage sign overlaid on the visual data adds a powerful emphasis on key market indicators. The horizontal panoramic format allows for a comprehensive overview of the data, revealing significant trends and patterns within the investment landscape. From potential stock
Free with trial Line Graph Chart Icon. Data Analysis, Business Growth, And Statistical Trends Outline Symbol. Financial Performance Tracking. Editable Stroke. Isolated Vector Illustration. Decrease financial trends vectors Line Graph Chart Icon. Data Analysis, Business Growth, And Statistical Trends Outline Symbol. Financial Performance
Free with trial Magnifying glass focuses on stock market chart details. Analyzing trends changes. Financial data in focus. Investment strategy. Visual representation of market trends. Studying market. Decrease financial trends illustrations Magnifying glass focuses on stock market chart details. Analyzing trends, changes. Financial data in focus. Investment strategy. Magnifying glass focuses on stock market chart details. Analyzing trends changes. Financial data in focus. Investment strategy. Visual representation of market trends. Studying market.
Free with trial Flat Design Illustration of NPL Risk Analysis with Declining Bar Chart, Highlighting Financial Trends and Risks. Ideal. Decrease financial trends illustrations Flat Design Illustration of NPL Risk Analysis with Declining Bar Chart, Highlighting Financial Trends and Risks. Ideal
Free with trial A financial markets chart features the German flag overlaid with economic data, illustrating trading trends. Ideal for reports, business analysis, and financial news, the image depicts potential market decline, investment, or. Decrease financial trends illustrations Financial markets chart showing german flag depicting economic data and trading trends. A financial markets chart features the German flag overlaid with economic data, illustrating trading trends. Ideal for reports, business analysis, and financial news, the image depicts potential market decline, investment, or
Free with trial The image shows a person holding a tablet displaying a bar chart with two distinct data sets, one in red and one in blue, indicating a comparison of metrics or trends. The person appears to be in an office environment, possibly analyzing financial or business data, suggesting a focus on performance metrics or market analysis. Decrease financial trends illustrations Professional analyzing financial growth trends on a digital tablet in an office setting. The image shows a person holding a tablet displaying a bar chart with two distinct data sets, one in red and one in blue, indicating a comparison of metrics or trends. The person appears to be in an office environment, possibly analyzing financial or business data, suggesting a focus on performance metrics or market analysis
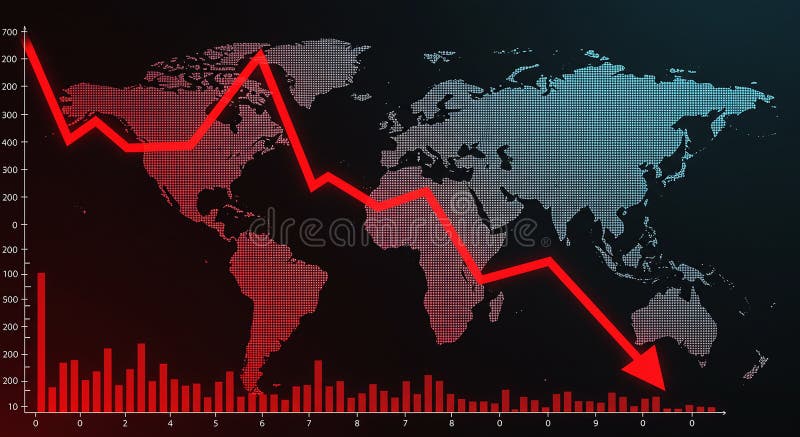
Free with trial World map with a red declining line graph overlay, illustrating a decrease or economic downturn. The graph features sharp declines across various data points, reflecting a downward trend. Red bar chart at the bottom represents additional numerical data against a black background. The map uses a dotted pattern for continents, highlighting regions globally. The image conveys financial analysis, market trends, or economic statistics. Decrease financial trends illustrations World map with a red declining line graph overlay
Free with trial A vector icon of city buildings with a downward-pointing arrow. Represents urban decline, property value decrease, or economic downturn in real estate. Ideal for market analysis, urban planning challenges, and financial reports. Visualizes negative trends effectively, vector design Generative AI. Decrease financial trends vectors City Buildings with Down Arrow Urban Decline Icon, vector design Generative AI. A vector icon of city buildings with a downward-pointing arrow. Represents urban decline, property value decrease, or economic downturn in real estate. Ideal for market analysis, urban planning challenges, and financial reports. Visualizes negative trends effectively, vector design Generative AI
Free with trial This infographic displays a bar graph illustrating a sharp negative trend. The red line clearly depicts a significant decrease, showcasing concepts like downturn, recession, and loss within a business or financial context. Ideal for presentations, reports, and analyses highlighting negative market trends or economic decline, generated by AI. Decrease financial trends illustrations Decreasing bar graph showing negative trend decline. This infographic displays a bar graph illustrating a sharp negative trend. The red line clearly depicts a significant decrease, showcasing concepts like downturn, recession, and loss within a business or financial context. Ideal for presentations, reports, and analyses highlighting negative market trends or economic decline, generated by AI.
Free with trial A vivid red arrow signifies a downward trend or negative movement. This impactful graphic represents decline loss decrease and is ideal for illustrating financial reports or data trends. Decrease financial trends illustrations Bold red arrow points downward showing decline loss decrease trend direction. A vivid red arrow signifies a downward trend or negative movement. This impactful graphic represents decline loss decrease and is ideal for illustrating financial reports or data trends
Free with trial A versatile collection of flat vector icons illustrating concepts of decline, decrease, and loss. This set features various graphics, including downward-pointing arrows, negative trend line graphs, and falling bar charts in multiple colors. These symbols are perfect for representing financial crisis, economic recession, stock market crash, business failure, or any form of reduction. Ideal for use in infographics, presentations, financial reports, websites, and data visualization projects, these modern icons effectively communicate negative trends and downturns. Isolated on a white background for easy integration into any design. Decrease financial trends illustrations Financial Decline and Recession Vector Icon Set. A versatile collection of flat vector icons illustrating concepts of decline, decrease, and loss. This set features various graphics, including downward-pointing arrows, negative trend line graphs, and falling bar charts in multiple colors. These symbols are perfect for representing financial crisis, economic recession, stock market crash, business failure, or any form of reduction. Ideal for use in infographics, presentations, financial reports, websites, and data visualization projects, these modern icons effectively communicate negative trends and downturns. Isolated on a white background for easy integration into any design.
Free with trial The image depicts a downward red arrow intersecting with a green house icon and a euro symbol, symbolizing a decrease in housing prices or mortgage rates in the European economic context. The percentage sign emphasizes the financial aspect of the decline, suggesting economic trends or market downturns affecting real estate costs. Decrease financial trends illustrations Graphic illustrating a decline in housing prices and interest rates in euros. The image depicts a downward red arrow intersecting with a green house icon and a euro symbol, symbolizing a decrease in housing prices or mortgage rates in the European economic context. The percentage sign emphasizes the financial aspect of the decline, suggesting economic trends or market downturns affecting real estate costs
Free with trial This vibrant abstract graph illustrates the dynamic trends in financial markets, highlighting fluctuations in trading data and investment opportunities. Decrease financial trends illustrations Abstract financial trading graph with vibrant color scheme showcasing fluctuating market trends and data analysis visuals. This vibrant abstract graph illustrates the dynamic trends in financial markets, highlighting fluctuations in trading data and investment opportunities
Free with trial The image shows two large arrows pointing in opposite directions, one red arrow pointing downward with a percent symbol indicating a decrease, and one green arrow pointing upward with a percent symbol indicating an increase. This visual metaphor is often used to represent contrasting financial or statistical trends, such as growth versus decline. Decrease financial trends vectors Graphic illustration of opposing percentage trends with directional arrows. The image shows two large arrows pointing in opposite directions, one red arrow pointing downward with a percent symbol indicating a decrease, and one green arrow pointing upward with a percent symbol indicating an increase. This visual metaphor is often used to represent contrasting financial or statistical trends, such as growth versus decline
Free with trial The image shows a stack of three shiny golden coins placed on a black rectangular platform. Behind the coins, there is a downward-pointing arrow, indicating a decline or drop, often used to symbolize a decrease in price or value in financial contexts. The overall composition suggests themes related to economics, finance, or market trends. Decrease financial trends illustrations Stacked golden coins with a downward price trend arrow on a black platform. The image shows a stack of three shiny golden coins placed on a black rectangular platform. Behind the coins, there is a downward-pointing arrow, indicating a decline or drop, often used to symbolize a decrease in price or value in financial contexts. The overall composition suggests themes related to economics, finance, or market trends
Free with trial This image depicts a large dollar sign symbol with two arrows attached to it. One green arrow points upwards, indicating growth or increase, while a red arrow points downwards and to the left, symbolizing decline or decrease. The visual metaphor emphasizes the dual nature of financial movements, highlighting both positive and negative trends in economic contexts. Decrease financial trends illustrations The dual direction of financial growth and decline represented by dollar signs and arrows. This image depicts a large dollar sign symbol with two arrows attached to it. One green arrow points upwards, indicating growth or increase, while a red arrow points downwards and to the left, symbolizing decline or decrease. The visual metaphor emphasizes the dual nature of financial movements, highlighting both positive and negative trends in economic contexts