Free with trial A bold, three-dimensional red arrow illustrates a sharp downward trend, resembling a stock market graph or financial chart. The arrow's segmented, zigzagging path signifies decline, loss, or negative performance. Isolated on a transparent background, this graphic is versatile for representing economic downturns, business failures, or any concept of decrease and regression. Stock decrease illustrations Red Arrow Graph Showing Downward Trend. A bold, three-dimensional red arrow illustrates a sharp downward trend, resembling a stock market graph or financial chart. The arrow's segmented, zigzagging path signifies decline, loss, or negative performance. Isolated on a transparent background, this graphic is versatile for representing economic downturns, business failures, or any concept of decrease and regression.
Free with trial Double exposure economic downturn with gold coin stacks on cubes spelling CRASH. Concept a sharp downward arrow and volatile red financial graphs and stock market collapse. Stock decrease illustrations Double exposure economic downturn with gold coin stacks on cubes spelling CRASH. Concept a sharp downward arrow and volatile red
Free with trial Stock market. The rise and fall of securities. Successful trading. Market trend up green and red down arrows, financial graphs. Business investment growth and loss arrow. Graph going up and down symbol vector illustration. Stock decrease vectors Stock market. The rise and fall of securities. Successful trading. Market trend up green and red down arrows, financial graphs.
Free with trial The image depicts a downward trending arrow over a triangular base, symbolizing a decline or decrease. The arrow starts at a higher point and descends, indicating a negative trend or downward movement. This could represent various concepts such as a drop in stock prices, a decline in sales, or a reduction in any measurable metric. Stock decrease vectors Downward trend indicating decline. The image depicts a downward trending arrow over a triangular base, symbolizing a decline or decrease. The arrow starts at a higher point and descends, indicating a negative trend or downward movement. This could represent various concepts such as a drop in stock prices, a decline in sales, or a reduction in any measurable metric
Free with trial Bull and bear market concept with up and down arrows. Stock market trends, concept. 3d rendering isolated on white background. Stock decrease illustrations Bull and bear market concept with up and down arrows. Stock market trends, concept. 3d rendering
Free with trial Financial difficulties, decrease in value of business or company shares, stock market crash, economic crisis, business failure, loss of cash, lose investments, businessman running across the word crisis. Stock decrease vectors Financial difficulties
Free with trial A simple illustration of a declining blue bar graph against a black background. Represents loss or decrease. Stock decrease vectors Declining bar graph demonstrating financial loss and recession illustration. A simple illustration of a declining blue bar graph against a black background. Represents loss or decrease.
Free with trial Flat graphic showing a dollar coin with arrows illustrating market fluctuation and volatility, styled as flat cartoon icon. Stock decrease vectors Investment Fluctuation Illustration Showing Increase and Decrease of Capital. Flat graphic showing a dollar coin with arrows illustrating market fluctuation and volatility, styled as flat cartoon icon.
Free with trial Red arrow going down stock icon on white background. Bankruptcy, financial market crash icon for your web site design, logo, app, UI. graph chart down trend symbol. chart going down sign. Stock decrease vectors Red arrow going down stock icon on white background. Bankruptcy, financial market crash icon for your web site. Red arrow going down stock icon on white background. Bankruptcy, financial market crash icon for your web site design, logo, app, UI. graph chart down trend symbol.chart going down sign.
Free with trial A bold red 3D curved arrow pointing downwards. This symbolizes a decrease in profits, economic recession, stock market crash, and negative financial trends in a business context. Stock decrease vectors Red 3D Curved Arrow Pointing Down Representing Market Crash and Financial Loss. A bold red 3D curved arrow pointing downwards. This symbolizes a decrease in profits, economic recession, stock market crash, and negative financial trends in a business context.
Free with trial Red glowing line graph with scattered particles illustrating financial decline, economic crisis, recession, or stock market crash. Stock decrease illustrations Falling red data line showing market crash. Red glowing line graph with scattered particles illustrating financial decline, economic crisis, recession, or stock market crash
Free with trial Price and discount, cost reduction, profit growth financial strategy line icon set. Increase and decrease, optimization of price, competition thin black and red outline symbols vector illustration. Stock decrease vectors Price and discount, cost reduction, profit growth financial strategy line icon set
Free with trial Technological geometric vector illustration showing blue polygonal arrow aimed downwards. Modern digital art piece depicting financial decrease or direction using crystal triangulation technique. Stock decrease vectors Abstract low poly blue arrow pointing down on dark background representing decline. Technological geometric vector illustration showing blue polygonal arrow aimed downwards. Modern digital art piece depicting financial decrease or direction using crystal triangulation technique
Free with trial The image displays two bar graphs representing the stock market activities of buying and selling. The left graph, labeled 'BUY', shows a pyramid structure with increasing bars from bottom to top, indicating a rise in buying activities. The right graph, labeled 'SELL', shows a pyramid structure with decreasing bars from top to bottom, indicating a rise in selling activities. Stock decrease illustrations Stock market buy and sell graphs. The image displays two bar graphs representing the stock market activities of buying and selling. The left graph, labeled 'BUY', shows a pyramid structure with increasing bars from bottom to top, indicating a rise in buying activities. The right graph, labeled 'SELL', shows a pyramid structure with decreasing bars from top to bottom, indicating a rise in selling activities
Free with trial Stock market chart displaying data and financial analysis. Green and red candles show trading on background. Investment indicators and performance trends. Stock decrease illustrations Stock market chart data and financial analysis. Stock market chart displaying data and financial analysis. Green and red candles show trading on background. Investment indicators and performance trends
Free with trial A display of financial data with charts, graphs, and statistics showing market trends and analysis details. Stock decrease illustrations Financial data charts showcasing stock market trends. A display of financial data with charts, graphs, and statistics showing market trends and analysis details
Free with trial Close-up of a man holding a tablet showing a stock market crash graph. The image represents financial loss, economic recession, and investment risks. Stock decrease illustrations Analyzing Stock Market Downturn on Tablet Device. Close-up of a man holding a tablet showing a stock market crash graph. The image represents financial loss, economic recession, and investment risks
Free with trial Illustration of stock market losses. Bankrupt financial information concept with arrows pointing down. Stock market correction concept. Descending trading graph. Stock decrease vectors Illustration of stock market losses. Bankrupt financial information concept with arrows pointing down. Stock market correction
Free with trial Gold coins with arrows and graphs pointing up or down. Financial growth. Market decline. Crisis and recession. Statistics chart. Finance success. Increase or decrease cash infographic. Vector concept. Stock decrease vectors Gold coins with arrows and graphs pointing up or down. Financial growth. Market decline. Crisis and recession. Statistics chart
Free with trial A detailed financial chart showing a downward trend in stock prices, represented by red candlesticks and a downward arrow. Stock decrease illustrations Downward stock market trend with red candlesticks. A detailed financial chart showing a downward trend in stock prices, represented by red candlesticks and a downward arrow
Free with trial Red 3d arrow going down stock icon on white background. Bankruptcy, financial market crash icon for your web site design, logo, app, UI. graph chart downtrend symbol. chart going down sign. Stock decrease vectors Red 3d arrow going down stock icon on white background. Bankruptcy, financial market crash icon for your web site design
Free with trial A close-up view of a red stock market chart displaying a strong downward trend. Candlestick bars and a fluctuating line graph indicate a significant decline in stock prices. Red arrows point downwards, emphasizing the negative movement. The background is dark with a subtle grid pattern and a bright light source on the left. Stock decrease illustrations Red Stock Market Chart Showing Downward Trend graph. A close-up view of a red stock market chart displaying a strong downward trend. Candlestick bars and a fluctuating line graph indicate a significant decline in stock prices. Red arrows point downwards, emphasizing the negative movement. The background is dark with a subtle grid pattern and a bright light source on the left
Free with trial Scale with illustrations of cash and home stocks. The concept of inflation. Stock Illustration. Home price is decrease. Stock decrease vectors Scale with illustrations of cash and home stocks. The concept of inflation. Stock Illustration
Free with trial A detailed red financial graph illustrates a sharp downward trend in stock prices. Candlestick bars and a wavy line graph show a significant decline, with red arrows reinforcing the negative movement. The dark background features a grid, and a bright light emanates from the left side of the image. Stock decrease illustrations Red Financial Graph with Falling Stock Prices stock market. A detailed red financial graph illustrates a sharp downward trend in stock prices. Candlestick bars and a wavy line graph show a significant decline, with red arrows reinforcing the negative movement. The dark background features a grid, and a bright light emanates from the left side of the image
Free with trial This dynamic digital artwork displays a vibrant abstract representation of a financial stock market trading chart. Featuring prominent candlestick bars in shades of orange and green, alongside a delicate line graph, it conveys concepts of market volatility, data analytics, and economic trends. Stock decrease illustrations Abstract financial stock market graph with trading candlesticks and line chart, digital data visualization. This dynamic digital artwork displays a vibrant abstract representation of a financial stock market trading chart. Featuring prominent candlestick bars in shades of orange and green, alongside a delicate line graph, it conveys concepts of market volatility, data analytics, and economic trends.
Free with trial This abstract financial graph visually represents a significant economic downturn or market decline. A prominent, bold red arrow sharply points downwards across a blue grid background, symbolizing loss, recession, or a negative trend. A lighter blue fluctuating line also shows a general downward trajectory, indicating market volatility or a secondary metric. This impactful illustration is ideal for conveying concepts of financial crisis, business failure, falling stock prices, or any situation involving a sharp decrease and poor performance. Stock decrease vectors Economic Downturn Graph with Red Arrow Showing Decline. This abstract financial graph visually represents a significant economic downturn or market decline. A prominent, bold red arrow sharply points downwards across a blue grid background, symbolizing loss, recession, or a negative trend. A lighter blue fluctuating line also shows a general downward trajectory, indicating market volatility or a secondary metric. This impactful illustration is ideal for conveying concepts of financial crisis, business failure, falling stock prices, or any situation involving a sharp decrease and poor performance.
Free with trial Red 3d arrow going down stock icon on white background. Bankruptcy, financial market crash icon for your web site design, logo, app, UI. graph chart downtrend symbol. chart going down sign. Stock decrease vectors Red 3d arrow going down stock icon on white background. Bankruptcy, financial market crash icon for your web site design, logo. Red 3d arrow going down stock icon on white background. Bankruptcy, financial market crash icon for your web site design, logo, app, UI. graph chart downtrend symbol.chart going down sign.
Free with trial Red 3d arrow going down stock icon on white background. Bankruptcy, financial market crash icon for your web site design, logo, app, UI. graph chart downtrend symbol. chart going down sign. Stock decrease vectors Red 3d arrow going down stock icon on white background. Bankruptcy, financial market crash icon for your web site design
Free with trial Red 3d arrow going down stock icon on white background. Bankruptcy, financial market crash icon for your web site design, logo, app, UI. graph chart downtrend symbol. chart going down sign. Stock decrease vectors Red 3d arrow going down stock icon on white background. Bankruptcy, financial market crash icon for your web site design
Free with trial A 3D illustration of a financial chart showing a dramatic downward trend. A large red arrow points sharply down over a series of declining blue bar graphs, symbolizing a stock market crash, economic recession, or business failure. The background features complex data and grids, representing financial analysis and market data. This image is perfect for concepts related to economic crisis, investment loss, financial risk, bankruptcy, and negative business reports. Stock decrease illustrations Stock Market Crash Financial Graph. A 3D illustration of a financial chart showing a dramatic downward trend. A large red arrow points sharply down over a series of declining blue bar graphs, symbolizing a stock market crash, economic recession, or business failure. The background features complex data and grids, representing financial analysis and market data. This image is perfect for concepts related to economic crisis, investment loss, financial risk, bankruptcy, and negative business reports.
Free with trial A 3D illustration of a red arrow pointing downward on a graph, indicating a decline or negative trend in business, finance, or economy. The image represents a decrease or loss in value, and can be used to symbolize a crisis, recession, or failure. Stock decrease illustrations A red arrow pointing downward on a graph indicating a decline. A 3D illustration of a red arrow pointing downward on a graph, indicating a decline or negative trend in business, finance, or economy. The image represents a decrease or loss in value, and can be used to symbolize a crisis, recession, or failure.
Free with trial A clean, minimalist icon representing the stock market. The image features a bull and a bear, symbolizing market trends, with a rising green arrow indicating an upward trend. The design is enclosed in a circular frame, suitable for financial reports, investment presentations, or business infographics. The simple line art style makes it versatile for various applications. Stock decrease illustrations Stock Market Bull and Bear Trend Icon. A clean, minimalist icon representing the stock market. The image features a bull and a bear, symbolizing market trends, with a rising green arrow indicating an upward trend. The design is enclosed in a circular frame, suitable for financial reports, investment presentations, or business infographics. The simple line art style makes it versatile for various applications.
Free with trial Close-up of neatly stacked coins, arranged in an ascending and descending pattern, symbolizing financial growth, savings, and investment progress. The blurred background features a dynamic financial market chart with glowing lines, representing stock market trends, economic data, or cryptocurrency fluctuations. This image effectively illustrates concepts of wealth management, business success, risk, and the fluctuating nature of the global economy. It's ideal for financial articles, presentations, and advertisements related to banking, investment, budgeting, and economic analysis. Stock decrease illustrations Financial Growth Concept with Stacks of Coins and Stock Market Chart. Close-up of neatly stacked coins, arranged in an ascending and descending pattern, symbolizing financial growth, savings, and investment progress. The blurred background features a dynamic financial market chart with glowing lines, representing stock market trends, economic data, or cryptocurrency fluctuations. This image effectively illustrates concepts of wealth management, business success, risk, and the fluctuating nature of the global economy. It's ideal for financial articles, presentations, and advertisements related to banking, investment, budgeting, and economic analysis.
Free with trial A visual representation of a stock market candlestick chart is depicted with a downward trend. The chart features alternating red and green candlesticks, indicating price fluctuations. A subtle shadow is cast on the white background, adding depth to the financial data visualization. Stock decrease illustrations Downward Trending Stock Market Candlestick Chart with Red and Green Bars and Shadow finance. A visual representation of a stock market candlestick chart is depicted with a downward trend. The chart features alternating red and green candlesticks, indicating price fluctuations. A subtle shadow is cast on the white background, adding depth to the financial data visualization
Free with trial An abstract representation of a stock market decline is illustrated through a sharply descending red line graph against a dark, grid-like background. The red hues emphasize the severity of the drop, suggesting financial loss. Numerical data points faintly accompany the visual. This image was generat. Stock decrease illustrations Red Stock Decline. An abstract representation of a stock market decline is illustrated through a sharply descending red line graph against a dark, grid-like background. The red hues emphasize the severity of the drop, suggesting financial loss. Numerical data points faintly accompany the visual. This image was generat
Free with trial Flat illustration of technical analysis with a magnifying glass on a yellow background. Stock market correction concept. Bankrupt financial information. Descending trading graph. Stock decrease vectors Flat illustration of technical analysis with a magnifying glass on a yellow background. Stock market correction concept. Bankrupt
Free with trial Economic downturn, financial challenges, loss, stock management, economy, recession. Downward arrow, black briefcase and containers on a shelf. Economic downturn and financial challenges concept. Stock decrease vectors Business Decline Concept with Briefcase, Downward Arrow, and Containers on Shelf. Economic downturn, financial challenges, loss, stock management, economy, recession. Downward arrow, black briefcase and containers on a shelf. Economic downturn and financial challenges concept
Free with trial A thick, red, zigzagging line, potentially a stock chart, is superimposed over a dark background with glowing green and red data points and lines. Image. Stock decrease illustrations Red Zigzag Line Overlaying Financial Data. A thick, red, zigzagging line, potentially a stock chart, is superimposed over a dark background with glowing green and red data points and lines. Image
Free with trial A prominent red arrow pointing downwards, symbolizing a decline or loss, set against a backdrop of a digital stock market chart with various financial figures and graphs. Stock decrease illustrations Red Arrow Pointing Downwards on Stock Market Chart. A prominent red arrow pointing downwards, symbolizing a decline or loss, set against a backdrop of a digital stock market chart with various financial figures and graphs
Free with trial A vibrant red arrow dramatically points downwards, symbolizing a significant decline or loss, set against a blurred background of financial stock market charts and numbers, all bathed in a red hue. Stock decrease illustrations Red Arrow Pointing Downwards with Stock Market Chart Background. A vibrant red arrow dramatically points downwards, symbolizing a significant decline or loss, set against a blurred background of financial stock market charts and numbers, all bathed in a red hue
Free with trial Set line Mobile stock trading, Contract money and pen and Global economic crisis on seamless pattern. Vector. Stock decrease illustrations Set line Mobile stock trading, Contract money and pen and Global economic crisis on seamless pattern. Vector.
Free with trial A dynamic image of a digital stock market ticker screen displaying financial data. The background is filled with red, downward-pointing arrows and negative numbers, symbolizing a bearish market, recession, or economic downturn. In stark contrast, a single, large, bright green arrow points upwards, representing growth, success, profit, and recovery. This powerful visual metaphor illustrates a single stock's success or a broader economic turnaround amidst widespread losses. It's perfect for concepts related to investment strategy, financial analysis, market volatility, and economic hope. Stock decrease illustrations Stock Market Recovery and Growth Concept. A dynamic image of a digital stock market ticker screen displaying financial data. The background is filled with red, downward-pointing arrows and negative numbers, symbolizing a bearish market, recession, or economic downturn. In stark contrast, a single, large, bright green arrow points upwards, representing growth, success, profit, and recovery. This powerful visual metaphor illustrates a single stock's success or a broader economic turnaround amidst widespread losses. It's perfect for concepts related to investment strategy, financial analysis, market volatility, and economic hope.
Free with trial A dramatic visual representation of a stock market crash, featuring a downward trending red candlestick chart against a dark, grid-like background. Numbers and financial data are subtly visible, emphasizing the financial context. This image evokes feelings of loss, recession, and economic downturn, making it ideal for illustrating financial crises, market volatility, and investment risks. Stock decrease illustrations Red Stock Market Crash Chart. A dramatic visual representation of a stock market crash, featuring a downward trending red candlestick chart against a dark, grid-like background. Numbers and financial data are subtly visible, emphasizing the financial context. This image evokes feelings of loss, recession, and economic downturn, making it ideal for illustrating financial crises, market volatility, and investment risks.
Free with trial Bad stock market chart and sad bear. Stock decrease illustrations Bad stock market chart and sad bear
Free with trial A 3D render illustrating a concept of financial decline and economic recession. The image features a red bar chart with progressively shorter bars, indicating a downward trend. A bold, red arrow follows this negative trajectory, pointing sharply downwards. Set against a clean, neutral gray background, this graphic powerfully symbolizes concepts like business failure, stock market crash, investment loss, sales decrease, and economic crisis. It's a perfect visual for presentations, reports, and articles discussing financial downturns, poor performance, and negative growth. Stock decrease illustrations Financial Decline Graph with Red Arrow Down. A 3D render illustrating a concept of financial decline and economic recession. The image features a red bar chart with progressively shorter bars, indicating a downward trend. A bold, red arrow follows this negative trajectory, pointing sharply downwards. Set against a clean, neutral gray background, this graphic powerfully symbolizes concepts like business failure, stock market crash, investment loss, sales decrease, and economic crisis. It's a perfect visual for presentations, reports, and articles discussing financial downturns, poor performance, and negative growth.
Free with trial Stacked money gold coins with green up arrow and red down arrow, stock market trend icon, finance symbol, investment, profit, and loss, perfect for design and communication illustration. Stock decrease vectors Stacked money gold coins with green up arrow and red down arrow, stock market trend icon, finance symbol, investment, profit, and
Free with trial A dynamic, futuristic digital display showing a falling stock market chart. This detailed financial graph features glowing red candlestick patterns and line charts indicating a significant downward trend and high volatility. The image represents concepts like an economic crisis, bear market, financial recession, investment risk, and a stock market crash. It's an ideal visual for business reports, financial news, technology articles, and presentations on global economics, trading, or fintech, conveying a sense of urgency and downturn. Stock decrease illustrations Stock Market Crash and Financial Downturn Graph. A dynamic, futuristic digital display showing a falling stock market chart. This detailed financial graph features glowing red candlestick patterns and line charts indicating a significant downward trend and high volatility. The image represents concepts like an economic crisis, bear market, financial recession, investment risk, and a stock market crash. It's an ideal visual for business reports, financial news, technology articles, and presentations on global economics, trading, or fintech, conveying a sense of urgency and downturn.
Free with trial A 3D rendered candlestick stock market chart displays a downward trend. Green bars, indicating upward movement, are followed by red bars, signifying a decline. The chart is angled diagonally across a white background, with a subtle shadow cast beneath it, emphasizing the concept of financial loss or market downturn. Stock decrease illustrations Downward Trending Stock Market Candlestick Chart with Red and Green Bars on a White Background. A 3D rendered candlestick stock market chart displays a downward trend. Green bars, indicating upward movement, are followed by red bars, signifying a decline. The chart is angled diagonally across a white background, with a subtle shadow cast beneath it, emphasizing the concept of financial loss or market downturn
Free with trial An illustration of a simple line graph showing a decline or decrease, accompanied by an exclamation mark inside a triangle, indicating a warning, danger or risk. Suitable for topics like financial loss, market crash, or economic downturn. Stock decrease vectors Simple Line Decline Graph with Exclamation Mark Attention Icon Design. An illustration of a simple line graph showing a decline or decrease, accompanied by an exclamation mark inside a triangle, indicating a warning, danger or risk. Suitable for topics like financial loss, market crash, or economic downturn.
Free with trial A 3D rendered illustration of a stock market candlestick chart is shown against a light blue background. The chart displays a mix of red and green candlesticks, indicating price fluctuations. A prominent red arrow points downwards, signifying a market decline. A white zigzag line also charts a downward trend. To the right, a red exclamation mark and a red dot serve as a warning or alert symbol. Stock decrease illustrations 3D Rendered Stock Market Candlestick Chart with Falling Red Arrow and Exclamation Mark finance. A 3D rendered illustration of a stock market candlestick chart is shown against a light blue background. The chart displays a mix of red and green candlesticks, indicating price fluctuations. A prominent red arrow points downwards, signifying a market decline. A white zigzag line also charts a downward trend. To the right, a red exclamation mark and a red dot serve as a warning or alert symbol
Free with trial A close-up shot of a smartphone displaying a stock market chart, showing fluctuating prices. The dark theme enhances the visual impact of the pink graph line, generated by AI for a modern and sleek aesthetic. This image is perfect for illustrating financial technology, mobile trading, and investmen. Stock decrease illustrations Mobile Stock Market Chart. A close-up shot of a smartphone displaying a stock market chart, showing fluctuating prices. The dark theme enhances the visual impact of the pink graph line, generated by AI for a modern and sleek aesthetic. This image is perfect for illustrating financial technology, mobile trading, and investmen
Free with trial Financial crisis, economic downturn, bankruptcy concept. 3D blue glass bar chart icon with arrow down, recession graph. Falling price, decline profit or asset value, decrease in sales. 3D illustration. Stock decrease illustrations Financial crisis, economic downturn, bankruptcy concept. 3D blue glass bar chart icon with arrow down, recession graph. Falling
Free with trial Analyze the crash in the stock market crash. Learn from investment failure mistakes. Assess the damage from the business sector. Experts find the cause of the stock chart fall. Stock decrease vectors Analyze the crash in the stock market crash. Learn from investment failure mistakes. Assess the damage from the business
Free with trial Stylized data illustrates financial increase using dollar signs, bar graphs, and arrows. Some data trends down while other data trends up, showing potential profits and losses. Stock decrease illustrations Stock Market Data Shows Economic Growth and Potential Loss in the Future. Stylized data illustrates financial increase using dollar signs, bar graphs, and arrows. Some data trends down while other data trends up, showing potential profits and losses.
Free with trial Economic critical crisis concept. The bar garph on red background. Recession financial, cryptocurrency, gold, and the stock market. Losing money and cash. Bearish. Stock decrease vectors Economic critical crisis concept. The bar garph on red background. Recession financial, cryptocurrency, gold, and the stock market
Free with trial Stock market. The rise and fall of securities. Successful trading. Market trend up green and red down arrows, financial graphs. Business investment growth and loss arrow. Graph going up and down symbol vector illustration. Stock decrease vectors Stock market. The rise and fall of securities. Successful trading. Market trend up green and red down arrows, financial graphs.
Free with trial Stock market. The rise and fall of securities. Successful trading. Market trend up green and red down arrows, financial graphs. Business investment growth and loss arrow. Graph going up and down symbol vector illustration. Stock decrease vectors Stock market. The rise and fall of securities. Successful trading. Market trend up green and red down arrows, financial graphs.
Free with trial Stock market. The rise and fall of securities. Successful trading. Market trend up green and red down arrows, financial graphs. Business investment growth and loss arrow. Graph going up and down symbol vector illustration. Stock decrease vectors Stock market. The rise and fall of securities. Successful trading. Market trend up green and red down arrows, financial graphs.
Free with trial Stock market. The rise and fall of securities. Successful trading. Market trend up green and red down arrows, financial graphs. Business investment growth and loss arrow. Graph going up and down symbol vector illustration. Stock decrease vectors Stock market. The rise and fall of securities. Successful trading. Market trend up green and red down arrows, financial graphs.
Free with trial Stock market. The rise and fall of securities. Successful trading. Market trend up green and red down arrows, financial graphs. Business investment growth and loss arrow. Graph going up and down symbol vector illustration. Stock decrease vectors Stock market. The rise and fall of securities. Successful trading. Market trend up green and red down arrows, financial graphs.
Free with trial This image showcases three gold bars resting on a screen displaying a dynamic stock market chart, generated by AI. The scene is visually striking, suggesting the relationship between gold as an investment and market trends. The high-resolution image is perfect for illustrating financial articles o. Stock decrease illustrations Gold Bars & Stock Market Chart. This image showcases three gold bars resting on a screen displaying a dynamic stock market chart, generated by AI. The scene is visually striking, suggesting the relationship between gold as an investment and market trends. The high-resolution image is perfect for illustrating financial articles o
Free with trial A simple and modern silhouette illustration depicting a bull and a bear, representing the financial markets. Perfect for use in articles, presentations, or designs related to finance, investment, and the stock market. Stock decrease vectors Minimalist Silhouette Bull and Bear Symbol Illustration for Finance Concept. A simple and modern silhouette illustration depicting a bull and a bear, representing the financial markets. Perfect for use in articles, presentations, or designs related to finance, investment, and the stock market.
Free with trial Three large red arrows point downward, each featuring a white percentage symbol (%) centrally placed. The arrows have a glossy appearance and are equally spaced against a white background, symbolizing a decrease or reduction in percentage terms. Stock decrease illustrations Percentage Decrease: Three Red Down Arrows Stock Photo. Three large red arrows point downward, each featuring a white percentage symbol (%) centrally placed. The arrows have a glossy appearance and are equally spaced against a white background, symbolizing a decrease or reduction in percentage terms.
Free with trial A macro shot of a negative stock chart in the background and the symbol of the company next to the chart. Concept of declining profits and failure. Image is generated using AI. Stock decrease illustrations Stock Price Drop Symbol on Chart. A macro shot of a negative stock chart in the background and the symbol of the company next to the chart. Concept of declining profits and failure. Image is generated using AI
Free with trial This image showcases gleaming gold bars arranged on a digital screen displaying a dynamic stock market chart, generated by AI. The juxtaposition highlights the relationship between precious metals and financial markets, suggesting investment opportunities and market volatility. The image is visual. Stock decrease illustrations Gold Bullion & Stock Market Chart. This image showcases gleaming gold bars arranged on a digital screen displaying a dynamic stock market chart, generated by AI. The juxtaposition highlights the relationship between precious metals and financial markets, suggesting investment opportunities and market volatility. The image is visual
Free with trial Flat vector illustration of a dollar sign in a blue circle between orange and blue arrows pointing up and down. Conceptual icon for currency exchange, stock market volatility, and financial profit. Stock decrease vectors Flat vector illustration of a dollar sign in a blue circle between orange and blue arrows pointing up and down. Conceptual icon
Free with trial An troubled stock market investor holds the downward pointing arrow from a market chart in this 3-d illustration about investing. Stock decrease illustrations An troubled stock market investor holds the downward pointing arrow from a market chart
Free with trial Declining arrow and money bag visualizing economic loss, business downturn, or budget deficit. Ideal for financial issues, stock market analysis, recession trends, wealth management, business risks. Stock decrease vectors Downward Trend Arrow and Money Bag with Dollar Sign Representing Financial Loss or Economic Decline. Declining arrow and money bag visualizing economic loss, business downturn, or budget deficit. Ideal for financial issues, stock market analysis, recession trends, wealth management, business risks
Free with trial An abstract and futuristic visualization of a financial trading chart on a dark, cosmic background. The image features a candlestick graph transitioning from a volatile red phase into a clear bullish, upward trend in blue. This dynamic concept represents stock market growth, forex trading, cryptocurrency investment, and financial success. It's an ideal background for topics related to fintech, data analysis, economic recovery, and modern investment strategies, symbolizing progress and profitability in the digital economy. Stock decrease illustrations Futuristic Stock Market Trading Graph Background. An abstract and futuristic visualization of a financial trading chart on a dark, cosmic background. The image features a candlestick graph transitioning from a volatile red phase into a clear bullish, upward trend in blue. This dynamic concept represents stock market growth, forex trading, cryptocurrency investment, and financial success. It's an ideal background for topics related to fintech, data analysis, economic recovery, and modern investment strategies, symbolizing progress and profitability in the digital economy.
Free with trial The image displays a financial stock market chart with various colored candlesticks and multiple technical indicators overlaid on a grid background. Stock decrease illustrations Detailed financial stock market chart with technical indicators and price movements. The image displays a financial stock market chart with various colored candlesticks and multiple technical indicators overlaid on a grid background
Free with trial This image visually represents a financial decline or economic downturn. Several stacks of shiny gold coins are prominently featured, symbolizing wealth and financial assets. A large, bold red arrow points downwards, directly indicating a decrease or loss. The composition suggests a conceptual representation of falling stock prices, economic recession, or financial crisis. It's ideal for illustrating concepts related to investment losses, market crashes, or financial instability. Stock decrease illustrations Financial Downturn: Stacks of Gold Coins with Red Downward Arrow. This image visually represents a financial decline or economic downturn. Several stacks of shiny gold coins are prominently featured, symbolizing wealth and financial assets. A large, bold red arrow points downwards, directly indicating a decrease or loss. The composition suggests a conceptual representation of falling stock prices, economic recession, or financial crisis. It's ideal for illustrating concepts related to investment losses, market crashes, or financial instability.
Free with trial The image shows a stock market crash represented by a downward-sloping line graph against a backdrop of a galaxy filled with stars and nebulous clouds. the line graph, rendered in a light purple hue, indicates a significant decline, culminating in a sharp drop represented by an arrow pointing downwards. the background galaxy adds a dramatic and symbolic layer, suggesting a cosmic scale of economic downturn. Stock decrease illustrations Stock market crash in a galaxy background. the image shows a stock market crash represented by a downward-sloping line graph against a backdrop of a galaxy filled with stars and nebulous clouds. the line graph, rendered in a light purple hue, indicates a significant decline, culminating in a sharp drop represented by an arrow pointing downwards. the background galaxy adds a dramatic and symbolic layer, suggesting a cosmic scale of economic downturn.
Free with trial Stock Market Loss 3D Icon, Isolated on White Background. Stock decrease illustrations Stock Market Loss 3D Icon
Free with trial Vibrant financial decisions shown through floating digital market charts --chaos 55 --ar 16:9 --profile 8vfa4lb --v 7 Job ID: 73c43520-d3ac-4d75-940e-9fab8db6f1ed. Generative AI. Stock decrease illustrations Red Arrow Decrease on Stock Market Graph Showing Economic Downturn and Financial Decline. Vibrant financial decisions shown through floating digital market charts --chaos 55 --ar 16:9 --profile 8vfa4lb --v 7 Job ID: 73c43520-d3ac-4d75-940e-9fab8db6f1ed. Generative AI
Free with trial Red falling arrow and desperate businessman silhouette representing stock market crash, investment loss and financial crisis. Stock decrease illustrations Stock market crash showing a desperate businessman and red falling arrow on digital screen. Red falling arrow and desperate businessman silhouette representing stock market crash, investment loss and financial crisis
Free with trial Stock market crash showing market downturn with red graph and percentage sign. Stock decrease illustrations Red graph showing a stock market crash and downturn with percentage sign. Stock market crash showing market downturn with red graph and percentage sign
Free with trial The image displays a stylized representation of a stock market crash and subsequent recovery. a red neon line charts a sharp decline, culminating in a point of impact with sparks. the line then reflects upwards, indicating a rebound. the background is a dark, reflective surface, enhancing the neon glow. the right side of the image shows a blurred, bright room with window panes. the overall effect is a visual metaphor for financial volatility. Stock decrease illustrations Red neon stock market crash and recovery chart. the image displays a stylized representation of a stock market crash and subsequent recovery. a red neon line charts a sharp decline, culminating in a point of impact with sparks. the line then reflects upwards, indicating a rebound. the background is a dark, reflective surface, enhancing the neon glow. the right side of the image shows a blurred, bright room with window panes. the overall effect is a visual metaphor for financial volatility.
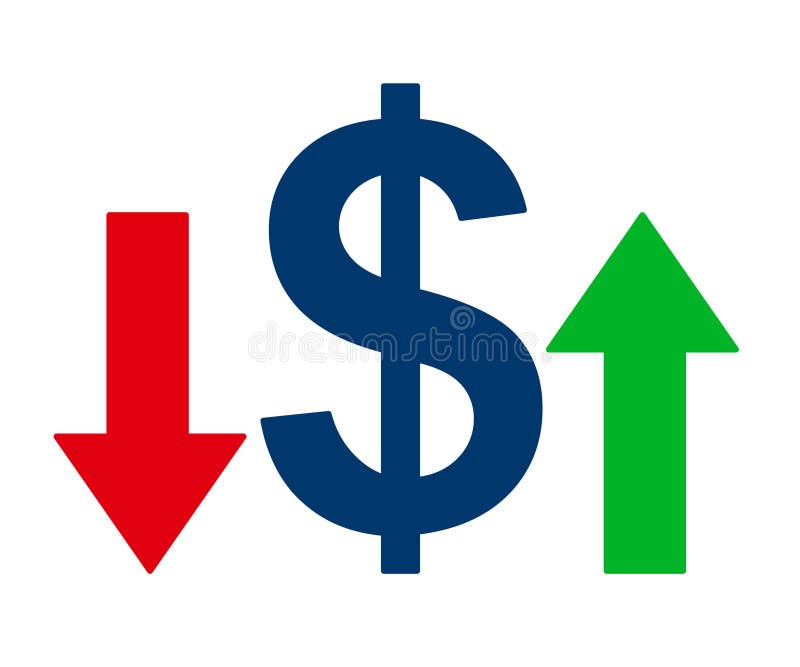
Free with trial Dollar sign with up and down arrows, capital raising and lowering, decrease or increase interest rates, investment concept - vector. Stock decrease vectors Dollar sign with up and down arrows, capital raising and lowering, decrease or increase interest rates, investment concept