Free with trial Black and white icon of a flip chart presenting a negative trend. Trend decrease vectors Flip chart presenting negative trend on a white background. Black and white icon of a flip chart presenting a negative trend
Free with trial A bold blue arrow points downwards, indicating a decrease or decline. Attached to the shaft of the arrow is a pink circular icon with a scalloped edge, featuring a white percentage symbol (%) in the center. The graphic is presented on a clean white background, suggesting a concept related to sales, discounts, price reduction, or a negative market trend. Trend decrease illustrations Blue Downward Arrow with Pink Percentage Discount Icon on White Background direction. A bold blue arrow points downwards, indicating a decrease or decline. Attached to the shaft of the arrow is a pink circular icon with a scalloped edge, featuring a white percentage symbol (%) in the center. The graphic is presented on a clean white background, suggesting a concept related to sales, discounts, price reduction, or a negative market trend
Free with trial Sharp downward trend line on graph red color freefall market Suitable for digital platforms. Trend decrease illustrations Sharp downward trend line on graph, red color, freefall, market. Sharp downward trend line on graph red color freefall market Suitable for digital platforms
Free with trial A businessman's hand guides a red downward trend line on a graph, symbolizing financial loss, market decline, or economic downturn. Trend decrease illustrations Businessman\'s Hand Guides Red Downward Trend Line on Graph. A businessman's hand guides a red downward trend line on a graph, symbolizing financial loss, market decline, or economic downturn
Free with trial Five white cubes with black downward arrows cascade diagonally on a blue background, suggesting a downward trend or decline. Trend decrease illustrations Downward trend white cubes with arrows on blue. Five white cubes with black downward arrows cascade diagonally on a blue background, suggesting a downward trend or decline
Free with trial A simple graphic depicting a downward trend with four circular data points and a prominent red arrow indicating the direction. Trend decrease illustrations Red downward trend line with circles and arrow. A simple graphic depicting a downward trend with four circular data points and a prominent red arrow indicating the direction
Free with trial Green marble bar graph showing a downward trend. Created with the help of Generative AI tools. Trend decrease illustrations Green marble bar graph showing a downward trend.
Free with trial Decrease isolated on transparent background. Trend decrease illustrations Decrease on transparent background. Decrease isolated on transparent background
Free with trial Three blue arrows are pointing down, symbolizing a negative trend or decline. Trend decrease vectors Three blue arrows pointing down representing negative trend. Three blue arrows are pointing down, symbolizing a negative trend or decline
Free with trial Sad face near a line graph showing a downward trend, a cloud, and a pencil. Ideal for business loss, analytics challenges, emotional impact, strategy planning, education, performance review simple. Trend decrease vectors Declining Trend Indicated by Sad Face, Line Graph, Cloud, and Pencil. Sad face near a line graph showing a downward trend, a cloud, and a pencil. Ideal for business loss, analytics challenges, emotional impact, strategy planning, education, performance review simple
Free with trial Image depicts a satisfaction dip alert with a warning sign and a trend satisfaction chart illustrating a decline. Trend decrease vectors Satisfaction Dip Alert - Warning Sign and Trend Satisfaction Chart. Image depicts a satisfaction dip alert with a warning sign and a trend satisfaction chart illustrating a decline
Free with trial Purple gradient bar graph is showing a negative trend with a downward arrow. Trend decrease vectors Purple gradient bar graph showing negative trend with downward arrow
Free with trial Hearts arranged in a downward trend chart, symbolizing decline in love, relationships, or emotional connection. Perfect for breakup, lost love, and relationship analysis concepts. Trend decrease vectors Hearts arranged in a downward trend chart, symbolizing decline in love, relationships, or emotional connection. Perfect for
Free with trial 3d illustration of four blue arrows pointing down representing a negative trend. Trend decrease illustrations Blue arrows pointing down showing negative trend. 3d illustration of four blue arrows pointing down representing a negative trend
Free with trial Metal arrow pointing downwards represents a decline or falling trend, useful for illustrating negative growth or regression in presentations and reports. Trend decrease illustrations Downward Trending Arrow Shows Decline or Decrease. Metal arrow pointing downwards represents a decline or falling trend, useful for illustrating negative growth or regression in presentations and reports
Free with trial A gleaming golden arrow points downwards in a sharp, angular zigzag shape. The metallic symbol is rendered in 3D and isolated on a clean white background, casting a subtle shadow. This icon represents concepts of decline, loss, or a downward trend in finance, business, or data. Trend decrease illustrations Golden Downward Trend Arrow Symbol Isolated on White Background image photo. A gleaming golden arrow points downwards in a sharp, angular zigzag shape. The. A gleaming golden arrow points downwards in a sharp, angular zigzag shape. The metallic symbol is rendered in 3D and isolated on a clean white background, casting a subtle shadow. This icon represents concepts of decline, loss, or a downward trend in finance, business, or data
Free with trial A 3D white bar chart shows a significant downward trend indicated by a sharp, angled arrow pointing downwards. The bars decrease in height from left to right, illustrating a concept of decline or loss. The clean white background emphasizes the minimalist design and the stark visual representation of negative growth. Trend decrease illustrations 3D White Bar Chart with Downward Trending Arrow on White Background graph decline. A 3D white bar chart shows a significant downward trend indicated by a sharp, angled arrow pointing downwards. The bars decrease in height from left to right, illustrating a concept of decline or loss. The clean white background emphasizes the minimalist design and the stark visual representation of negative growth
Free with trial Business graphic chart line, round and candlestick graph trend with glassmorphism effect. Transparent blur glass on gradient arrow vector set. Financial diagram on black. Marketing analytics. Trend decrease illustrations Business graphic chart line round and candlestick graph trend with glassmorphism effect vector set, arrows on black. Business graphic chart line, round and candlestick graph trend with glassmorphism effect. Transparent blur glass on gradient arrow vector set. Financial diagram on black. Marketing analytics
Free with trial A 3D icon featuring a dark square base with a gold border. On the base are four vertical bars of varying heights, colored in shades of beige and gold. A red zigzag line representing a downward trend is positioned above the bars, with its peak resting on the tallest bar and its subsequent segments descending. The icon is isolated on a clean white background. Trend decrease illustrations Downward financial trend graph icon chart business. A 3D icon featuring a dark square base with a gold border. On the base are four vertical bars of varying heights, colored in shades of beige and gold. A red zigzag line representing a downward trend is positioned above the bars, with its peak resting on the tallest bar and its subsequent segments descending. The icon is isolated on a clean white background
Free with trial An abstract, three-dimensional white graph line is depicted against a stark white background. The line features sharp, jagged peaks and valleys, clearly illustrating a significant downward trend or decline. The geometric form casts a subtle shadow, adding depth to the minimalist composition. This visual represents concepts of loss, negative performance, or economic downturn. Trend decrease illustrations Abstract 3D White Graph Line Showing Downward Trend on White Background chart data. An abstract, three-dimensional white graph line is depicted against a stark white background. The line features sharp, jagged peaks and valleys, clearly illustrating a significant downward trend or decline. The geometric form casts a subtle shadow, adding depth to the minimalist composition. This visual represents concepts of loss, negative performance, or economic downturn
Free with trial Business Bar Graph Downturn Arrow Icon Trend Falling. Trend decrease vectors Business Bar Graph Downturn Arrow Icon Trend Falling
Free with trial Concept of business crisis with a flip chart showing a negative trend line graph. Trend decrease illustrations Flip chart showing negative trend line graph on pink background. Concept of business crisis with a flip chart showing a negative trend line graph
Free with trial Up and down curved arrow chart icon. Business trend bar symbol illustration. Trend decrease vectors Up and down curved arrow chart icon. Business trend bar symbol
Free with trial Money value decrease icon linear thin line icon graphics set black and white. Trend decrease vectors Money value decrease icon vector set use for web ui or app. money value decrease icon linear thin line icon graphics set black and white
Free with trial Graph showing downward trend with a red arrow and blue bars. Digital interface background with a heartbeat line and hexagonal patterns, adding a modern touch to scene. Trend decrease illustrations Graph showing downward trend with a red arrow and blue bars
Free with trial Glowing orange chart illustrating a downward trend, with bar graph and line graph, set against a dark blue backdrop. Trend decrease illustrations Glowing Downward Trend Chart on Dark Blue Background. Glowing orange chart illustrating a downward trend, with bar graph and line graph, set against a dark blue backdrop
Free with trial White cubes with black downward arrows form a diagonal line on a yellow surface, suggesting a downward trend or direction. Trend decrease illustrations Downward trend arrow cubes on a bright yellow surface. White cubes with black downward arrows form a diagonal line on a yellow surface, suggesting a downward trend or direction
Free with trial A glowing neon arrow points downwards, symbolizing a negative trend or decline, set against a dark, textured wall and wet floor. Trend decrease illustrations Neon Downward Trend Arrow on Dark Textured Background. A glowing neon arrow points downwards, symbolizing a negative trend or decline, set against a dark, textured wall and wet floor
Free with trial A blackboard with a graph on it and a potted plant next to it. The graph shows a downward trend, which could represent a decrease in sales or a decline in a particular stock. Trend decrease illustrations A blackboard with a graph on it and a potted plant next to it
Free with trial Line chart is representing a decreasing trend in statistical data analysis. Trend decrease vectors Statistical data analysis with line chart showing decreasing trend. Line chart is representing a decreasing trend in statistical data analysis
Free with trial A series of black bar graphs are shown with downward-pointing arrows. Some arrows are green, indicating a slight decline, while others are red, signifying a more significant drop. The visual represents financial or data trends of decrease. Trend decrease illustrations Bar Graphs with Downward Arrows in Green and Red downward trend. A series of black bar graphs are shown with downward-pointing arrows. Some arrows are green, indicating a slight decline, while others are red, signifying a more significant drop. The visual represents financial or data trends of decrease
Free with trial Up and down arrow icon on black circle. Increase and decrease illustration concept. Trend decrease vectors Up and down arrow icon on black circle. Increase and decrease concept. Up and down arrow icon on black circle. Increase and decrease illustration concept
Free with trial Simple line art illustration of a dollar coin with a downward arrow, symbolizing decrease, loss, or negative financial trend. Represents economic decline, deflation, or a reduction in value. Trend decrease vectors Line Art Dollar Coin Decrease Arrow Simple Finance Icon. Simple line art illustration of a dollar coin with a downward arrow, symbolizing decrease, loss, or negative financial trend. Represents economic decline, deflation, or a reduction in value.
Free with trial A businessman in a suit draws a red downward trend line over a bar graph, illustrating cost reduction and financial decline. Trend decrease illustrations Businessman Drawing a Downward Trend Line on a Cost Graph. A businessman in a suit draws a red downward trend line over a bar graph, illustrating cost reduction and financial decline
Free with trial Decreasing line graph showing a negative trend, perfect for illustrating economic downturn or market decline. Trend decrease vectors Downward Trend Graph, Financial Crisis Icon Illustration. Decreasing line graph showing a negative trend, perfect for illustrating economic downturn or market decline.
Free with trial Simple line art illustration of a bar graph with a downward trend, symbolizing negative growth. Trend decrease illustrations Declining bar graph showing negative trend with arrow pointing down. Simple line art illustration of a bar graph with a downward trend, symbolizing negative growth
Free with trial A clear vector illustration of a steep downward slope with an arrow, symbolizing decline, decrease, negative trend, or downward movement. Ideal for financial reports, data analysis, risk management, or directional signs, conveying a specific trajectory or warning, vector design Generative AI. Trend decrease vectors Steep Downward Slope Arrow, Decline and Direction Icon, vector design Generative AI. A clear vector illustration of a steep downward slope with an arrow, symbolizing decline, decrease, negative trend, or downward movement. Ideal for financial reports, data analysis, risk management, or directional signs, conveying a specific trajectory or warning, vector design Generative AI
Free with trial A black outline vector icon of a light bulb with a downward trend graph, symbolizing idea decline, a failing concept, or innovation setback. Ideal for risk assessment, project analysis, or problem identification. Represents a decrease in viability or impact, a clear visual for negative trends in creative or business endeavors. vector design Generative AI. Trend decrease vectors Idea Decline Icon: Failing Concepts Innovation Setback, vector design Generative AI. A black outline vector icon of a light bulb with a downward trend graph, symbolizing idea decline, a failing concept, or innovation setback. Ideal for risk assessment, project analysis, or problem identification. Represents a decrease in viability or impact, a clear visual for negative trends in creative or business endeavors. vector design Generative AI
Free with trial Arrow trend-down icon vector set on white background. EPS 10. Trend decrease vectors Arrow trend-down icon
Free with trial Bar chart showing declining performance and negative trend. Trend decrease vectors Bar chart showing declining performance and negative trend
Free with trial Up and down arrow icon in rounded shape. Increase and decrease illustration concept. Trend decrease vectors Up and down arrow icon in rounded shape. Increase and decrease concept. Up and down arrow icon in rounded shape. Increase and decrease illustration concept
Free with trial Arrow trend-down icon. Trend decrease vectors Arrow trend-down vector icon set in black and white outlines. Arrow trend-down icon
Free with trial A 3D rendered bar chart displaying a downward trend. The bars, colored black, blue, green, yellow, and orange, decrease in height from left to right. A bold red arrow points downwards, diagonally across the bars, indicating a decline or loss. The chart is presented on a white background. Trend decrease illustrations 3D Bar Chart with Red Downward Arrow on White Background. A 3D rendered bar chart displaying a downward trend. The bars, colored black, blue, green, yellow, and orange, decrease in height from left to right. A bold red arrow points downwards, diagonally across the bars, indicating a decline or loss. The chart is presented on a white background
Free with trial Coins showing a decrease in value, symbolizing loss, reduction, and economic trends, isolated on a white background. Trend decrease illustrations Coins decrease isolated on white background. Coins showing a decrease in value, symbolizing loss, reduction, and economic trends, isolated on a white background
Free with trial 3d cylinder chart showing downward trend. Business and finance decline vector illustration. Trend decrease vectors 3d cylinder chart showing downward trend. Business and finance decline illustration
Free with trial Downward trend graph with bars and arrow, financial concept. Trend decrease vectors Downward trend graph with bars and arrow, financial concept
Free with trial Social media marketing graph showing decrease with thumbs up icons, isometric vector illustration. Trend decrease vectors Graph showing decrease in social media marketing with thumbs up icons. Social media marketing graph showing decrease with thumbs up icons, isometric vector illustration
Free with trial A glowing red arrow depicting a downward trend rests on a blue digital data background illustrating market decline. Trend decrease illustrations Illuminated Red Downward Trend Graph Shows Market Decline. A glowing red arrow depicting a downward trend rests on a blue digital data background illustrating market decline
Free with trial A bold black line graph icon showing a downward trend with an arrow. Symbolizes financial downturn, sales decrease, or negative performance metrics. Clear visual for business reports and data analysis indicating a decline value. vector design Generative AI. Trend decrease vectors Bold Decreasing Line Graph Icon Financial Downturn Data vector design Generative AI. A bold black line graph icon showing a downward trend with an arrow. Symbolizes financial downturn, sales decrease, or negative performance metrics. Clear visual for business reports and data analysis indicating a decline value. vector design Generative AI
Free with trial A simple black and white illustration of a downward trend graph, showing a decline. The graph is hand-drawn. Trend decrease illustrations Hand-drawn Black Downward Trend Graph on White Background. A simple black and white illustration of a downward trend graph, showing a decline. The graph is hand-drawn
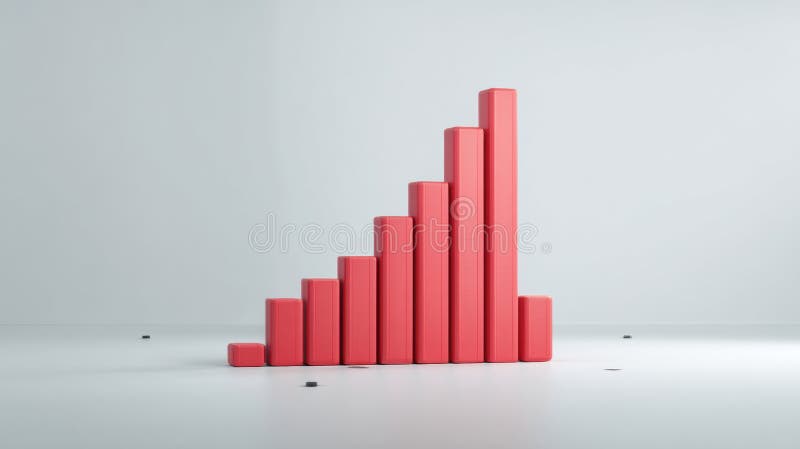
Free with trial This 3D rendered bar graph, generated by AI, visually represents a downward trend. The red bars progressively decrease in height, illustrating a clear decline. Perfect for illustrating concepts related to loss, decrease, or decline in presentations and reports. Trend decrease illustrations Declining Bar Graph. This 3D rendered bar graph, generated by AI, visually represents a downward trend. The red bars progressively decrease in height, illustrating a clear decline. Perfect for illustrating concepts related to loss, decrease, or decline in presentations and reports.
Free with trial A simple graphic depicting a downward pointing arrow, symbolizing a decrease or loss in financial value. The dollar sign is prominently featured. Trend decrease vectors Decreasing Dollar Value: Financial Loss Icon, Downward Trend. A simple graphic depicting a downward pointing arrow, symbolizing a decrease or loss in financial value. The dollar sign is prominently featured.
Free with trial A financial chart illustrating a bearish stock market trend, depicted by a series of red and green candlesticks forming a downward pattern, indicating a potential price decline. Trend decrease illustrations Bearish stock market trend with red and green candlesticks. A financial chart illustrating a bearish stock market trend, depicted by a series of red and green candlesticks forming a downward pattern, indicating a potential price decline
Free with trial Stacks of gold and silver coins are arranged on a light gray surface. A metallic silver arrow, forming an upward trend graph, emerges from the center of the composition, pointing upwards and to the right. The coins have ribbed edges and reflect light, creating a sense of value and financial movement. Trend decrease illustrations Gold and silver coins with upward trend arrow gold coins. Stacks of gold and silver coins are arranged on a light gray surface. A metallic silver arrow, forming an upward trend graph, emerges from the center of the composition, pointing upwards and to the right. The coins have ribbed edges and reflect light, creating a sense of value and financial movement
Free with trial Business bar graph with upward and downward arrow. Trend up and down icon vector in black circle. Trend decrease vectors Business bar graph with upward and downward arrow. Trend up and down icon in black circle
Free with trial Downward Trend Bar Chart with an Arrow in a Hand-Drawn Style. Trend decrease vectors Downward Trend Bar Chart with an Arrow in a Hand-Drawn Style
Free with trial Falling Bar Chart Graphic Indicating Downward Trend and Loss. Trend decrease vectors Falling Bar Chart Graphic Indicating Downward Trend and Loss
Free with trial Open laptop showing line chart, bar chart, and trend analysis with arrow indicating sales decline. Ideal for analytics, e-commerce, business strategy, financial forecasting, market analysis, sales. Trend decrease vectors Laptop screen displaying charts, analytics, and sale trend with downward arrow. Open laptop showing line chart, bar chart, and trend analysis with arrow indicating sales decline. Ideal for analytics, e-commerce, business strategy, financial forecasting, market analysis, sales
Free with trial This image shows a bar graph depicting a downward trend. A red arrow highlights the decrease in quarterly sales from Q1 to Q4, indicating negative growth and financial loss. Trend decrease illustrations Declining Bar Graph with Red Arrow Depicts Sales Performance. This image shows a bar graph depicting a downward trend. A red arrow highlights the decrease in quarterly sales from Q1 to Q4, indicating negative growth and financial loss.
Free with trial A simple yet impactful vector illustration of an orange line graph showing a downward trend, representing a decrease or negative performance. This graphic is perfect for financial dashboards, stock market analysis, business presentations, or statistical reports. It clearly conveys declining metrics and critical data points, vector design Generative AI. Trend decrease vectors Orange Decreasing Line Graph Vector. Financial Market Drop Graphic, vector design Generative AI. A simple yet impactful vector illustration of an orange line graph showing a downward trend, representing a decrease or negative performance. This graphic is perfect for financial dashboards, stock market analysis, business presentations, or statistical reports. It clearly conveys declining metrics and critical data points, vector design Generative AI
Free with trial Down Downward Trend Chart Drop Line Bar Trending Data Statistic Graph Market Share Stock Line Outline Black White Vector Icon Sign Symbol Graphic Artwork. Trend decrease vectors Down Downward Trend Chart Drop Line Bar Trending Data Statistic Graph Market Share Stock Line Outline Black White Vector Icon
Free with trial A whiteboard displays a hand-drawn graph depicting a sharp downward trend in a market or economic indicator. Red markers highlight significant drops, illustrating a period of substantial decline. The graph suggests a potential crisis or recession. Trend decrease illustrations Declining Market Trend. A whiteboard displays a hand-drawn graph depicting a sharp downward trend in a market or economic indicator. Red markers highlight significant drops, illustrating a period of substantial decline. The graph suggests a potential crisis or recession.
Free with trial This dynamic 3D render visualizes financial growth and market trends. A series of green bars represents increasing values, overlaid by a prominent green arrow pointing upwards, symbolizing success and positive performance. Contrasting this, a red arrow also indicates a trend, though its path suggests volatility or a different metric. Below, a complex network graph with interconnected nodes and lines adds a layer of data analysis and interconnectedness, suitable for concepts like investment, analytics, and economic forecasting. Trend decrease illustrations Upward Trend: Green and Red Arrows Over Bar Chart and Network Graph. This dynamic 3D render visualizes financial growth and market trends. A series of green bars represents increasing values, overlaid by a prominent green arrow pointing upwards, symbolizing success and positive performance. Contrasting this, a red arrow also indicates a trend, though its path suggests volatility or a different metric. Below, a complex network graph with interconnected nodes and lines adds a layer of data analysis and interconnectedness, suitable for concepts like investment, analytics, and economic forecasting.
Free with trial A 3D bar graph with a red line graph indicating a significant decrease, isolated on a clean white background. Trend decrease illustrations Bar graph showing downward trend isolated on white background. A 3D bar graph with a red line graph indicating a significant decrease, isolated on a clean white background
Free with trial Green bar chart showing a downward trend with a down arrow graphic. Trend decrease vectors Green bar chart showing a downward trend with a down arrow graphic
Free with trial Interest rates decrease concept: man with hammer smashing percentage sign on blue background for finance ai generated. Trend decrease vectors Interest rates decrease concept: man with hammer smashing percentage sign on blue background for finance ai generated
Free with trial A visual representation of negative financial performance, illustrating a declining trend in business or market data with a prominent red arrow indicating a downward movement. Trend decrease illustrations Bar chart showing a downward trend with a red arrow. A visual representation of negative financial performance, illustrating a declining trend in business or market data with a prominent red arrow indicating a downward movement
Free with trial A vibrant red arrow drawn with a dashed line and a solid tip, clearly indicating a downward trajectory or negative trend, perfect for financial or performance analysis. Trend decrease illustrations Red arrow symbol pointing downward indicating decline or trend. A vibrant red arrow drawn with a dashed line and a solid tip, clearly indicating a downward trajectory or negative trend, perfect for financial or performance analysis
Free with trial Stock market graph displaying downward trend with red indicators. Generative AI. Trend decrease illustrations Stock market graph displaying downward trend with red indicators
Free with trial Growth and loss arrow icon on black circle. Increase and decrease sign symbol illustration. Trend decrease vectors Growth and loss arrow icon on black circle. Increase and decrease sign symbol
Free with trial Downward Trend Bar Chart Showing Losses with a Declining Red Arrow. Trend decrease vectors Downward Trend Bar Chart Showing Losses with a Declining Red Arrow
Free with trial A green zigzag arrow graph pointing downwards, symbolizing a decrease, decline, or downward trend. This can be used for financial charts showing a market drop or for any data visualization representing a reduction or loss. vector design Generative AI. Trend decrease vectors Green Arrow Graph Pointing Down for Financial and Data Trends, vector design Generative AI. A green zigzag arrow graph pointing downwards, symbolizing a decrease, decline, or downward trend. This can be used for financial charts showing a market drop or for any data visualization representing a reduction or loss. vector design Generative AI
Free with trial A 3D rendered icon depicting a downward trend, symbolizing financial decrease and economic challenges. Trend decrease illustrations Financial decline icon representing economic downturn and losses. A 3D rendered icon depicting a downward trend, symbolizing financial decrease and economic challenges
Free with trial An abstract icon featuring a line moving downwards, symbolizing a decline, negative trend, or decrease in value or performance. Useful in interfaces and graphics where a simple indicator of negative movement is needed without a full chart context, vector design Generative AI. Trend decrease vectors Abstract Downtrend Line Icon, Representing Negative Performance, vector design Generative AI. An abstract icon featuring a line moving downwards, symbolizing a decline, negative trend, or decrease in value or performance. Useful in interfaces and graphics where a simple indicator of negative movement is needed without a full chart context, vector design Generative AI
Free with trial A sharp vector illustration of a red downward-pointing arrow, symbolizing financial decline, losses, or a negative market trend. This impactful graphic is ideal for economic reports, business presentations, or any visual conveying a decrease in value or performance. vector design Generative AI. Trend decrease vectors Red Downward Arrow Financial Decline, vector design Generative AI. A sharp vector illustration of a red downward-pointing arrow, symbolizing financial decline, losses, or a negative market trend. This impactful graphic is ideal for economic reports, business presentations, or any visual conveying a decrease in value or performance. vector design Generative AI
Free with trial Red Arrow Points Downward Showing Decrease, Decline, or Loss Concept. Trend decrease illustrations Red Arrow Points Downward Showing Decrease, Decline, or Loss Concept
Free with trial Up and down arrow icon. Rising and falling sign symbol. Increase and decrease illustration concept. Trend decrease vectors Up and down arrow icon. Rising and falling sign symbol. Increase and decrease concept
Free with trial Red glowing arrow made of light and sparks indicates a downward trend. Financial graph showing fall in market value or business decline concept. Trend decrease illustrations Red glowing arrow made of light and sparks indicates a downward trend
Free with trial Steep downward trending line graph red arrow decrease devaluation Can be customized to fit various themes and styles. Trend decrease illustrations Steep downward trending line graph, red arrow , decrease, devaluation. Steep downward trending line graph red arrow decrease devaluation Can be customized to fit various themes and styles
Free with trial A clear vector illustration of a red downward trending line graph, symbolizing a decrease, decline, or negative performance. This icon is essential for financial reports, business presentations, data visualization, or any context indicating a reduction. Its simple, sharp design effectively communicates a downward trend in various metrics, vector design Generative AI. Trend decrease vectors Red Downward Trending Graph Line Icon, vector design Generative AI. A clear vector illustration of a red downward trending line graph, symbolizing a decrease, decline, or negative performance. This icon is essential for financial reports, business presentations, data visualization, or any context indicating a reduction. Its simple, sharp design effectively communicates a downward trend in various metrics, vector design Generative AI