Free with trial A sharp red arrow, angled downwards, indicating a significant decrease or negative trend. Isolated on a clean white background for clear visualization of the concept. Trend decrease illustrations Red arrow pointing down isolated on white background. A sharp red arrow, angled downwards, indicating a significant decrease or negative trend. Isolated on a clean white background for clear visualization of the concept
Free with trial Hand drawn bar graph shows decreasing trend with downward arrow illustration. Trend decrease vectors Hand drawn bar graph shows decreasing trend with downward arrow illustration
Free with trial Data analysis graphs with up and down arrow line icons set. Increase and reduction of economy or trend charts, price boost, stock market research thin black and red outline symbols vector illustration. Trend decrease vectors Data analysis graphs with up and down arrow, economy or trend charts line icons set. Data analysis graphs with up and down arrow line icons set. Increase and reduction of economy or trend charts, price boost, stock market research thin black and red outline symbols vector illustration
Free with trial A red arrow points downwards on a green field, symbolizing a negative trend against a backdrop of a city skyline and stormy weather, useful for illustrating economic downturns. Trend decrease illustrations Red Arrow Shows Downward Trend on Green Field with City and Storm. A red arrow points downwards on a green field, symbolizing a negative trend against a backdrop of a city skyline and stormy weather, useful for illustrating economic downturns
Free with trial This image showcases a collection of twenty distinct vector icons, each illustrating various representations of increase and decrease graphs. Trend decrease vectors Collection of Twenty Vector Icons Depicting Increase and Decrease Graphs. This image showcases a collection of twenty distinct vector icons, each illustrating various representations of increase and decrease graphs.
Free with trial Stock market chart showing a downward trend with red and green candlesticks indicating price fluctuations. A moving average line overlays the candlesticks. Volume bars at the bottom correlate with trading activity, mostly red, suggesting higher selling pressure. Vertical axis shows price levels, and horizontal axis depicts time. The chart originates from Cendlewe (Bearits). Candlestick shapes and colors represent price movements over time, with red indicating a decrease and green an increase. Trend decrease illustrations Dynamic stock market chart shows downward trend with red and green candlesticks and volume bars. Stock market chart showing a downward trend with red and green candlesticks indicating price fluctuations. A moving average line overlays the candlesticks. Volume bars at the bottom correlate with trading activity, mostly red, suggesting higher selling pressure. Vertical axis shows price levels, and horizontal axis depicts time. The chart originates from Cendlewe (Bearits). Candlestick shapes and colors represent price movements over time, with red indicating a decrease and green an increase.
Free with trial Hand drawn bar chart illustration showing downward trend with arrow. Trend decrease vectors Hand drawn bar chart illustration showing downward trend with arrow
Free with trial This image features a striking red neon-style line graph on a black background, symbolizing decline, decrease, or downward trend in data visualization. Ideal for business, finance, and analytics concepts, it visually represents performance drops or negative growth in a modern, eye-catching manner. Trend decrease illustrations Red Neon Declining Graph Line Icon for Business Data Visualization. This image features a striking red neon-style line graph on a black background, symbolizing decline, decrease, or downward trend in data visualization. Ideal for business, finance, and analytics concepts, it visually represents performance drops or negative growth in a modern, eye-catching manner.
Free with trial A bold red arrow points downward, suggesting a negative trend or a fall. Trend decrease illustrations A bright red arrow curves downwards indicating a decline or decrease. A bold red arrow points downward, suggesting a negative trend or a fall
Free with trial Red arrow pointing down diagonally, a direction indicator in 3d rendering. The arrow symbolizes decline, decrease, or a negative trend. Trend decrease vectors Red arrow pointing down diagonally, direction indicator, 3d rendering. Red arrow pointing down diagonally, a direction indicator in 3d rendering. The arrow symbolizes decline, decrease, or a negative trend.
Free with trial Wooden blocks spell out the word RISK, with a downward arrow indicating a decrease or negative trend. Trend decrease illustrations Wooden blocks spelling risk with downward arrow symbolizing decline. Wooden blocks spell out the word RISK, with a downward arrow indicating a decrease or negative trend
Free with trial Simple bar graph showing downward trend with arrow, decline in progress. Trend decrease vectors Simple bar graph showing downward trend with arrow, decline in progress
Free with trial A falling graph displayed on an easel, isolated on a white background. The image represents a negative trend, indicating decline in business or finance. Trend decrease vectors Illustration of falling graph on easel isolated on transparent background, showing negative trend. A falling graph displayed on an easel, isolated on a white background. The image represents a negative trend, indicating decline in business or finance
Free with trial A red arrow indicates a downward trend over a colorful bar graph, isolated on a clean white background. Trend decrease illustrations Red downward trend arrow over bar chart isolated on white background. A red arrow indicates a downward trend over a colorful bar graph, isolated on a clean white background
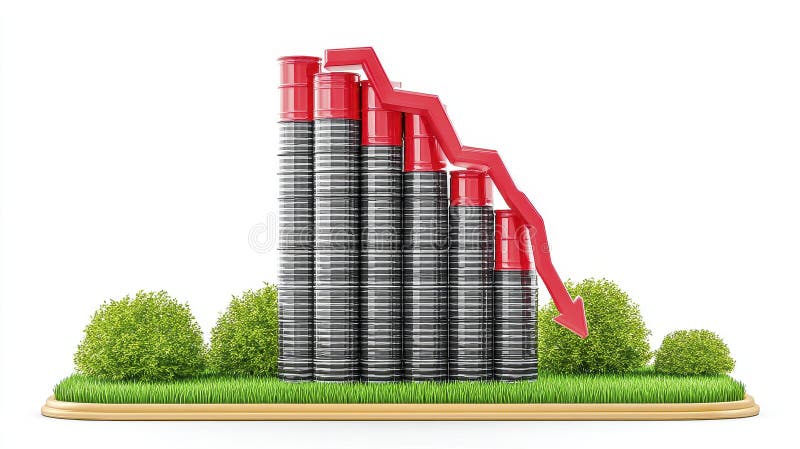
Free with trial 3D rendering of a bar graph showing a decline in production, represented by black and red cylinders on a grassy surface. The downward trend is emphasized by a red arrow AI generative. Trend decrease illustrations Declining Production 3D Render of Bar Graph Showing a Downward Trend. 3D rendering of a bar graph showing a decline in production, represented by black and red cylinders on a grassy surface. The downward trend is emphasized by a red arrow AI generative
Free with trial Glowing Candlestick Chart Depicting Downward Trend in Market Generative AI Illustration. Trend decrease illustrations Glowing Candlestick Chart Depicting Downward Trend in Market
Free with trial Decrease vector icon on the white background. EPS 10. Trend decrease vectors Decrease thin line vector icon set. Decrease vector icon on the white background. EPS 10
Free with trial Decrease vector icon on the white background. EPS 10. Trend decrease vectors Decrease thin line vector icon set. Decrease vector icon on the white background. EPS 10
Free with trial Decrease vector icon on the white background. EPS 10. Trend decrease vectors Decrease thin line vector icon set. Decrease vector icon on the white background. EPS 10
Free with trial Decrease vector icon on the white background. EPS 10. Trend decrease vectors Decrease thin line vector icon set. Decrease vector icon on the white background. EPS 10
Free with trial Decrease vector icon on the white background. EPS 10. Trend decrease vectors Decrease thin line vector icon set. Decrease vector icon on the white background. EPS 10
Free with trial Decrease vector icon on the white background. EPS 10. Trend decrease vectors Decrease thin line vector icon set. Decrease vector icon on the white background. EPS 10
Free with trial Decrease vector icon on the white background. EPS 10. Trend decrease vectors Decrease thin line vector icon set. Decrease vector icon on the white background. EPS 10
Free with trial Decrease vector icon on the white background. EPS 10. Trend decrease vectors Decrease thin line vector icon set. Decrease vector icon on the white background. EPS 10
Free with trial Decrease vector icon on the white background. EPS 10. Trend decrease vectors Decrease thin line vector icon set. Decrease vector icon on the white background. EPS 10
Free with trial Decrease vector icon on the white background. EPS 10. Trend decrease vectors Decrease thin line vector icon set. Decrease vector icon on the white background. EPS 10
Free with trial Decrease vector icon on the white background. EPS 10. Trend decrease vectors Decrease thin line vector icon set. Decrease vector icon on the white background. EPS 10
Free with trial Decrease vector icon on the white background. EPS 10. Trend decrease vectors Decrease thin line vector icon set. Decrease vector icon on the white background. EPS 10
Free with trial A 3D bar chart with a red arrow showing a downward trend. This image symbolizes economic decline, financial issues, and negative business performance. Trend decrease illustrations Red arrow showing downward trend on a 3D bar chart representing economic decline. A 3D bar chart with a red arrow showing a downward trend. This image symbolizes economic decline, financial issues, and negative business performance.
Free with trial Red graph showing decreasing trend on blue digital screen, concept of financial crisis and economy recession. Generative AI. Trend decrease illustrations Red stock market graph showing decreasing trend on blue digital screen. Red graph showing decreasing trend on blue digital screen, concept of financial crisis and economy recession. Generative AI
Free with trial A 3D rendering depicts a large red arrow pointing sharply downward, superimposed on a bar graph. The graph's bars are alternating gray and white, creating a textured pattern. The graph is positioned against a blurred backdrop of modern city skyscrapers. The overall color palette is cool, with the red arrow providing a stark contrast. The image suggests a negative economic trend or market decline. , generated by AI. Trend decrease illustrations Red Downward Trend Arrow on Gray White Bar Graph Cityscape Background. A 3D rendering depicts a large red arrow pointing sharply downward, superimposed on a bar graph. The graph's bars are alternating gray and white, creating a textured pattern. The graph is positioned against a blurred backdrop of modern city skyscrapers. The overall color palette is cool, with the red arrow providing a stark contrast. The image suggests a negative economic trend or market decline., generated by AI.
Free with trial A minimalist white 3D graph depicts a sharp downward trend. The graph has a jagged, stepped appearance, descending from left to right. It is rendered in isolation against a white background, casting a distinct shadow that emphasizes its three-dimensional form and the concept of decline. Trend decrease illustrations White 3D Downward Trend Graph on White Background with Shadow chart decline. A minimalist white 3D graph depicts a sharp downward trend. The graph has a jagged, stepped appearance, descending from left to right. It is rendered in isolation against a white background, casting a distinct shadow that emphasizes its three-dimensional form and the concept of decline
Free with trial Curved growth and decline chart icon in flat design. Business trend arrow symbol illustration. Trend decrease vectors Curved growth and decline chart icon in flat design. Business trend arrow symbol
Free with trial Increase decrease editable stroke line icons isolated on white background. Trend decrease vectors Increase decrease editable stroke line icons isolated on white background
Free with trial A 3D rendered red arrow curves downwards against a white background, symbolizing a decrease. Trend decrease illustrations A bold red arrow curves downwards indicating a decline or negative trend. A 3D rendered red arrow curves downwards against a white background, symbolizing a decrease
Free with trial A visual representation of data showing a decline over a period. The blue bars are arranged in descending order of height, each marked with numerical indicators, suggesting a decrease in value or quantity. Trend decrease illustrations Blue bar chart showing decreasing trend over time with numerical labels. A visual representation of data showing a decline over a period. The blue bars are arranged in descending order of height, each marked with numerical indicators, suggesting a decrease in value or quantity
Free with trial Business decline bar chart icon with long shadow. Decrease, loss, and financial collapse sign symbol vector. Trend decrease vectors Business decline bar chart icon with long shadow. Decrease, loss, and financial collapse sign symbol
Free with trial A bar chart with a clear downward trend, illustrating a decline. The isolated object is presented on a clean white background. Trend decrease illustrations Declining bar chart showing downward trend isolated on white background. A bar chart with a clear downward trend, illustrating a decline. The isolated object is presented on a clean white background
Free with trial Decrease vector icon on the white background. EPS 10. Trend decrease vectors Decrease thin line vector icon set. Decrease vector icon on the white background. EPS 10
Free with trial Decrease vector icon on the white background. EPS 10. Trend decrease vectors Decrease thin line vector icon set. Decrease vector icon on the white background. EPS 10
Free with trial Tariff and global recession concept, A downward trend graph symbolizing economic decline and challenges. Trend decrease illustrations Tariff and global recession concept, A downward trend graph symbolizing economic decline and challenges
Free with trial A bold red arrow curves downwards and points to the right, clearly symbolizing a trend of falling prices, negative growth, or a decline in performance. Ideal for financial or business contexts. Trend decrease illustrations Bright red downward arrow symbol indicating decline or decrease on white. A bold red arrow curves downwards and points to the right, clearly symbolizing a trend of falling prices, negative growth, or a decline in performance. Ideal for financial or business contexts
Free with trial This image captures a conceptual business planning session, suggesting a focus on market trend analysis, charting of progress and addressing potential declines. Trend decrease illustrations Conceptual business strategy session with downward trend and coffee break. This image captures a conceptual business planning session, suggesting a focus on market trend analysis, charting of progress and addressing potential declines
Free with trial Up and down graph chart icon. Growth increase and decrease sign. Graph or diagram with arrow going up and down. Vector illustration. Trend decrease vectors Up and down graph chart icon. Growth increase and decrease sign. Graph or diagram with arrow going up and down. Vector
Free with trial A glossy red arrow depicting a downward trend or decline, isolated on a clean white background. Trend decrease illustrations Red jagged downward trend arrow isolated on white background. A glossy red arrow depicting a downward trend or decline, isolated on a clean white background
Free with trial A bold red zigzag arrow points downward, visually representing a significant decrease in value, market downturn, or financial crisis. This symbol conveys negative trends and losses. Trend decrease illustrations Red downward arrow trend symbolizing financial decline stock market crash. A bold red zigzag arrow points downward, visually representing a significant decrease in value, market downturn, or financial crisis. This symbol conveys negative trends and losses
Free with trial Line chart illustrating an upward trend, featuring candlestick patterns and glowing dots against a dark background. The arrangement indicates a positive movement in data, reflecting investment and financial growth. Blue and orange tones highlight data points and lines, providing a visual contrast that enhances readability. The abstract style conveys a modern financial theme, emphasizing success and progress in stock markets. Trend decrease illustrations Dynamic stock market chart showing upward trend for investment and financial growth success concept. Line chart illustrating an upward trend, featuring. Line chart illustrating an upward trend, featuring candlestick patterns and glowing dots against a dark background. The arrangement indicates a positive movement in data, reflecting investment and financial growth. Blue and orange tones highlight data points and lines, providing a visual contrast that enhances readability. The abstract style conveys a modern financial theme, emphasizing success and progress in stock markets.
Free with trial Falling bar chart with downward arrow signifying decline and negative trend. Trend decrease vectors Falling bar chart with downward arrow signifying decline and negative trend
Free with trial Increase and Decrease in Rate icon vector image. Suitable for mobile apps, web apps and print media. Trend decrease vectors Increase and Decrease in Rate icon vector image.
Free with trial A person's open palm supports a glowing blue graph illustrating a downward trend for cost and an upward trend for quality against a dark background. Trend decrease illustrations Hand holding graph showing decreasing cost and increasing quality decrease. A person's open palm supports a glowing blue graph illustrating a downward trend for cost and an upward trend for quality against a dark background
Free with trial A three-dimensional line graph depicts a significant decrease in market value over a period of four months, indicated by a sharp downward trend. Trend decrease illustrations Sharp market value decline over time illustrated by a downward trend graph. A three-dimensional line graph depicts a significant decrease in market value over a period of four months, indicated by a sharp downward trend
Free with trial Growth and loss arrow icon on circle line. Increase and decrease sign symbol illustration. Trend decrease vectors Growth and loss arrow icon on circle line. Increase and decrease sign symbol
Free with trial Business financial graph showing decreasing trend of profits down with arrow. Trend decrease vectors Business financial graph showing decreasing trend of profits down with arrow
Free with trial A digital image featuring a bearish stock market trend with red and yellow colors on a dark background, concept of financial crisis. Trend decrease illustrations A digital image featuring a bearish stock market trend with red and yellow colors on a dark background, concept of financial
Free with trial Financial arrows up and down. Vector graph with green and red arrows. Chart with increase, decrease. Vector 10 EPS. Trend decrease vectors Financial arrows up and down. Vector graph with green and red arrows. Chart with increase, decrease.
Free with trial Falling bar chart with a downward trending line and arrow indicating decrease. Trend decrease vectors Falling bar chart with a downward trending line and arrow indicating decrease
Free with trial A close-up shot depicts a businessman's hands interacting with a holographic projection of a declining bar graph displayed on his laptop screen. The graph illustrates a significant downward trend, suggesting a negative financial performance or market downturn. The scene is set in a modern office environment, highlighted by a blurred potted plant in the background, adding a touch of natural. Trend decrease illustrations Businessman Analyzing Decreasing Stock Market Trend on Laptop, Financial Loss. A close-up shot depicts a businessman's hands interacting with a holographic projection of a declining bar graph displayed on his laptop screen. The graph illustrates a significant downward trend, suggesting a negative financial performance or market downturn. The scene is set in a modern office environment, highlighted by a blurred potted plant in the background, adding a touch of natural
Free with trial A whiteboard easel displays a bar graph with a downward trend and a red arrow indicating a decrease, isolated on a white background. Trend decrease illustrations Business bar chart showing decline isolated on white background. A whiteboard easel displays a bar graph with a downward trend and a red arrow indicating a decrease, isolated on a white background
Free with trial Trend chart icons. Rising and falling bars. Arrow and bar graph. Economic data symbols. EPS 10. Trend decrease vectors Trend chart icons. Rising and falling bars. Arrow and bar graph. Economic data symbols.
Free with trial Low Dollar Symbol black, Dollar price Low, Price decrease icon, commodity prices, interest rate decrease, Low Recession, financial growth web design. Trend decrease vectors Low Dollar Symbol black, Dollar price Low, Price decrease icon, commodity prices, interest rate decrease, Low Recession, financial
Free with trial Drawn down arrow trend graph depicting financial decline and economic downturn. Trend decrease vectors Drawn down arrow trend graph depicting financial decline and economic downturn
Free with trial Hand drawn bar graph showing a downward trend with an arrow indicating decline. Trend decrease vectors Hand drawn bar graph showing a downward trend with an arrow indicating decline
Free with trial Increase and reduction of economy or trend charts, price boost, stock market research thin black outline symbols vector illustration. Data analysis graphs with up and down arrow line icons set. Trend decrease vectors Data analysis graphs with up and down arrow, economy or trend charts line icons set. Increase and reduction of economy or trend charts, price boost, stock market research thin black outline symbols vector illustration. Data analysis graphs with up and down arrow line icons set.
Free with trial Pointing to Graph Showing the Trend of Fluctuations in Financial Stock Values , vibrant highlights. Trend decrease illustrations Pointing to Graph Showing the Trend of Fluctuations in Financial Stock Values
Free with trial Money movement icon. Dollar coin arrows. Financial flow Vector. Market trend symbol. EPS 10. Trend decrease vectors Money movement icon. Dollar coin arrows. Financial flow Vector. Market trend symbol.
Free with trial Sharp downward sloping line graph red arrow pointing down statistics dip trend Can be used as a banner or header image. Trend decrease illustrations Sharp downward sloping line graph, red arrow pointing down, statistics, dip, trend. Sharp downward sloping line graph red arrow pointing down statistics dip trend Can be used as a banner or header image
Free with trial Trend chart icon set. Growth and decline symbol. Up and down arrow with bar graph illustration. Trend decrease vectors Trend chart icon set. Growth and decline symbol. Up and down arrow with bar graph
Free with trial Downward arrows icon. Decreasing trend symbol. Vector arrow group. Economic downturn. EPS 10. Trend decrease vectors Downward arrows icon. Decreasing trend symbol. Vector arrow group. Economic downturn.
Free with trial Bar chart showing a steep downward trend and a descending arrow indicating decline. Trend decrease vectors Bar chart showing a steep downward trend and a descending arrow indicating decline
Free with trial Visualize financial decline with this striking depiction of a report showing falling tax revenue and a clear downward trend, perfect for economic analysis and business strategy content. Trend decrease vectors Business financial report shows declining tax revenue with downward trend arrow. Visualize financial decline with this striking depiction of a report showing falling tax revenue and a clear downward trend, perfect for economic analysis and business strategy content
Free with trial A striking red arrow curves downwards, suggesting a negative trend or decline. The brush stroke effect adds a sense of motion and urgency to the visual representation of a financial or business movement. Trend decrease illustrations Dynamic red arrow symbolizes downward trend or decline with dynamic brush stroke effect. A striking red arrow curves downwards, suggesting a negative trend or decline. The brush stroke effect adds a sense of motion and urgency to the visual representation of a financial or business movement
Free with trial Wooden block with a downward arrow symbol, representing a decline or decrease, sits on a rustic wooden surface. Trend decrease illustrations Wooden block with an arrow symbol pointing down represents a decrease or decline. wooden block with a downward arrow symbol, representing a decline or decrease, sits on a rustic wooden surface.
Free with trial Chart decline icon. Market loss symbol. Vector trend design. Black background shape. EPS 10. Trend decrease vectors Chart decline icon. Market loss symbol. Vector trend design. Black background shape.
Free with trial With red and orange bars, this financial chart displays a downward trend. 3D rendering. Trend decrease illustrations With red and orange bars, this financial chart displays a downward trend. 3D rendering
Free with trial A minimalist 3D bar chart rendered in white against a bright white background. The chart displays four bars of decreasing height, visually representing a sharp downward trend. A prominent white arrow, also pointing downwards, overlays the bars, emphasizing the decline. The composition is clean and abstract, suitable for representing financial or economic downturns. Trend decrease illustrations White 3D Bar Chart Showing a Sharp Downward Trend with Arrow on White Background graph. A minimalist 3D bar chart rendered in white against a bright white background. The chart displays four bars of decreasing height, visually representing a sharp downward trend. A prominent white arrow, also pointing downwards, overlays the bars, emphasizing the decline. The composition is clean and abstract, suitable for representing financial or economic downturns
Free with trial A small easel holds a drawing of a bar graph depicting a downward trend, symbolizing financial loss, economic recession, or a business downturn and market decrease. Trend decrease illustrations Miniature easel displays downturn graph showing financial decline trend business downturn. A small easel holds a drawing of a bar graph depicting a downward trend, symbolizing financial loss, economic recession, or a business downturn and market decrease
Free with trial Low Dollar Symbol, Dollar price Low, Price decrease icon, commodity prices, interest rate decrease, Low Recession, financial growth web design. Trend decrease vectors Low Dollar Symbol, Dollar price Low, Price decrease icon, commodity prices, interest rate decrease, Low Recession, financial
Free with trial Chart with a downward trend line and data points, a sad face emotion, and a pointing hand. Ideal for performance analysis, failure, problem-solving, disappointment, caution, decision-making simple. Trend decrease vectors Hand pointing at declining data chart with a sad face icon highlighting negative performance trend. Chart with a downward trend line and data points, a sad face emotion, and a pointing hand. Ideal for performance analysis, failure, problem-solving, disappointment, caution, decision-making simple