Free with trial A 3D rendered bar chart is displayed on a purple easel against a white background. The chart features a white board with a purple horizontal axis and three vertical purple bars of varying heights, indicating data or growth. The easel has three purple legs supporting the board. The overall aesthetic is clean and minimalist, suitable for business or educational contexts. Trend decrease illustrations A Purple 3D Rendered Bar Chart on an Easel Against a White Background graph statistics. A 3D rendered bar chart is displayed on a purple easel against a white background. The chart features a white board with a purple horizontal axis and three vertical purple bars of varying heights, indicating data or growth. The easel has three purple legs supporting the board. The overall aesthetic is clean and minimalist, suitable for business or educational contexts
Free with trial Three electronic devices are arranged on a sleek black surface, featuring a central tablet with a vibrant blue screen displaying a detailed line graph where green, pink, and other colored data points track decreasing metrics over time against a dark background illuminated by blue and white lights, creating a futuristic technological atmosphere perfect for concepts involving data analysis, business. Trend decrease illustrations Futuristic data analytics dashboard displayed on blue glowing tablet screen with colorful line graph visualization. Three electronic devices are arranged on a sleek black surface, featuring a central tablet with a vibrant blue screen displaying a detailed line graph where green, pink, and other colored data points track decreasing metrics over time against a dark background illuminated by blue and white lights, creating a futuristic technological atmosphere perfect for concepts involving data analysis, business
Free with trial This vibrant 3D rendering displays a dynamic bar chart alongside a detailed pie chart, illustrating impressive business growth and financial success. The colorful segments and bars clearly present data, making it perfect for presentations or reports. Trend decrease illustrations Colorful 3D Bar and Pie Chart Showing Business Growth and Financial Success. This vibrant 3D rendering displays a dynamic bar chart alongside a detailed pie chart, illustrating impressive business growth and financial success. The colorful segments and bars clearly present data, making it perfect for presentations or reports.
Free with trial Two bold, red 3D arrows are positioned vertically against a clean white background. One arrow points upwards, and the other points downwards, creating a clear visual representation of opposing directions or changes. A subtle shadow beneath them adds depth. Trend decrease illustrations Red Up and Down Arrows on White Background up arrow direction. Two bold, red 3D arrows are positioned vertically against a clean white background. One arrow points upwards, and the other points downwards, creating a clear visual representation of opposing directions or changes. A subtle shadow beneath them adds depth
Free with trial A vibrant orange 3D arrow icon is depicted against a white background. The arrow is stylized with fletching at the top and a sharp arrowhead pointing diagonally downwards. It casts a subtle shadow beneath it, giving it a sense of depth. Trend decrease illustrations Orange 3D Arrow Icon Pointing Downward with Transparent Background direction decline. A vibrant orange 3D arrow icon is depicted against a white background. The arrow is stylized with fletching at the top and a sharp arrowhead pointing diagonally downwards. It casts a subtle shadow beneath it, giving it a sense of depth
Free with trial A simple 3D illustration featuring a bright yellow upward-pointing arrow next to a soft pink downward-pointing arrow, symbolizing change, trends, or comparison. Isolated on white. Trend decrease illustrations Yellow up arrow and pink down arrow, isolated on white background. A simple 3D illustration featuring a bright yellow upward-pointing arrow next to a soft pink downward-pointing arrow, symbolizing change, trends, or comparison. Isolated on white
Free with trial A conceptual 3D illustration shows several black oil barrels. One barrel is tipped over, with black oil spilling out onto a white surface. A large red arrow points downwards towards the spilled oil, symbolizing a decline or crisis related to oil prices or production. The scene is set against a plain white background. Trend decrease illustrations Black Oil Barrels With One Tipped Over Spilling Oil And A Red Downward Arrow image photo. A conceptual 3D illustration shows several black oil barrels. One barrel is tipped over, with black oil spilling out onto a white surface. A large red arrow points downwards towards the spilled oil, symbolizing a decline or crisis related to oil prices or production. The scene is set against a plain white background
Free with trial A dynamic collection of hand-drawn financial and trend-related symbols rendered in a grunge, brush-stroke style. This illustration features various dollar signs, upward and downward arrows, a zig-zag chart line, checkmarks, and crosses. The black-on-white design conveys concepts of business growth, economic trends, profit, loss, success, and decision-making. Ideal for presentations, reports, infographics, or any design project requiring a raw, energetic visual representation of financial data and market fluctuations. Trend decrease vectors Grunge Hand Drawn Financial Growth and Decline Symbols Set. A dynamic collection of hand-drawn financial and trend-related symbols rendered in a grunge, brush-stroke style. This illustration features various dollar signs, upward and downward arrows, a zig-zag chart line, checkmarks, and crosses. The black-on-white design conveys concepts of business growth, economic trends, profit, loss, success, and decision-making. Ideal for presentations, reports, infographics, or any design project requiring a raw, energetic visual representation of financial data and market fluctuations.
Free with trial Red arrow for decline, green for progress. Stock market trends, statistics, and analytics. Falling and rising concepts, comparison. Trend decrease vectors Red and green downward arrows showing fall and growth isolated. Red arrow for decline, green for progress. Stock market trends, statistics, and analytics. Falling and rising concepts, comparison
Free with trial A red arrow drop-down with table on a white background. Businese concept. Trend decrease vectors A red arrow drop-down with table on white background. Businese concept
Free with trial Golden coins stack with arrow graph showing growth and decline. Financial success and loss concept. Business and finance illustration. Trend decrease vectors Golden coins stack with upward and downward trending graph. Golden coins stack with arrow graph showing growth and decline. Financial success and loss concept. Business and finance illustration
Free with trial A blue umbrella shelters a descending red graph line, represented by numerous small red arrows hanging from the umbrella. The scene is set against a dark, rainy backdrop. Trend decrease illustrations Blue Umbrella and Descending Red Graph with Arrows. A blue umbrella shelters a descending red graph line, represented by numerous small red arrows hanging from the umbrella. The scene is set against a dark, rainy backdrop
Free with trial The image shows a series of downward-pointing arrows of varying sizes and shades of gray, arranged in a staggered formation against a gradient red background. The arrows are aligned diagonally, creating a sense of movement and directionality from the upper left to the lower right of the image. The background transitions from a darker red at the bottom to a lighter hue at the top. Trend decrease illustrations Array of downward arrows against a red gradient background. The image shows a series of downward-pointing arrows of varying sizes and shades of gray, arranged in a staggered formation against a gradient red background. The arrows are aligned diagonally, creating a sense of movement and directionality from the upper left to the lower right of the image. The background transitions from a darker red at the bottom to a lighter hue at the top
Free with trial A simple line drawing depicts a person presenting a declining bar chart on a whiteboard, viewed through a magnifying. Trend decrease illustrations Decline Analysis Magnifying Glass on Falling Chart, Business. A simple line drawing depicts a person presenting a declining bar chart on a whiteboard, viewed through a magnifying.
Free with trial A single brown egg in a carton with a glowing red chart showing rising prices. Illustrates food inflation, commodity market volatility, and economic trends. Trend decrease illustrations Rising Egg Prices Concept with Red Financial Graph Overlay. A single brown egg in a carton with a glowing red chart showing rising prices. Illustrates food inflation, commodity market volatility, and economic trends
Free with trial Illustration of bear and arrow up. Ai illustration. Trend decrease illustrations Illustration of bear and arrow up Ai illustration
Free with trial This image features a bold percentage sign, representing discount, rate, or proportion. It is a clean and modern design suitable for various applications. Trend decrease vectors Vector art of bold percentage sign, a graphic representation of discount, rate, or proportion in a clean and modern design. This image features a bold percentage sign, representing discount, rate, or proportion. It is a clean and modern design suitable for various applications
Free with trial Easel holds a financial chart showing upward green and downward red arrows. Trend decrease vectors Easel Displaying Financial Chart With Green And Red Arrows. Easel holds a financial chart showing upward green and downward red arrows
Free with trial This image features a collection of data visualization icons, including charts, graphs, and organizational structures, perfect for illustrating data analysis and reporting. Trend decrease vectors Vector art of collection of data visualization icons showcasing various chart types and organizational structures for data. This image features a collection of data visualization icons, including charts, graphs, and organizational structures, perfect for illustrating data analysis and reporting
Free with trial Set of black and white vector icons showing falling bar charts, descending line graph, report with chart, presentation board, magnifying glass analyzing chart, and analytics dashboard with downward arrow. Generative AI. Trend decrease vectors Black and white falling bar chart line graph report and analytics icons. Set of black and white vector icons showing falling bar charts, descending line graph, report with chart, presentation board, magnifying glass analyzing chart, and analytics dashboard with downward arrow. Generative AI
Free with trial A large, glossy yellow arrow points directly downwards against a clean white background. The arrow has a smooth, rounded appearance, with highlights suggesting a reflective surface. The shadow beneath the arrow indicates it is slightly elevated from the background. Trend decrease illustrations Large Yellow Downward Arrow on White Background direction. A large, glossy yellow arrow points directly downwards against a clean white background. The arrow has a smooth, rounded appearance, with highlights suggesting a reflective surface. The shadow beneath the arrow indicates it is slightly elevated from the background
Free with trial This image illustrates investment risk management featuring a person holding a stock market chart with fluctuating red and blue bars overlaid with a percentage sign having upward and downward arrows This signifies market volatility financial risk assessment and decisions around investment strategies aimed at minimizing potential losses and maximizing returns in a fluctuating financial landscape. Trend decrease illustrations Investment Risk Management Volatility with Person Holding Stock Market Chart and Percentage Sign Symbol Displayed. This image illustrates investment risk management featuring a person holding a stock market chart with fluctuating red and blue bars overlaid with a percentage sign having upward and downward arrows This signifies market volatility financial risk assessment and decisions around investment strategies aimed at minimizing potential losses and maximizing returns in a fluctuating financial landscape
Free with trial Red falling bar chart with arrow, business decline concept, loss and failure symbol. Economic recession illustration. Trend decrease illustrations Red bar graph with declining arrow on white background grid. Red falling bar chart with arrow, business decline concept, loss and failure symbol. Economic recession illustration
Free with trial The image depicts a bar chart composed of eleven bars arranged horizontally. Each bar is colored with a gradient transitioning from red through orange, yellow, green, blue, and ending in purple. The bars start with a small height on the left, progressively increase to a peak in the middle, and then gradually decrease towards the right, illustrating a rise-and-fall pattern. The chart visually. Trend decrease illustrations Gradient bar chart showing progressive increase and decline. The image depicts a bar chart composed of eleven bars arranged horizontally. Each bar is colored with a gradient transitioning from red through orange, yellow, green, blue, and ending in purple. The bars start with a small height on the left, progressively increase to a peak in the middle, and then gradually decrease towards the right, illustrating a rise-and-fall pattern. The chart visually
Free with trial 3D rendering of various financial charts and graphs in red and pink tones on a white background. Concept of business analytics. Trend decrease illustrations 3D Rendering of financial charts and graphs on a white background. 3D Rendering. 3D rendering of various financial charts and graphs in red and pink tones on a white background. Concept of business analytics
Free with trial A vibrant, glossy green 3D arrow symbol is depicted against a stark white background. The arrow is stylized with a modern, geometric design, featuring a sharp point directed downwards. The shape suggests movement or a decline in status or value. The bright color and three-dimensional rendering make it a prominent graphic element, suitable for use in digital interfaces, presentations, or. Trend decrease illustrations Bright Green 3D Arrow Symbol Pointing Downwards on a White Background down arrow direction. A vibrant, glossy green 3D arrow symbol is depicted against a stark white background. The arrow is stylized with a modern, geometric design, featuring a sharp point directed downwards. The shape suggests movement or a decline in status or value. The bright color and three-dimensional rendering make it a prominent graphic element, suitable for use in digital interfaces, presentations, or
Free with trial Icons representing financial growth, decline, and trends. Perfect for business presentations and data visualization design. Trend decrease illustrations Four business growth and decline bar chart icons with arrows. Icons representing financial growth, decline, and trends. Perfect for business presentations and data visualization design
Free with trial Data visualization dashboard with various charts and graphs, immersive wallpaper background Generative AI. Trend decrease illustrations Data visualization dashboard with various charts and graphs
Free with trial Image depicts decreasing stacks of gold coins alongside a downward trending arrow, symbolizing financial downturn. Trend decrease illustrations Declining Financial Trend: A Visual Representation of Economic Downturn. Image depicts decreasing stacks of gold coins alongside a downward trending arrow, symbolizing financial downturn
Free with trial A pen rests on piece of paper with bar chart, suggesting data analysis, business planning, or financial reporting ,Generative ai. Trend decrease illustrations Pen and paper with bar chart, a visual representation of data analysis. A pen rests on piece of paper with bar chart, suggesting data analysis, business planning, or financial reporting ,Generative ai
Free with trial Financial growth and decline icon set with stacked coins and arrows design. Trend decrease illustrations Financial growth and decline icon set with stacked coins and arrows
Free with trial This image is a bar chart titled 'Decline Chart' showing the decline of a certain metric over a range. The x-axis represents different intervals, while the y-axis represents the quantity, ranging from 0 to 1000. There are three different data series represented by different colors: dark blue for 'Etb,' gray for 'Decline,' and orange for 'Dec Chart. ' Each interval on the x-axis shows a decline in. Trend decrease illustrations Visual representation of data decline over a specific range. This image is a bar chart titled 'Decline Chart' showing the decline of a certain metric over a range. The x-axis represents different intervals, while the y-axis represents the quantity, ranging from 0 to 1000. There are three different data series represented by different colors: dark blue for 'Etb,' gray for 'Decline,' and orange for 'Dec Chart.' Each interval on the x-axis shows a decline in
Free with trial Charts and Pen A magnifying glass rests atop financial charts with a pen, displaying analysis and review. Trend decrease illustrations Magnifying Glass Over Financial Reports and Charts. Charts and Pen A magnifying glass rests atop financial charts with a pen, displaying analysis and review
Free with trial A business report illustration featuring a graph and chart, ideal for presentations and documents, conveying financial data and analysis in a clear and concise manner. Trend decrease vectors Illustration of business report with graph and chart, showcasing financial data and analysis for presentations and documents. A business report illustration featuring a graph and chart, ideal for presentations and documents, conveying financial data and analysis in a clear and concise manner
Free with trial A poignant 3D rendering illustrates the concept of a bear market with a sad brown bear juxtaposed with a prominent red down arrow, symbolizing financial decline and an impending economic recession. This bearish depiction, set against a clean white background, powerfully communicates investment losses, a market crash, and the anxieties of a financial crisis. Perfect for visual representations of. Trend decrease illustrations Bear market concept depicted by sad brown bear with red down arrow illustrating financial decline and economic recession. A poignant 3D rendering illustrates the concept of a bear market with a sad brown bear juxtaposed with a prominent red down arrow, symbolizing financial decline and an impending economic recession. This bearish depiction, set against a clean white background, powerfully communicates investment losses, a market crash, and the anxieties of a financial crisis. Perfect for visual representations of
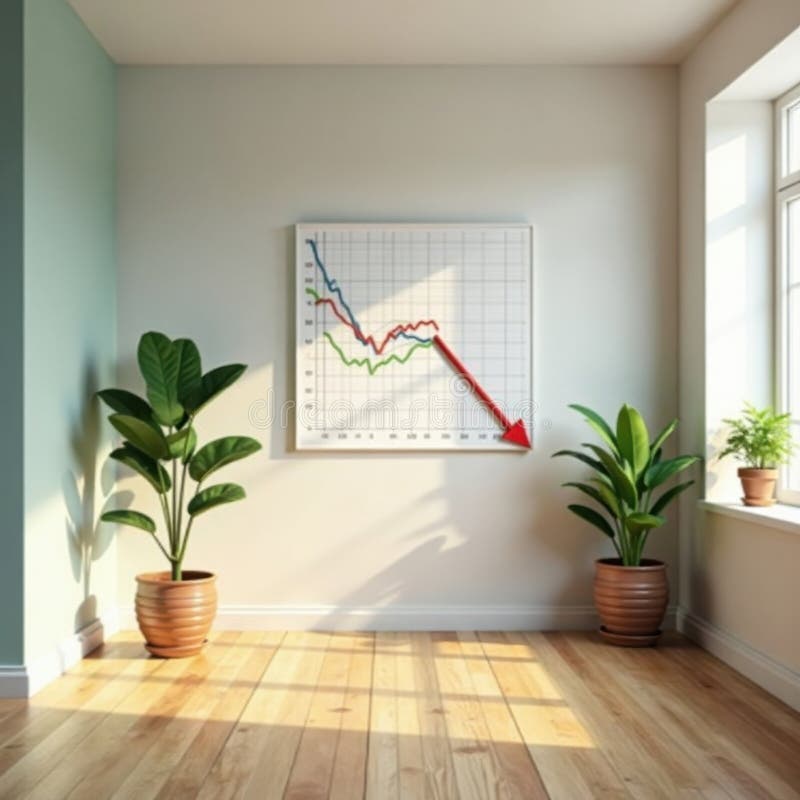
Free with trial Chart showing declining interest rates empty home interior economy chart home prices AI-generated for unique and creative designs. Trend decrease illustrations Chart showing declining interest rates, empty home interior, economy, chart, home prices. Chart showing declining interest rates empty home interior economy chart home prices AI-generated for unique and creative designs
Free with trial The a digital screen displaying a financial graph with a green upward trending line representing data growth. The screen white text and numerical values, including a 5746% increase and a 5. 66% decrease. The background is dark, and the graph glows with a neon green hue, suggesting a futuristic or tech-oriented style. The interface includes a title bar with options like Dashboard, Announcements, and. Trend decrease illustrations Green upward trending financial graph on dark digital screen. The a digital screen displaying a financial graph with a green upward trending line representing data growth. The screen white text and numerical values, including a 5746% increase and a 5.66% decrease. The background is dark, and the graph glows with a neon green hue, suggesting a futuristic or tech-oriented style. The interface includes a title bar with options like Dashboard, Announcements, and
Free with trial A colorful bar chart with upward and downward arrows and various icons, representing data and analytics. Trend decrease vectors Colorful Bar Chart with Downward Arrows and Icons graph data. A colorful bar chart with upward and downward arrows and various icons, representing data and analytics
Free with trial Downward blue arrow indicating a price drop for an orange oil barrel, representing market decline, economic recession, and reduced commodity values. Trend decrease illustrations Crude Oil Price Decline: Downward Blue Arrow on Orange Barrel. Downward blue arrow indicating a price drop for an orange oil barrel, representing market decline, economic recession, and reduced commodity values.
Free with trial Hand pointing at the smallest bar in a declining bar graph on a table. Trend decrease illustrations Hand pointing at the smallest bar in a declining bar graph on a table
Free with trial 3d tax illustration with decreasing bar chart and gold coins. Creative 3D tax concept showing financial decrease with coins and bar graph. Trend decrease illustrations 3d tax illustration with decreasing bar chart and gold coins. Creative 3D tax concept showing financial decrease with coins and bar graph
Free with trial Stacked coins decreasing with cost down concept and downward arrow symbolizing cost reduction expense control financial efficiency budget management business savings and profitability improvement. Trend decrease illustrations Stacked coins decreasing with cost down concept and downward arrow symbolizing cost reduction expense control financial efficiency
Free with trial A person in a blue shirt is interacting with a digital display showing various interest rate adjustments, including upward and downward arrows, percentage changes like 0. 25%, 3. 5%, and 5. Trend decrease illustrations Hand selecting interest rate changes on digital interface. A person in a blue shirt is interacting with a digital display showing various interest rate adjustments, including upward and downward arrows, percentage changes like 0.25%, 3.5%, and 5
Free with trial This image features a striking red arrow pointing downwards, with a unique zigzag pattern resembling a lightning bolt. The arrow is bold and eye-catching, set against a plain white background. Trend decrease illustrations A bold red downward arrow with a jagged lightning-like pattern. This image features a striking red arrow pointing downwards, with a unique zigzag pattern resembling a lightning bolt. The arrow is bold and eye-catching, set against a plain white background
Free with trial A single, three-dimensional red arrow with a glossy finish is depicted pointing downwards and slightly to the right. The object is isolated on a clean white background. created Ai. Trend decrease illustrations A glossy red arrow pointing downwards and slightly to the right isolated on white background. A single, three-dimensional red arrow with a glossy finish is depicted pointing downwards and slightly to the right. The object is isolated on a clean white background. created Ai
Free with trial Conceptual image representing cost cutting and financial analysis. Trend decrease illustrations Cost Cutting Analysis Scissors Cutting Downward Graph Under Magnifier. Conceptual image representing cost cutting and financial analysis.
Free with trial Visual representation of the indian economy facing a downturn, with a declining arrow and falling charts, indicating a potential recession and financial crisis. it highlights the challenges and risks. Trend decrease illustrations Indian economy crisis rupee symbol stock market crash recession financial downfall economic depression chart graph. visual representation of the indian economy facing a downturn, with a declining arrow and falling charts, indicating a potential recession and financial crisis. it highlights the challenges and risks.
Free with trial This image showcases a variety of editable vector icons related to business and finance. The icons include different types of graphs, charts, and gauges. There are line graphs, bar graphs, pie charts, and speedometer-style gauges. Each icon is depicted in a simple, clean line art style, making them easy to edit and incorporate into various design projects. Trend decrease illustrations Collection of editable vector icons for business and finance. This image showcases a variety of editable vector icons related to business and finance. The icons include different types of graphs, charts, and gauges. There are line graphs, bar graphs, pie charts, and speedometer-style gauges. Each icon is depicted in a simple, clean line art style, making them easy to edit and incorporate into various design projects
Free with trial A dark blue umbrella with red downward-pointing arrows hanging from it against a stormy sky. A red graph depicting a market decline is below the umbrella. Fallen leaves scatter the ground. Trend decrease illustrations Umbrella, Downward-Pointing Arrows, and Declining Market Graph. A dark blue umbrella with red downward-pointing arrows hanging from it against a stormy sky. A red graph depicting a market decline is below the umbrella. Fallen leaves scatter the ground
Free with trial Arrow down icon Black line art vector in black and white outline set collection sign. Trend decrease vectors Arrow down icon Thin line art collection. Arrow down icon Black line art vector in black and white outline set collection sign
Free with trial A graph illustrating the relationship between sleep, screen time, and mood over days and weeks. Trend decrease vectors Sleep and Screen Time Correlation Graph Showing Mood and Time Progression. A graph illustrating the relationship between sleep, screen time, and mood over days and weeks
Free with trial This image depicts a visual representation of financial growth and decline. On the left side, there are stacks of gold coins with a green upward arrow indicating growth. On the right side, a single stack of gold coins is shown with a red downward arrow indicating a decline. Trend decrease illustrations Financial growth and decline isolated on white background. This image depicts a visual representation of financial growth and decline. On the left side, there are stacks of gold coins with a green upward arrow indicating growth. On the right side, a single stack of gold coins is shown with a red downward arrow indicating a decline
Free with trial Black zigzag arrow pointing down with text DEVALUATION SHOCK on white background. Clear details and vibrant co. Trend decrease illustrations Devaluation shock zigzag arrow pointing down icon image photo. Black zigzag arrow pointing down with text DEVALUATION SHOCK on white background. Clear details and vibrant co
Free with trial A black downward trending arrow graph showing decline on a white background. Clear details and vibrant colors. Trend decrease illustrations Black downward trending arrow graph on white background chart. A black downward trending arrow graph showing decline on a white background. Clear details and vibrant colors
Free with trial A set of three simple, stylized arrows indicating positive growth, no change, and negative decline, placed on brown cardboard boxes. Perfect for financial, statistical, or business presentations to illustrate trends and changes clearly. Trend decrease illustrations Up and down percentage change arrows on brown cardboard boxes. A set of three simple, stylized arrows indicating positive growth, no change, and negative decline, placed on brown cardboard boxes. Perfect for financial, statistical, or business presentations to illustrate trends and changes clearly
Free with trial A 3D rendered image features a golden coin with the Indian Rupee symbol prominently displayed. Adjacent to the coin is a blue circular icon containing a white downward-pointing arrow, symbolizing a decline or loss in financial value. The composition is clean and isolated on a white background. Trend decrease illustrations Indian Rupee Symbol Coin with Downward Arrow Icon Indicating Financial Decline currency. A 3D rendered image features a golden coin with the Indian Rupee symbol prominently displayed. Adjacent to the coin is a blue circular icon containing a white downward-pointing arrow, symbolizing a decline or loss in financial value. The composition is clean and isolated on a white background
Free with trial A set of nine black icons depicts various graph representations on a white background. These include upward and downward trend lines, bar charts, and percentage symbols. Each icon visually portrays economic or statistical concepts, with arrows indicating direction�either upward or downward�to suggest growth or decline. The icons are simplistic and monochromatic, enhancing clarity and ease of understanding, suitable for financial, business, or educational contexts. Trend decrease vectors A set of Minimal silhouette icon set of percentage growth and decline. A set of nine black icons depicts various graph representations on a white background. These include upward and downward trend lines, bar charts, and percentage symbols. Each icon visually portrays economic or statistical concepts, with arrows indicating direction�either upward or downward�to suggest growth or decline. The icons are simplistic and monochromatic, enhancing clarity and ease of understanding, suitable for financial, business, or educational contexts.
Free with trial This digital image shows a glowing blue financial graph indicating market trends, growth, and data analysis. Trend decrease illustrations Blue digital financial graph representing increasing data and information. This digital image shows a glowing blue financial graph indicating market trends, growth, and data analysis
Free with trial A blue umbrella shields from numerous red downward-pointing arrows hanging below it, while a red downward-trending graph lies on the ground, illustrating a concept of mitigating downward trends or risk. Trend decrease illustrations Blue Umbrella, Red Downward Arrows, and Declining Graph. A blue umbrella shields from numerous red downward-pointing arrows hanging below it, while a red downward-trending graph lies on the ground, illustrating a concept of mitigating downward trends or risk
Free with trial Abstract graph with stars showing growth or decline illustration. Trend decrease vectors Abstract graph with stars showing growth or decline illustration
Free with trial A 3D rendered glossy green arrow pointing downwards is isolated on a white background. The arrow has a smooth, reflective surface, suggesting a plastic or polished material. This graphic element clearly indicates a downward direction or a negative trend. Trend decrease illustrations Glossy Green Downward Arrow Symbol Isolated on White Background Keywords: arrow, down arrow, green arrow, direction, downward. A 3D rendered glossy green arrow pointing downwards is isolated on a white background. The arrow has a smooth, reflective surface, suggesting a plastic or polished material. This graphic element clearly indicates a downward direction or a negative trend
Free with trial A line drawing depicts a magnifying glass focusing on a house icon and a descending bar graph, symbolizing a real. Trend decrease illustrations Real Estate Market Downturn House Value Decline Under Scrutiny. A line drawing depicts a magnifying glass focusing on a house icon and a descending bar graph, symbolizing a real.
Free with trial A vibrant green 3D rendered arrow icon is depicted against a clean white background. The arrow is stylized with a thick outline and a slightly abstract, angular design, clearly indicating a downward direction. The lighting casts a subtle shadow, giving the icon a sense of depth and volume. It is a simple yet impactful graphic element. Trend decrease illustrations 3D Rendered Green Arrow Icon Pointing Downwards on a White Background direction symbol. A vibrant green 3D rendered arrow icon is depicted against a clean white background. The arrow is stylized with a thick outline and a slightly abstract, angular design, clearly indicating a downward direction. The lighting casts a subtle shadow, giving the icon a sense of depth and volume. It is a simple yet impactful graphic element
Free with trial Red arrow going down stock icon on white background. Bankruptcy, financial market crash icon for your web site design, logo, app, UI. graph chart down trend symbol. chart going down sign. Trend decrease vectors Red arrow going down stock icon on white background. Bankruptcy, financial market crash icon for your web site design, logo, app
Free with trial Minimalist 3D conceptual illustration showing financial market trends with upward and downward directional arrows. Trend decrease illustrations Blue Business Growth and Decline Arrows on Staircase Background. Minimalist 3D conceptual illustration showing financial market trends with upward and downward directional arrows
Free with trial A declining bar graph with a sad face emoticon conveys financial loss. Flat design, business and data analytics theme. Trend decrease vectors Downward Trending Bar Graph with Sad Emoticon Represents Financial Loss and Negative Performance. A declining bar graph with a sad face emoticon conveys financial loss. Flat design, business and data analytics theme.
Free with trial Hand Pointing at Bearish Candlestick Chart, stock market concept, illustration. Trend decrease vectors Hand Pointing at Bearish Candlestick Chart, stock market concept
Free with trial Red bear figure with a declining stock market graph on a white background. Concept of market downturn. 3D Rendering. Trend decrease illustrations Red bear figure with declining stock market graph in the background. 3D Rendering. Red bear figure with a declining stock market graph on a white background. Concept of market downturn. 3D Rendering
Free with trial Black and white icon of a graph with a leaf, representing agriculture commodity trends. Trend decrease illustrations Agriculture commodity graph with leaf icon and text chart data. Black and white icon of a graph with a leaf, representing agriculture commodity trends
Free with trial Is a grid of black and white each representing a concept related to finance and economic hardship. The depict a broken pie chart, a wallet with money, falling dollar bills, a piggy bank with a dollar sign, a single coin, bar graphs showing decline, torn banknotes, a bar graph with a peak and a downward arrow, a bar graph with a downward trend, torn puzzle pieces, a dollar bill being torn, a bar. Trend decrease vectors Collection of black and white representing financial loss and debt. is a grid of black and white each representing a concept related to finance and economic hardship. The depict a broken pie chart, a wallet with money, falling dollar bills, a piggy bank with a dollar sign, a single coin, bar graphs showing decline, torn banknotes, a bar graph with a peak and a downward arrow, a bar graph with a downward trend, torn puzzle pieces, a dollar bill being torn, a bar
Free with trial The image depicts a declining bar graph with a red downward arrow, symbolizing an economic downturn. The graph is surrounded by stacks of coins, including gold and silver, indicating a financial crisis or recession. The overall scene illustrates the concept of economic decline and financial instability. Trend decrease illustrations Economic downturn illustrated by declining bar graph and coins. The image depicts a declining bar graph with a red downward arrow, symbolizing an economic downturn. The graph is surrounded by stacks of coins, including gold and silver, indicating a financial crisis or recession. The overall scene illustrates the concept of economic decline and financial instability
Free with trial Minimalist black arrows pointing up and down on white background, ideal for business, finance, or decision-making graphics in presentations, websites, and marketing materials. Trend decrease vectors Up and down black arrows direction sign minimalist vector icon. Minimalist black arrows pointing up and down on white background, ideal for business, finance, or decision-making graphics in presentations, websites, and marketing materials
Free with trial The image shows a series of red downward-pointing arrows arranged in a descending sequence from left to right. The arrows vary in size, with the first being the largest and each subsequent arrow being progressively smaller, indicating a decrease in magnitude or quantity. Trend decrease illustrations Decreasing sequence of red downward arrows on white background. The image shows a series of red downward-pointing arrows arranged in a descending sequence from left to right. The arrows vary in size, with the first being the largest and each subsequent arrow being progressively smaller, indicating a decrease in magnitude or quantity
Free with trial Minimalist black downward arrow symbol on clean white background, ideal for business, marketing, infographics, and directional signage in presentations and web design. Trend decrease illustrations Bold black curved arrow pointing downwards on white background. Minimalist black downward arrow symbol on clean white background, ideal for business, marketing, infographics, and directional signage in presentations and web design
Free with trial A dramatic 3D render depicts a large, glowing red downward arrow positioned directly above a scattered collection of metallic coins. The coins are spread across a dark, reflective surface, suggesting a loss or decline in wealth. The stark contrast between the bright arrow and the dark background, along with the scattered coins, visually communicates concepts of financial downturn, economic recession, market crash, or budget cuts. This image is ideal for illustrating financial challenges, investment losses, or economic instability. Trend decrease illustrations Red Downward Arrow Over Scattered Coins - Financial Crisis Concept. A dramatic 3D render depicts a large, glowing red downward arrow positioned directly above a scattered collection of metallic coins. The coins are spread across a dark, reflective surface, suggesting a loss or decline in wealth. The stark contrast between the bright arrow and the dark background, along with the scattered coins, visually communicates concepts of financial downturn, economic recession, market crash, or budget cuts. This image is ideal for illustrating financial challenges, investment losses, or economic instability.
Free with trial Abstract image of stock market graph represented by orange glowing line against dark blue background with swirling blue clouds. Fiery line financial data, volatility, market trends in. Trend decrease illustrations Abstract image of stock market graph represented by orange glowing line against dark blue background with swirling blue clouds.
Free with trial Bar chart with downward arrow icon. Financial crisis concept. Economy downturn and loss symbol vector. Trend decrease vectors Bar chart with downward arrow icon. Financial crisis concept. Economy downturn and loss symbol
Free with trial Red downward arrow pointing on clean background isolated white background. Trend decrease illustrations Red downward arrow pointing on clean background isolated white background
Free with trial Sharp downward sloping line graph red arrow pointing down analytics plunge Suitable for digital platforms. Trend decrease illustrations Sharp downward sloping line graph, red arrow pointing down, analytics, plunge. Sharp downward sloping line graph red arrow pointing down analytics plunge Suitable for digital platforms