Free with trial Declining Bar Chart with Downward Arrow Representing Economic Downturn and Financial Loss. Trend decrease vectors Declining Bar Chart with Downward Arrow Representing Economic Downturn and Financial Loss
Free with trial Illustration shows a worried businesswoman in front of a falling financial chart with red and green lines depicting economic decline, serious mood. Generative AI. Trend decrease vectors Businesswoman with declining financial graph showing economic downturn and loss trends vector illustration. Illustration shows a worried businesswoman in front of a falling financial chart with red and green lines depicting economic decline, serious mood. Generative AI
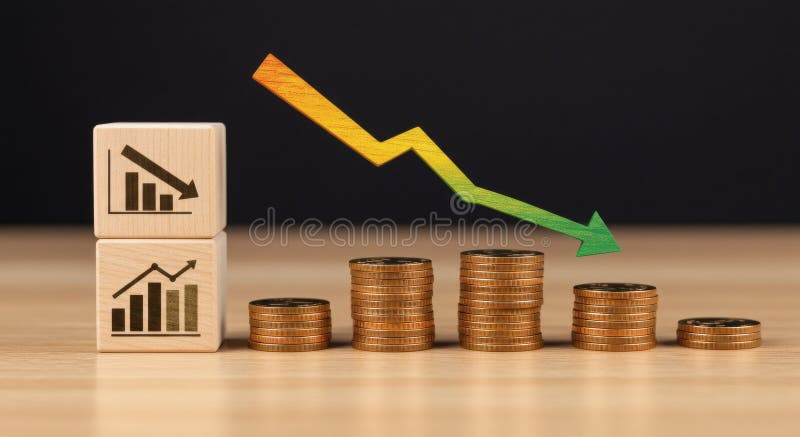
Free with trial Wooden Blocks Arranged with a Declining Graph and Arrow Pointing Down on a Red Background Symbolizing Market Analytics and Economic Downturn Concept for Business Finance and Investment Strategies generative ai. Trend decrease illustrations Wooden Blocks with Declining Graph and Arrow Representing Market Analytics for Economic Downturn. Wooden Blocks Arranged with a Declining Graph and Arrow Pointing Down on a Red Background Symbolizing Market Analytics and Economic Downturn Concept for Business Finance and Investment Strategies generative ai
Free with trial Growth decline graphs, market trends. Business performance symbols. Vector illustration. EPS 10. Stock image. Trend decrease vectors Growth decline graphs, market trends. Business performance symbols. Vector illustration. EPS 10.
Free with trial Financial business concept going bankrupt flat vector design. design vector illustration. Trend decrease vectors Financial concept going bankrupt flat vector design illustration. financial business concept going bankrupt flat vector design.design vector illustration
Free with trial Red graph shows plummeting house prices scattered coins coin scatter investment strategy Vector illustration. Trend decrease illustrations Red graph shows plummeting house prices; scattered coins , coin scatter, investment strategy. Red graph shows plummeting house prices scattered coins coin scatter investment strategy Vector illustration.
Free with trial A 3D figure holds its head in distress beneath a large red downward arrow, symbolizing loss, decline, or financial troubles. Generative AI. Trend decrease illustrations A 3D figure holds its head in distress beneath a large red downward arrow, symbolizing loss, decline, or financial troubles.
Free with trial A 3d rendering of a green bar graph with a red arrow pointing downwards and gold dollar coins. Trend decrease illustrations 3d rendering of a green bar graph with a downward trending red arrow and gold dollar coins. A 3d rendering of a green bar graph with a red arrow pointing downwards and gold dollar coins
Free with trial Loss chart outline icon in white and black colors. loss chart flat vector icon from business collection for web, mobile apps and ui. Trend decrease vectors Loss chart outline icon in white and black colors. loss chart flat vector icon from business collection for web, mobile apps and
Free with trial Financial business concept going bankrupt flat vector design. design vector illustration. Trend decrease vectors Financial concept going bankrupt flat vector design illustration. financial business concept going bankrupt flat vector design.design vector illustration
Free with trial 3D rendering of declining bar and line graphs on a grid background. Trend decrease illustrations 3D rendering of declining bar and line graphs on a grid background
Free with trial Financial chart displaying a series of candlestick patterns on a digital screen, used for stock data analysis. The chart features vertical bars in orange against a blue background with grid lines. Each candlestick represents price movements within a specific time frame, showcasing market trends. The background includes a blurred assortment of lights and other graphical elements, indicating a financial data interface, likely used for investment portfolio analysis and trading activities. Trend decrease illustrations Financial Chart And Stock Data Analysis For Investment Portfolio. Candle Stick Graph For Trade. Financial chart displaying a series of candlestick patterns on a digital screen, used for stock data analysis. The chart features vertical bars in orange against a blue background with grid lines. Each candlestick represents price movements within a specific time frame, showcasing market trends. The background includes a blurred assortment of lights and other graphical elements, indicating a financial data interface, likely used for investment portfolio analysis and trading activities.
Free with trial Declining bar chart with arrow pointing down depicts business loss, failure, negative trends. Trend decrease vectors Declining bar chart with arrow pointing down depicts business loss, failure, negative trends
Free with trial Falling red arrow illustrating financial downturn on dark grid drop business decline fall Suitable for digital platforms. Trend decrease illustrations Falling red arrow illustrating financial downturn on dark grid , drop, business decline, fall. Falling red arrow illustrating financial downturn on dark grid drop business decline fall Suitable for digital platforms
Free with trial Red textured arrows depict market fluctuations and business trends against a textured background symbolizes economic ups and downs, financial analysis, and investment opportunities with market statistics. Trend decrease illustrations Red arrows symbolizing fluctuations representing business trends on a textured background. red textured arrows depict market fluctuations and business trends against a textured background symbolizes economic ups and downs, financial analysis, and investment opportunities with market statistics
Free with trial A visual representation of decreasing percentages shown by three green arrows with percentage symbols, isolated on a white background. Trend decrease illustrations Three green downward pointing arrows with percentage symbols isolated on white background. A visual representation of decreasing percentages shown by three green arrows with percentage symbols, isolated on a white background
Free with trial Red candlestick graph showing falling stock market prices during trading session with warm lights in the foreground. Trend decrease illustrations Stock market crash showing falling prices during trading session. Red candlestick graph showing falling stock market prices during trading session with warm lights in the foreground
Free with trial Coins stacked on blocks with FED% printed, red arrow downwards Blurred financial background For Social Media Post Size. Trend decrease illustrations Coins stacked on blocks with FED% printed, red arrow downwards Blurred financial background
Free with trial Dramatic stock market crash with falling prices reflected in a digital chart during trading session. Trend decrease illustrations Stock market crash showing falling prices during trading session. Dramatic stock market crash with falling prices reflected in a digital chart during trading session
Free with trial A 3D rendered graphic depicts a bar chart with three vertical bars of varying heights: two blue bars flanking a taller yellow bar. At the top of the yellow bar, a central yellow sphere is connected by white rods to two smaller blue spheres, resembling a molecular structure or a network. The entire graphic is isolated on a white background, suggesting concepts of data analysis, growth, and. Trend decrease illustrations 3D Rendered Bar Chart with Connecting Spheres Representing Data Analysis graph statistics. A 3D rendered graphic depicts a bar chart with three vertical bars of varying heights: two blue bars flanking a taller yellow bar. At the top of the yellow bar, a central yellow sphere is connected by white rods to two smaller blue spheres, resembling a molecular structure or a network. The entire graphic is isolated on a white background, suggesting concepts of data analysis, growth, and
Free with trial The Red arrow Down on Business background 3d rendering. Trend decrease illustrations The Red arrow Down on Business background 3d rendering
Free with trial The Red arrow Down on Business background 3d rendering. Trend decrease illustrations The Red arrow Down on Business background 3d rendering
Free with trial The Red arrow Down on Business background 3d rendering. Trend decrease illustrations The Red arrow Down on Business background 3d rendering
Free with trial Crumbling bar chart made of clay or stone with broken tops and debris, symbolizing decline or instability in growth or progress. Trend decrease illustrations A broken bar chart made of clay or stone with a broken top and debris is a symbol of decline or instability. crumbling bar chart made of clay or stone with broken tops and debris, symbolizing decline or instability in growth or progress.
Free with trial The Red arrow Down on Business background 3d rendering. Trend decrease illustrations The Red arrow Down on Business background 3d rendering
Free with trial The Red arrow Down on Business background 3d rendering. Trend decrease illustrations The Red arrow Down on Business background 3d rendering
Free with trial The Red arrow Down on Business background 3d rendering. Trend decrease illustrations The Red arrow Down on Business background 3d rendering
Free with trial The Red arrow Down on Business background 3d rendering. Trend decrease illustrations The Red arrow Down on Business background 3d rendering
Free with trial The Red arrow Down on Business background 3d rendering. Trend decrease illustrations The Red arrow Down on Business background 3d rendering
Free with trial Colorful growth chart featuring orange and teal bars with upward and downward arrows on a clean white background representing progress decline business data trends and financial performance metrics. Trend decrease illustrations Colorful growth chart with orange and teal bars and upward and downward arrows on white background. colorful growth chart featuring orange and teal bars with upward and downward arrows on a clean white background representing progress decline business data trends and financial performance metrics
Free with trial A dramatic downward trending graph illustrates the global economic downturn and financial crisis. Red arrows emphasize the sharp decline in the global market, signifying instability, risk, and uncertainty for businesses and investors. Data visualization of a critical economic prediction, generated by AI. Trend decrease illustrations Global economic downturn recession financial crisis. A dramatic downward trending graph illustrates the global economic downturn and financial crisis. Red arrows emphasize the sharp decline in the global market, signifying instability, risk, and uncertainty for businesses and investors. Data visualization of a critical economic prediction, generated by AI.
Free with trial UK flag with a declining bar chart and down arrows, symbolizing decline in data, performance, or various national indicators in the country. Trend decrease illustrations Flag with a declining bar chart and down arrows
Free with trial Zambia flag with a declining bar chart and down arrows, symbolizing decline in data, performance, or various national indicators in the country. Trend decrease illustrations Flag with a declining bar chart and down arrows
Free with trial Yemen flag with a declining bar chart and down arrows, symbolizing decline in data, performance, or various national indicators in the country. Trend decrease illustrations Flag with a declining bar chart and down arrows
Free with trial Vietnam flag with a declining bar chart and down arrows, symbolizing decline in data, performance, or various national indicators in the country. Trend decrease illustrations Flag with a declining bar chart and down arrows
Free with trial Venezuela flag with a declining bar chart and down arrows, symbolizing decline in data, performance, or various national indicators in the country. Trend decrease illustrations Flag with a declining bar chart and down arrows
Free with trial Uruguay flag with a declining bar chart and down arrows, symbolizing decline in data, performance, or various national indicators in the country. Trend decrease illustrations Flag with a declining bar chart and down arrows
Free with trial Uzbekistan flag with a declining bar chart and down arrows, symbolizing decline in data, performance, or various national indicators in the country. Trend decrease illustrations Flag with a declining bar chart and down arrows
Free with trial USA flag with a declining bar chart and down arrows, symbolizing decline in data, performance, or various national indicators in the country. Trend decrease illustrations Flag with a declining bar chart and down arrows
Free with trial Ukraine flag with a declining bar chart and down arrows, symbolizing decline in data, performance, or various national indicators in the country. Trend decrease illustrations Flag with a declining bar chart and down arrows
Free with trial Uganda flag with a declining bar chart and down arrows, symbolizing decline in data, performance, or various national indicators in the country. Trend decrease illustrations Flag with a declining bar chart and down arrows
Free with trial Taiwan flag with a declining bar chart and down arrows, symbolizing decline in data, performance, or various national indicators in the country. Trend decrease illustrations Flag with a declining bar chart and down arrows
Free with trial UAE flag with a declining bar chart and down arrows, symbolizing decline in data, performance, or various national indicators in the country. Trend decrease illustrations Flag with a declining bar chart and down arrows
Free with trial Bar chart with decreasing orange bars and a downward red arrow illustrating financial decline. Trend decrease vectors Bar chart with decreasing orange bars and a downward red arrow illustrating financial decline
Free with trial Hand-drawn line chart doodle is showing grid backdrop and axis over gradient background, copy space. Data visualization, infographics, analytics, diagram, business, educational, minimalistic. Trend decrease illustrations Hand-drawn line chart doodle is showing grid backdrop and axis over gradient background, copy space
Free with trial Abstract digital illustration featuring blue and red bar charts and line graphs on a dark blue background. Orange and light blue points highlight data trends. The style is clean and modern. Trend decrease illustrations Abstract Financial Data Visualization Blue Red Charts Graphs Lines Points finance business. Abstract digital illustration featuring blue and red bar charts and line graphs on a dark blue background. Orange and light blue points highlight data trends. The style is clean and modern
Free with trial Illustration represents falling market prices. Stacks of coins against falling chart. Digital numbers. Bear market, price drop, stock market crash, financial loss crypto crash. Trend decrease illustrations Illustration represents falling market prices. Stacks of coins against falling chart. Digital numbers. Bear market, price drop
Free with trial Sad businessman sitting on a pile of coins with a downward arrow. Financial Instability concept. trend modern vector flat illustration. Trend decrease vectors Sad businessman sitting on a pile of coins with a downward arrow. Financial Instability concept.
Free with trial A single, glossy green arrow pointing directly downwards is depicted against a plain white background. The arrow has rounded edges and a smooth, reflective surface, giving it a modern and clean appearance. This icon commonly represents actions such as downloading, going down, or indicating a negative trend. Trend decrease illustrations Glossy Green Downward Arrow Icon on White Background image photo. A single, glossy green arrow pointing directly downwards is depicted against a plain white background. The arrow has rounded edges and a smooth, reflective surface, giving it a modern and clean appearance. This icon commonly represents actions such as downloading, going down, or indicating a negative trend
Free with trial A 3D rendered illustration features a large blue downward-pointing arrow positioned diagonally on a white background. Overlapping the arrow is a small pink circle containing a white percentage symbol. This visual effectively communicates concepts such as discounts, sales, price reductions, negative trends, or financial decline. Trend decrease illustrations Blue Downward Arrow with Pink Circle and Percentage Symbol on White Background image photo. A 3D rendered illustration features a large blue downward-pointing arrow positioned diagonally on a white background. Overlapping the arrow is a small pink circle containing a white percentage symbol. This visual effectively communicates concepts such as discounts, sales, price reductions, negative trends, or financial decline
Free with trial A financial chart displaying market analysis and business growth with increasing and decreasing trends. Trend decrease illustrations Financial chart showing growth and market analysis data isolated on transparent background. A financial chart displaying market analysis and business growth with increasing and decreasing trends.
Free with trial This vibrant pyramid stack of 3D cubes, meticulously crafted and isolated against a pristine white background, offers a striking and engaging visual element for business presentations and data storytelling. The gradual decrease in cube size from base to apex creates a compelling visual representation of hierarchical data, making complex information easily digestible for audiences of all. Trend decrease illustrations Dynamic 3D Cube Pyramid A Colorful Visual for Data Visualization and Business Presentations. This vibrant pyramid stack of 3D cubes, meticulously crafted and isolated against a pristine white background, offers a striking and engaging visual element for business presentations and data storytelling. The gradual decrease in cube size from base to apex creates a compelling visual representation of hierarchical data, making complex information easily digestible for audiences of all
Free with trial 3D Colorful Charts Magnifier Analysis, Data Visualization, Market Research ,chart,magnifying glass , This photo was created using generative AI. Trend decrease illustrations 3D Colorful Charts Magnifier Analysis, Data Visualization, Market Research ,chart,magnifying glass
Free with trial A red background features a globe overlaid with a falling stock market chart and downward-pointing arrows, symbolizing financial crisis and economic downturn. A global recession. Trend decrease illustrations Red background with globe and falling stock market chart and downward pointing arrows overlayed. A red background features a globe overlaid with a falling stock market chart and downward-pointing arrows, symbolizing financial crisis and economic downturn. A global recession.
Free with trial A striking red downward arrow is set against a clean, minimalist red background, illustrating a clear and impactful representation of decline or reduction in a contemporary design style. Trend decrease illustrations Red downward arrow on a minimalist red background, symbolizing decline in a modern design aesthetic. A striking red downward arrow is set against a clean, minimalist red background, illustrating a clear and impactful representation of decline or reduction in a contemporary design style.
Free with trial Image depicts falling market values using coins and a downward arrow. It symbolizes economic downturn and financial instability. Trend decrease illustrations Economic Downturn: Visual Representation of Decreasing Market Value and Financial Instability. Image depicts falling market values using coins and a downward arrow. It symbolizes economic downturn and financial instability
Free with trial Graph going Up and Down sign with blue arrows vector. Flat design vector illustration concept of sales bar chart symbol icon with arrow moving down and sales bar chart with arrow moving up. Trend decrease vectors Graph going Up and Down sign with blue arrows vector. Flat design vector illustration concept of sales bar chart symbol icon. Graph going Up and Down sign with blue arrows vector. Flat design vector illustration concept of sales bar chart symbol icon with arrow moving down and sales bar chart with arrow moving up.
Free with trial Declining bar chart with a downward arrow icon representing financial loss, crisis, and failure. Trend decrease vectors Declining bar chart with a downward arrow icon representing financial loss, crisis, and failure
Free with trial Hand drawn black and white illustration of a percent sign inside a circular arrow pointing down. Trend decrease vectors Hand drawn black and white illustration of a percent sign inside a circular arrow pointing down
Free with trial A green line graph displays fluctuating data points across five days, presented isolated on a clean white background. Trend decrease illustrations Green line graph showing fluctuating data trends over five days isolated on white background. A green line graph displays fluctuating data points across five days, presented isolated on a clean white background
Free with trial A minimalistic illustration features a diminishing stack of coins alongside a downward arrow, representing reduced spending. The design uses clean vector style and balanced white tones for clarity. Trend decrease illustrations Shrinking stack of coins with downward arrow indicating reduced spending and financial decline. A minimalistic illustration features a diminishing stack of coins alongside a downward arrow, representing reduced spending. The design uses clean vector style and balanced white tones for clarity
Free with trial A striking graph illustrates opposing trends one line sharply decreases while another rises, enveloped in warm orange hues that evoke energy and transformation. Trend decrease illustrations Dynamic Trends Displayed Through Contrasting Lines in Shades of Orange With a Vivid Background. A striking graph illustrates opposing trends one line sharply decreases while another rises, enveloped in warm orange hues that evoke energy and transformation
Free with trial A red stock market chart declines sharply against a blurred dark city background. This image illustrates a financial crisis and economic downturn, showing a dramatic fall in market values. Trend decrease illustrations Red stock market crash with bar chart and blurred city background depicting financial decline. A red stock market chart declines sharply against a blurred dark city background. This image illustrates a financial crisis and economic downturn, showing a dramatic fall in market values
Free with trial Electric power, Charge station and Electricity price inflation set. Design shape elements. Energy line icons. Eco energy, efficiency consumption and saving electricity line icons. Vector. Trend decrease illustrations Energy line icons. Electric power, Charge station and Electricity price inflation set. Design elements. Vector. Electric power, Charge station and Electricity price inflation set. Design shape elements. Energy line icons. Eco energy, efficiency consumption and saving electricity line icons. Vector
Free with trial 3d bar chart illustrating growth, analysis, and business progress with colorful visual representation of data ,Generative ai. Trend decrease illustrations 3d bar chart, visualizing growth, data analysis, and business progress for effective communication. 3d bar chart illustrating growth, analysis, and business progress with colorful visual representation of data ,Generative ai
Free with trial Decreasing line graphic. Square point Vector. Minimalist progress chart. Data sequence illustration. EPS 10. Trend decrease vectors Decreasing line graphic. Square point Vector. Minimalist progress chart. Data sequence illustration.
Free with trial Stacks of gold coins sit before a fluctuating red arrow graph illustrating concepts of financial growth market trends investment risk and economic change The image depicts uncertainty and the potential for both profit and loss. Trend decrease illustrations Financial Growth Stock Market Coins Red Arrow Investment Business Economy Finance Money Success. Stacks of gold coins sit before a fluctuating red arrow graph illustrating concepts of financial growth market trends investment risk and economic change The image depicts uncertainty and the potential for both profit and loss
Free with trial A modern smartphone displays a stock market candlestick chart with a downward-trending red arrow indicating a significant loss. Several gold coins with dollar signs are scattered around the phone, and a red bell icon with an exclamation mark hovers above, suggesting an alert or warning. A label on the arrow reads "LOSS. Trend decrease illustrations Smartphone Displaying Stock Market Chart with Falling Red Arrow and Gold Coins mobile trading. A modern smartphone displays a stock market candlestick chart with a downward-trending red arrow indicating a significant loss. Several gold coins with dollar signs are scattered around the phone, and a red bell icon with an exclamation mark hovers above, suggesting an alert or warning. A label on the arrow reads "LOSS
Free with trial Gold business icons on dark background graphs, charts, money, global, growth, finance, planning, idea, vibrant background Generative AI. Trend decrease illustrations Gold business icons on dark background graphs, charts, money, global, growth, finance, planning, idea
Free with trial The image shows a candlestick stock chart on a black background, depicting price movements with green and red candlesticks. Suitable for finance and business concepts. Generative AI. Trend decrease illustrations Stock market candlestick chart isolated on black background for financial and business concepts. The image shows a candlestick stock chart on a black background, depicting price movements with green and red candlesticks. Suitable for finance and business concepts. Generative AI
Free with trial Reduction chart icon vector logo set collection for web app ui. Trend decrease vectors Reduction chart icon set depicting data reduction symbols, ideal for business analytics and performance visuals. Reduction chart icon vector logo set collection for web app ui
Free with trial This image is generated using AI tool. Trend decrease illustrations Falling Interest Rates and Mortgage Home Prices Concept. This image is generated using AI tool
Free with trial This image is generated using AI tool. Trend decrease illustrations Falling Interest Rates and Mortgage Home Prices Concept. This image is generated using AI tool
Free with trial This image is generated using AI tool. Trend decrease illustrations Falling Interest Rates and Mortgage Home Prices Concept. This image is generated using AI tool
Free with trial This image is generated using AI tool. Trend decrease illustrations Falling Interest Rates and Mortgage Home Prices Concept. This image is generated using AI tool
Free with trial This image is generated using AI tool. Trend decrease illustrations Falling Interest Rates and Mortgage Home Prices Concept. This image is generated using AI tool
Free with trial This image is generated using AI tool. Trend decrease illustrations Falling Interest Rates and Mortgage Home Prices Concept. This image is generated using AI tool
Free with trial This image is generated using AI tool. Trend decrease illustrations Falling Interest Rates and Mortgage Home Prices Concept. This image is generated using AI tool
Free with trial This image is generated using AI tool. Trend decrease illustrations Falling Interest Rates and Mortgage Home Prices Concept. This image is generated using AI tool
Free with trial Orange arrow pointing downward through clouds towards earth. Global economic downturn visualization. For market analysis and business decline concept. Trend decrease illustrations Orange arrow pointing downward through clouds towards earth. Global economic downturn visualization. For market analysis and business decline concept