Free with trial 3d colorful cubes with different percentages in white. Value price decrease illustrations Different percentages in color. 3d colorful cubes with different percentages in white
Free with trial 3D Rendering concept of financial inflation: a balloon taking a pack of dollar bill up on the air on background. 3D render. 3D illustration. Pastel theme. Minimalism. Value price decrease illustrations 3D Rendering concept of financial inflation
Free with trial Oil market crash. Isolated on the white background. Value price decrease illustrations Oil market crash. Isolated on the white background
Free with trial A 3D red arrow with a white percentage symbol points downwards, indicating a decrease. Isolated on a transparent background. Value price decrease vectors Red arrow with percentage symbol pointing down isolated on a transparent background 1. A 3D red arrow with a white percentage symbol points downwards, indicating. A 3D red arrow with a white percentage symbol points downwards, indicating a decrease. Isolated on a transparent background
Free with trial Chart arrow and letters shows lower prices. Value price decrease illustrations Price reduction. Chart arrow and letters shows lower prices
Free with trial Financial and stock investment market concept. The bear market which price of securities are falling down. Value price decrease vectors Financial and stock investment market concept.
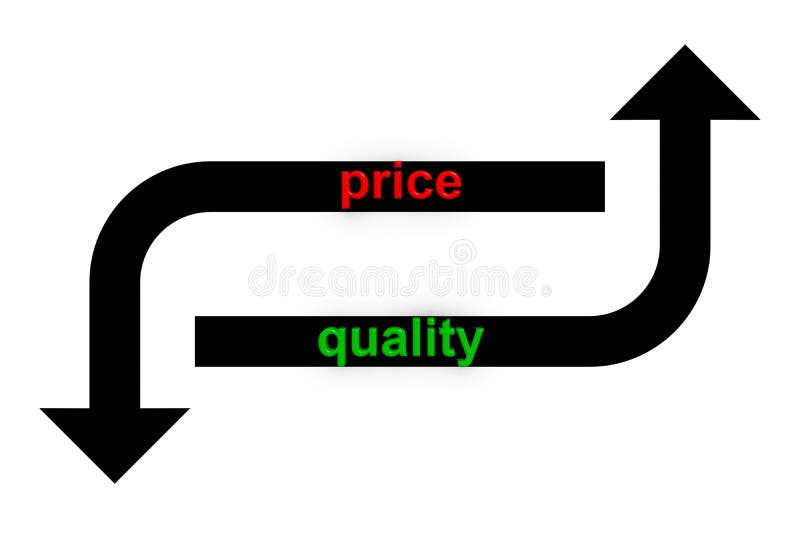
Free with trial Arrows indicate decrease the cost and increase quality. Value price decrease illustrations Improved quality reduced cost. Arrows indicate decrease the cost and increase quality
Free with trial German tax cut on value-added tax VAT. 3D render of 16 percent symbol. Value price decrease illustrations Duty and taxes. German tax cut on value-added tax VAT. 3D render of 16 percent symbol
Free with trial Oil pump and decline graph against the background of the US night map. Fall in the value of American oil. Concept - a crisis in the raw materials industry. Fall of stocks. Decrease in oil revenues. 3D Illustration. Value price decrease illustrations Oil pump and decline graph against the background of the US night map. Fall in the value of American oil. Concept - a crisis in
Free with trial Inflation expectations cycle set. Economics crisis and value of money decline implications. High inflation drives up inflation expectations that driving up inflation. Flat vector illustration. Value price decrease vectors Inflation expectations cycle set. Economics crisis and value of money
Free with trial Concept of decline in real estate business and properties price. Value price decrease vectors Red 3D home icon in falling down arrow. Concept of decline in real estate business and properties price
Free with trial Golden percentage symbol with an arrow. Value price decrease illustrations Percentage symbol
Free with trial An image showing a diagram which has a puzzle effect over the six main columns and a shadow behind with a red upward stroke over the top. Value price decrease illustrations Diagram
Free with trial Sale with red percentage numbers. Value price decrease illustrations Sale sign. Sale with red percentage numbers
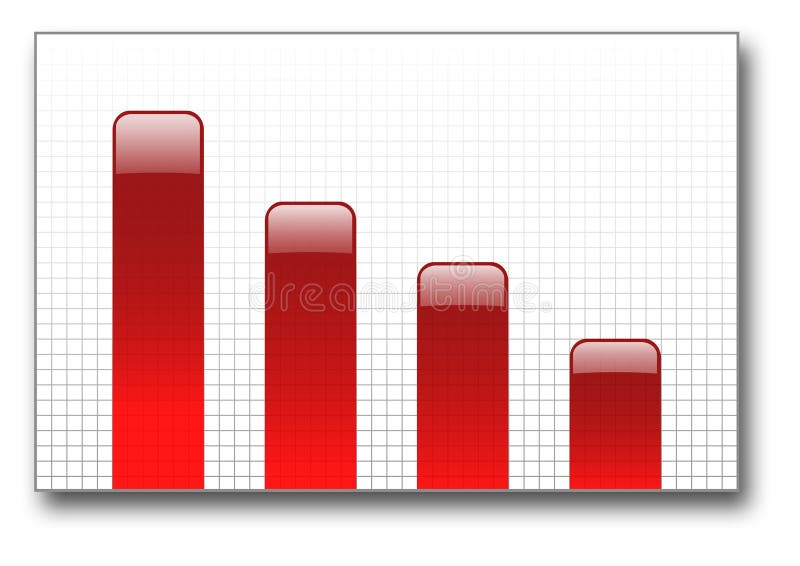
Free with trial Red bar graph going down over checked background. Value price decrease illustrations Red bar graph down. Red bar graph going down over checked background
Free with trial Up and down arrows with music note icons indicating popularity, price, or volume. Value price decrease vectors Music notes icon on up and down arrows. Up and down arrows with music note icons indicating popularity, price, or volume
Free with trial Cost efficiency, quality and costs as production optimization outline set. Labeled diagram with performance improvement and financial profit growth vector illustration. Reduce spending and expenses. Value price decrease vectors Cost, efficiency and quality as production expenses optimization outline set. Cost efficiency, quality and costs as production optimization outline set. Labeled diagram with performance improvement and financial profit growth vector illustration. Reduce spending and expenses.
Free with trial 3D illustration of a green dollar sign and a yellow humanoid figure holding a red arrow in a downward direction, isolated on a white background. Conceptual. Value price decrease illustrations Dollar down concept. 3D illustration of a green dollar sign and a yellow humanoid figure holding a red arrow in a downward direction, isolated on a white background. Conceptual.
Free with trial 3D illustration of a dial with dollar symbol with needle pointing the green zone. Drop of prices concept, horizontal image. Value price decrease illustrations Dropping Prices Concept or Deflation of Dollar Currency. 3D illustration of a dial with dollar symbol with needle pointing the green zone. Drop of prices concept, horizontal image.
Free with trial 3d red cubes with ten, twenty and thirty percentages. Value price decrease illustrations Ten, twenty and thirty percentages in red. 3d red cubes with ten, twenty and thirty percentages
Free with trial Up and down arrows with treble clef music icons indicating popularity, price, skill, or volume. Value price decrease vectors Treble clef icon on up and down arrows. Up and down arrows with treble clef music icons indicating popularity, price, skill, or volume
Free with trial Stock market down. Financial crisis concept. Standard and Poors 500 index drop. Vector Illustration. Value price decrease vectors Stock market down. Financial crisis concept. Vector Illustration. Stock market down. Financial crisis concept. Standard and Poors 500 index drop. Vector Illustration
Free with trial House prices going down illustration. Home prices graph. Real estate prices going down. Value price decrease illustrations House prices going down illustration
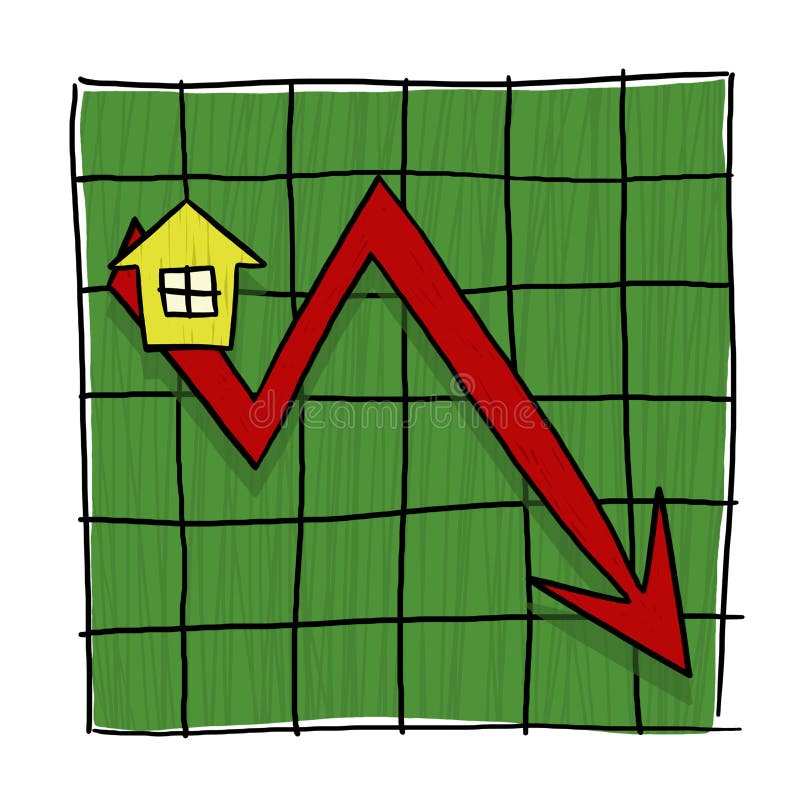
Free with trial Red graph and houses: decline in sales. Value price decrease illustrations Houses and graph. Red graph and houses: decline in sales
Free with trial Growing and dropping 3d percent symbols. Vector illustration. Value price decrease vectors Growing and dropping percent symbols. Growing and dropping 3d percent symbols. Vector illustration
Free with trial 3D illustration with a SAVE sign. Value price decrease illustrations $AVE. 3D illustration with a SAVE sign
Free with trial Oil market boom. on the white background. Value price decrease illustrations Oil market boom
Free with trial 3d render of keyboard with options button. The concept of investing in the stock market. Value price decrease illustrations 3d render of keyboard with options button
Free with trial Text big sale in 3d red hexagon banner like button, business concept. Value price decrease illustrations Big sale button. Text big sale in 3d red hexagon banner like button, business concept
Free with trial Autumn offer banner - text in orange label with white fall leaf, business concept. Value price decrease illustrations Autumn offer in label with leaf. Autumn offer banner - text in orange label with white fall leaf, business concept
Free with trial A Colourful 3d Rendered Concept Illustration showing the housing market decline on a Blackboard. Value price decrease illustrations Blackboard Housing Market Decline. A Colourful 3d Rendered Concept Illustration showing the housing market decline on a Blackboard
Free with trial Money and currency icon set,outline style,vector and illustration. Value price decrease vectors Money and currency icon set
Free with trial Euro coins chart isolated on white background. 3d rendering. Value price decrease illustrations Euro crisis. Euro coins chart isolated on white background. 3d rendering.
Free with trial Oil barrels on Decline chart diagram and red down arrow background vector. Value price decrease vectors Oil barrels on Decline chart diagram and red down arrow
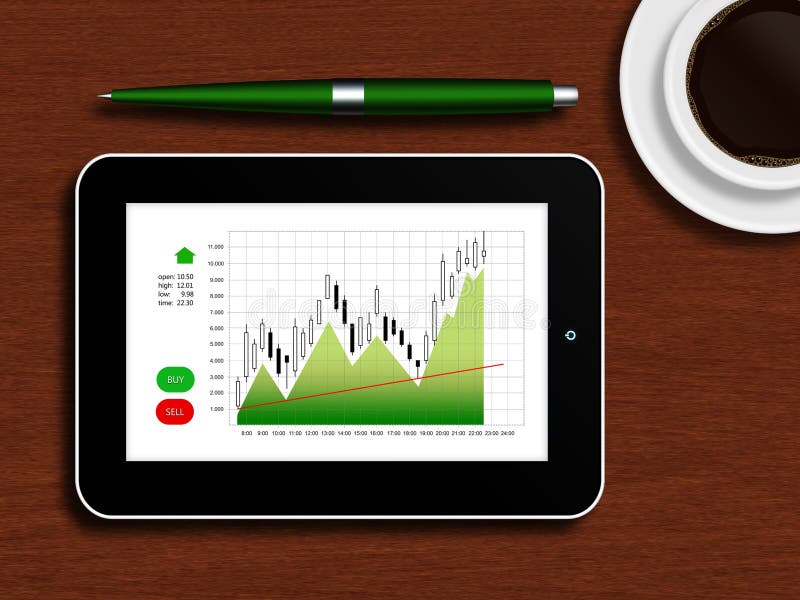
Free with trial Tablet with the stock chart lying on a wooden table with a cup of coffee and pen. Value price decrease illustrations Tablet with the stock chart lying on a wooden table
Free with trial 3D computer generated words HUGE $ALE in white with the S in sale replaced with a dollar sign, isolated on a dark purple reflective floor and lighter purple background. Value price decrease illustrations Huge sale text. 3D computer generated words HUGE $ALE in white with the S in sale replaced with a dollar sign, isolated on a dark purple reflective floor and lighter purple background.
Free with trial Blue blocks showing a reduction of 50% off. Value price decrease illustrations Fifty percent off. Blue blocks showing a reduction of 50% off.
Free with trial 3d render of keyboard with crude oil button and bear. The concept of bearish trend. Value price decrease illustrations 3d render of keyboard with crude oil button
Free with trial 3d render of keyboard with crude oil button and bull. The concept of bullish trend. Value price decrease illustrations 3d render of keyboard with crude oil button
Free with trial 3d render of keyboard with natural gas button. Stock market concept. Value price decrease illustrations 3d render of keyboard with natural gas button
Free with trial 3d render closeup of computer keyboard with DAX index button and bear. Stock market indexes concept. Value price decrease illustrations 3d render of computer keyboard with DAX index button. 3d render closeup of computer keyboard with DAX index button and bear. Stock market indexes concept.
Free with trial Inflation concept of hamburger. Vector illustration. Value price decrease vectors Inflation concept of hamburger
Free with trial 3d render closeup of computer keyboard with bear and S&P 500 index button. Stock market indexes concept. Value price decrease illustrations 3d render of computer keyboard with bear and S&P 500 index. 3d render closeup of computer keyboard with bear and S&P 500 index button. Stock market indexes concept.
Free with trial Gold Bars Sinking Showing Depression Recession And Economic Downturns. Value price decrease illustrations Gold Bars Sinking Showing Depression
Free with trial 3d render closeup of computer keyboard with sell button and bear. Stock market symbols concept. Value price decrease illustrations 3d renderof computer keyboard with sell button. 3d render closeup of computer keyboard with sell button and bear. Stock market symbols concept
Free with trial A large broken tear tag sign with the word text "COST" on it, which is falling apart and breaking into pieces. Concept of cost reduction. Value price decrease illustrations A large broken tear tag sign with the word text \'COST\' on it. A large broken tear tag sign with the word text "COST" on it, which is falling apart and breaking into pieces. Concept of cost reduction
Free with trial The door is closing as Federal Reserve QE Taper decision. Value price decrease illustrations Federal Reserve QE Taper decision
Free with trial 3D angled words BARGAIN in red on top and SALE in blue on the bottom stacked on top of one another on a gray reflective base and white background. Value price decrease illustrations Bargain sale. 3D angled words BARGAIN in red on top and SALE in blue on the bottom stacked on top of one another on a gray reflective base and white background.
Free with trial 3d render of keyboard with options button. The concept of investing in the stock market. Value price decrease illustrations 3d render of keyboard with options button
Free with trial 3d render closeup of computer keyboard with FTSE 100 index button. Stock market indexes concept. Value price decrease illustrations 3d render of computer keyboard with FTSE 100 index button. 3d render closeup of computer keyboard with FTSE 100 index button. Stock market indexes concept.
Free with trial Dollar textured bars and falling arrow. 3D illustration. Value price decrease illustrations Dollar textured bars and falling arrow. 3D illustration
Free with trial 3d render closeup of computer keyboard with EURO STOXX 50 index button. Stock market indexes concept. Value price decrease illustrations 3d render of computer keyboard with EURO STOXX 50 index button. 3d render closeup of computer keyboard with EURO STOXX 50 index button. Stock market indexes concept.
Free with trial Mortgage loan, down payment, low interest rate, descending coin stack, home buying budget, vector line icon, thin stroke. Value price decrease vectors Mortgage down payment, home loan, low interest rate, descending coin stack, line icon. Mortgage loan, down payment, low interest rate, descending coin stack, home buying budget, vector line icon, thin stroke
Free with trial Economic crisis and money loss icons, downturn and bankruptcy symbols, line vector. World financial crisis and global economy recession icons of business bankruptcy, finance downturn and unemployment. Value price decrease vectors Economic crisis and money loss icons of downturn. Economic crisis and money loss icons, downturn and bankruptcy symbols, line vector. World financial crisis and global economy recession icons of business bankruptcy, finance downturn and unemployment
Free with trial 3d render closeup of computer keyboard with EURO STOXX 50 index button. Stock market indexes concept. Value price decrease illustrations 3d render of computer keyboard with EURO STOXX 50 index button. 3d render closeup of computer keyboard with EURO STOXX 50 index button. Stock market indexes concept.
Free with trial 3d render closeup of computer keyboard with NIKKEI 225 index button. Stock market indexes concept. Value price decrease illustrations 3d render of computer keyboard with NIKKEI 225 index button. 3d render closeup of computer keyboard with NIKKEI 225 index button. Stock market indexes concept.
Free with trial 3d render closeup of computer keyboard with FTSE 100 index button. Stock market indexes concept. Value price decrease illustrations 3d render of computer keyboard with FTSE 100 index button. 3d render closeup of computer keyboard with FTSE 100 index button. Stock market indexes concept.
Free with trial Flat vector icon concept of house arrow showing down on red background. Value price decrease vectors Vector icon concept of house arrow showing down on red background
Free with trial 3d render of computer keyboard with franc and dollar button. Forex currency pairs concept. Value price decrease illustrations 3d render of computer keyboard with franc and dollar button
Free with trial House and arrow go down image with hi-res rendered artwork that could be used for any graphic design. Value price decrease illustrations House and arrow go down
Free with trial A barrel of oil on the background graphics fall. Value price decrease vectors Oil falls. A barrel of oil on the background graphics fall.
Free with trial Down arrow on graph means unsuccessful business depression and Crisis. A currency risk or interest falling - 3d illustration. Value price decrease illustrations Down arrow on graph means unsuccessful business depression and Crisis - 3d illustration. Down arrow on graph means unsuccessful business depression and Crisis. A currency risk or interest falling - 3d illustration
Free with trial Default or collapse in stock market and exchange concept vector illustration. Businessman in stress, broker in panic clasping your head with hands on background of screen with securities value fall. Value price decrease vectors Default or collapse in stock market and exchange
Free with trial Set of Candlestick chart with banknote on white background. For currency exchange rate concept. Value price decrease vectors Set of Candlestick chart with banknote on white background.For currency exchange rate concept
Free with trial Looking Bear market presents downtrend stock market. Value price decrease vectors Looking Bear market presents downtrend stock market
Free with trial Shopping basket discount shows lower prices. Value price decrease illustrations Lower prices on purchases. Shopping basket discount shows lower prices
Free with trial Change in mortgage interest. Concept. Value price decrease illustrations Change in mortgage interest. Concept
Free with trial Vector icon concept of dollar symbol arrow down under house roof. Black outlines, white background. Value price decrease vectors Vector icon concept of dollar symbol arrow down under house roof
Free with trial Set of purple stickers on white background. Vector illustration. Value price decrease vectors Set of purple stickers on white background.
Free with trial Businessman is presenting appreciation of Yen currency. Value price decrease vectors Businessman is presenting appreciation of Yen currency
Free with trial Interest rate cut vector icon illustration. Value price decrease vectors Interest rate cut icon illustration. Interest rate cut vector icon illustration
Free with trial A red financial graph visually represents a stock market decline, showcasing bearish trends, losses, and a downward trajectory. The graph is depicted in red lines on a black background. Value price decrease illustrations Red Stock Market Graph Displaying Financial Losses and Economic Downturn Trends. A red financial graph visually represents a stock market decline, showcasing bearish trends, losses, and a downward trajectory. The graph is depicted in red lines on a black background
Free with trial Novel coronavirus COVID-19with text Wuhan coronavirus outbreak on correction market background. concept of the fall of the Chinese trade market and economy. Value price decrease vectors Novel coronavirus COVID-19with text Wuhan coronavirus outbreak on correction market background. concept of the fall of the Chinese
Free with trial GDP word rising and falling arrows and coins. Gross domestic product concept. 3D illustration. Value price decrease illustrations GDP word rising and falling arrows and coins. Gross domestic product concept. 3D illustration
Free with trial Shopping cart with supermarket products falling down the decreasing arrow. 3D illustration. Value price decrease illustrations Shopping cart with supermarket products falling down the decreasing arrow. 3D illustration
Free with trial A striking red line graph against a dark backdrop, illustrating a stock market crash and highlighting a financial crisis. The image conveys a sense of loss and economic downturn. Value price decrease illustrations Stock market crash illustration with red line graph on a dark background depicting financial crisis concept. A striking red line graph against a dark backdrop, illustrating a stock market crash and highlighting a financial crisis. The image conveys a sense of loss and economic downturn
Free with trial Cost reduction web banner or landing page set. Idea of financial and marketing strategy. Cost and income balance. Spending and cost optimization. Flat illustration vector. Value price decrease vectors Cost reduction web banner or landing page set. Idea of financial
Free with trial Businessman looks at a graph of the real estate market where the arrowhead is falling. recession Home prices fall in real estate and property market crash. isometric illustration vector. Value price decrease vectors Home prices fall in real estate and property market crash
Free with trial Chart, data, graph, reports, valuation Flat Color Icon Vector. Value price decrease vectors Chart, data, graph, reports, valuation Flat Color Icon Vector
Free with trial 3D Illustration of Stock market down trend. Candle stick chart in red color background. Extreme bearish panic sell stage. Value price decrease illustrations 3D Illustration of Stock market down trend. Candle stick chart in red color background. Extreme bearish panic sell stage