Free with trial Money increase and decrease icons. Low or high total cost icon. Price, sale, rate or profit going up or down symbol with arrow and dollar sign. Vector illustration. Value price decrease vectors Money increase and decrease icons. Low or high total cost icon. Price, sale, rate or profit going up or down symbol
Free with trial Where the price will go up or down. Increase or decrease of the indicator. Market uncertainty and price speculation trends. Forecasting challenges and investor sentiment shifts. Value price decrease illustrations Where the price will go up or down. Increase or decrease of the indicator. Market uncertainty and price speculation trends
Free with trial A dark icon showing a dollar sign within a circle, with a downward arrow signifying a decrease in price or value. Value price decrease vectors Dollar sign with downward arrow indicating cost reduction. A dark icon showing a dollar sign within a circle, with a downward arrow signifying a decrease in price or value
Free with trial Money increase and decrease icons. Low or high total cost icon. Price, sale, rate or profit going up or down symbol with arrow and dollar sign. Vector illustration. Value price decrease vectors Money increase and decrease icons. Low or high total cost icon. Price, sale, rate or profit going up or down symbol
Free with trial Money increase and decrease icons. Low or high total cost icon. Price, sale, rate or profit going up or down symbol with arrow and dollar sign. Vector illustration. Value price decrease vectors Money increase and decrease icons. Low or high total cost icon. Price, sale, rate or profit going up or down symbol
Free with trial Money increase and decrease icons. Low or high total cost icon. Price, sale, rate or profit going up or down symbol with arrow and dollar sign. Vector illustration. Value price decrease vectors Money increase and decrease icons. Low or high total cost icon. Price, sale, rate or profit going up or down symbol
Free with trial Money increase and decrease icons. Low or high total cost icon. Price, sale, rate or profit going up or down symbol with arrow and dollar sign. Vector illustration. Value price decrease vectors Money increase and decrease icons. Low or high total cost icon. Price, sale, rate or profit going up or down symbol
Free with trial Money increase and decrease icons. Low or high total cost icon. Price, sale, rate or profit going up or down symbol with arrow and dollar sign. Vector illustration. Value price decrease vectors Money increase and decrease icons. Low or high total cost icon. Price, sale, rate or profit going up or down symbol
Free with trial Money increase and decrease icons. Low or high total cost icon. Price, sale, rate or profit going up or down symbol with arrow and dollar sign. Vector illustration. Value price decrease vectors Money increase and decrease icons. Low or high total cost icon. Price, sale, rate or profit going up or down symbol
Free with trial Price and cost icons featuring discount tags, retail sales values, and financial budget planning. This collection is perfect for e-commerce shopping platforms, financial strategy dashboards, and retail management apps. Minimalist vector line art designed to clearly visualize inflation, value reduction, wholesale factory expenses, market calculations, and consumer expense tracking. Value price decrease vectors Price and Commercial Cost Vector Icons. Price and cost icons featuring discount tags, retail sales values, and financial budget planning. This collection is perfect for e-commerce shopping platforms, financial strategy dashboards, and retail management apps. Minimalist vector line art designed to clearly visualize inflation, value reduction, wholesale factory expenses, market calculations, and consumer expense tracking.
Free with trial Economic crisis icon of price low down or stock market depreciation, vector line symbol. Global economy and business downturn with financial crisis and prices decrease or percent down low. Value price decrease illustrations Economic crisis icon, price low down, stock market. Economic crisis icon of price low down or stock market depreciation, vector line symbol. Global economy and business downturn with financial crisis and prices decrease or percent down low
Free with trial Price and discount, cost reduction, profit growth financial strategy line icon set. Increase and decrease, optimization of price, competition thin black and red outline symbols vector illustration. Value price decrease vectors Price and discount, cost reduction, profit growth financial strategy line icon set
Free with trial The image shows three green downward-pointing arrows, each accompanied by a percentage sign. These arrows are aligned horizontally and symbolize discounts, price reductions, or decreases in value. The arrows are identical in design, with a bold outline and filled interior, and the percentage signs are located at the bottom tip of each arrow, suggesting a focus on financial or commercial contexts. Value price decrease illustrations Three downward arrows with percentage signs indicating discounts or price reductions. The image shows three green downward-pointing arrows, each accompanied by a percentage sign. These arrows are aligned horizontally and symbolize discounts, price reductions, or decreases in value. The arrows are identical in design, with a bold outline and filled interior, and the percentage signs are located at the bottom tip of each arrow, suggesting a focus on financial or commercial contexts
Free with trial Conceptual line art depicting a decrease in gold prices. Value price decrease illustrations Gold Price Drop Magnifying Glass Showing Decreasing Value. Conceptual line art depicting a decrease in gold prices.
Free with trial Three red arrows, each featuring a white percentage sign, are depicted pointing downwards against a neutral grey background. The arrows are arranged in a staggered formation, suggesting a trend or movement. This visual metaphor strongly represents concepts such as financial loss, economic downturn, price reduction, or a decrease in value. The stark contrast between the red arrows and the white. Value price decrease illustrations Red arrows pointing down with percentage signs symbolizing financial decline. Three red arrows, each featuring a white percentage sign, are depicted pointing downwards against a neutral grey background. The arrows are arranged in a staggered formation, suggesting a trend or movement. This visual metaphor strongly represents concepts such as financial loss, economic downturn, price reduction, or a decrease in value. The stark contrast between the red arrows and the white
Free with trial Black fair value icon with downward arrow pointing to two horizontal lines. Clear details and vibrant colors e. Value price decrease illustrations Fair Value Downward Arrow Icon Indicating Decrease In Value image photo. Black fair value icon with downward arrow pointing to two horizontal lines. Clear details and vibrant colors e
Free with trial Digital Transformation in Real Estate Market with Laptop and House Icon Illustrating Decrease in Property Value Represented by Percent Symbol Sigmoid. Value price decrease illustrations A modern workspace with a laptop and digital house icon, showcasing the decline in property value with a percent symbol. Digital Transformation in Real Estate Market with Laptop and House Icon Illustrating Decrease in Property Value Represented by Percent Symbol Sigmoid
Free with trial Gold price going down decrease cheaper in golden metal commodity market international trading market vector. Value price decrease illustrations Gold price going down decrease cheaper in golden metal commodity market international trading market
Free with trial Financial crisis, economic downturn, bankruptcy concept. 3D blue glass bar chart icon with arrow down, recession graph. Falling price, decline profit or asset value, decrease in sales. 3D illustration. Value price decrease illustrations Financial crisis, economic downturn, bankruptcy concept. 3D blue glass bar chart icon with arrow down, recession graph. Falling
Free with trial A minimalist 3D icon rendered in white depicts a downward arrow pointing into a square frame containing a percentage symbol. The icon is presented on a reflective white surface, with a subtle blurred background. This graphic represents concepts such as price decrease, discount, or a downward trend. Value price decrease illustrations 3D White Icon Symbolizing Percentage Decrease or Discount with Downward Arrow on Reflective Surface. A minimalist 3D icon rendered in white depicts a downward arrow pointing into a square frame containing a percentage symbol. The icon is presented on a reflective white surface, with a subtle blurred background. This graphic represents concepts such as price decrease, discount, or a downward trend
Free with trial This image is a solid style icon representing a price reduction. It features a dollar sign inside of a downward pointing arrow, symbolizing a decrease in price. Value price decrease vectors Simple Solid Style Price Reduction Icon with Dollar Sign and Downward Arrow. This image is a solid style icon representing a price reduction. It features a dollar sign inside of a downward pointing arrow, symbolizing a decrease in price.
Free with trial A clean, minimalist 3D icon rendered in white against a neutral gray background. The icon features a square border with rounded corners, containing a downward-pointing arrow and a percentage sign. This graphic represents concepts such as a price decrease, discount, or negative financial trend. Value price decrease illustrations White 3D Icon Symbolizing Percentage Decrease or Discount with Downward Arrow down arrow. A clean, minimalist 3D icon rendered in white against a neutral gray background. The icon features a square border with rounded corners, containing a downward-pointing arrow and a percentage sign. This graphic represents concepts such as a price decrease, discount, or negative financial trend
Free with trial Gold coins stacked with a Bitcoin logo and a downward red arrow visually represent a decrease in cryptocurrency market value and potential financial loss. Value price decrease illustrations Bitcoin Price Drop: Gold Coins & Red Arrow Symbolize Crypto Decline. Gold coins stacked with a Bitcoin logo and a downward red arrow visually represent a decrease in cryptocurrency market value and potential financial loss
Free with trial This image depicts a financial market stock chart with green and red candlesticks. The candlesticks represent price movements over specific time intervals, with green indicating an increase in value and red indicating a decrease. The chart is set against a dark background, highlighting the candlesticks clearly. This type of chart is commonly used by traders and investors to analyze market trends. Value price decrease illustrations Financial market stock chart
Free with trial Stacks of coins decrease in size against bright sunset over water. Financial decline, economic hardship, fading wealth. Image suggests monetary loss, diminishing value challenging. Value price decrease illustrations Stacks of coins decrease in size against bright sunset over water. Financial decline, economic hardship, fading wealth. Image
Free with trial A vibrant display of shiny purple metallic balloons spelling out the word 'PRICE' against a dark background, symbolizing concepts of cost, value, sales, or discounts. Value price decrease illustrations Purple balloon letters spell price. A vibrant display of shiny purple metallic balloons spelling out the word 'PRICE' against a dark background, symbolizing concepts of cost, value, sales, or discounts
Free with trial Bitcoin price decline visualization. Bitcoin Value Decrease, Conceptual image showing a decreasing trend in Bitcoin value. Value price decrease illustrations Bitcoin price decline visualization. Bitcoin Value Decrease, Conceptual image showing a decreasing trend in Bitcoin value
Free with trial This icon illustrates the concept of decreasing property value, featuring a house with a dollar sign and downward arrows. It represents financial loss in real estate. Value price decrease vectors Vector art of icon of a house with dollar sign and downward arrows, indicating decrease in property value. This icon illustrates the concept of decreasing property value, featuring a house with a dollar sign and downward arrows. It represents financial loss in real estate
Free with trial Conceptual image depicting a decrease in the value of gold. Value price decrease illustrations Gold Price Drop Magnifying Glass on Falling Gold Value. Conceptual image depicting a decrease in the value of gold.
Free with trial Down real estate value color line icon, housing market and economic crisis. House price decline graph vector outline symbol with down arrow and buildings. Economy, finance and business recession. Value price decrease vectors Down real estate value line icon, houses and graph. Down real estate value color line icon, housing market and economic crisis. House price decline graph vector outline symbol with down arrow and buildings. Economy, finance and business recession
Free with trial Housing price falling down, Businessman investor and homeowner experiencing a decrease in the housing market. Value price decrease vectors Housing price falling down, Businessman investor and homeowner experiencing a decrease in the housing market
Free with trial House with a dollar sign and down arrows, indicating a decrease in price, reduction in value, or a downturn in the real estate market. Symbolizes financial loss. Value price decrease vectors Vector art of house with dollar sign and down arrows. House with a dollar sign and down arrows, indicating a decrease in price, reduction in value, or a downturn in the real estate market. Symbolizes financial loss
Free with trial The image shows a visual representation of a declining trend using a stack of three gold coins. The coins are progressively smaller from bottom to top, symbolizing a reduction in quantity or value. A red downward-pointing arrow is placed above the coins, further emphasizing the concept of decline or decrease. Value price decrease vectors Decreasing stack of gold coins with downward price arrow. The image shows a visual representation of a declining trend using a stack of three gold coins. The coins are progressively smaller from bottom to top, symbolizing a reduction in quantity or value. A red downward-pointing arrow is placed above the coins, further emphasizing the concept of decline or decrease
Free with trial A 3D illustration of a coin featuring the Pound Sterling symbol in blue against a white circular background. The coin is bordered by a light blue ring. To the right of the coin, a small orange circle contains a white downward-pointing arrow, signifying a decrease or negative trend in financial value. The image is isolated on a white background. Value price decrease illustrations 3D Pound Sterling Symbol Coin with Downward Arrow Icon Indicating Financial Decrease. A 3D illustration of a coin featuring the Pound Sterling symbol in blue against a white circular background. The coin is bordered by a light blue ring. To the right of the coin, a small orange circle contains a white downward-pointing arrow, signifying a decrease or negative trend in financial value. The image is isolated on a white background
Free with trial A physical bitcoin with a red downward arrow, symbolizing a decrease in cryptocurrency value. Value price decrease illustrations Bitcoin cryptocurrency with red downward arrow indicating a price drop. A physical bitcoin with a red downward arrow, symbolizing a decrease in cryptocurrency value
Free with trial A vibrant 3D rendered blue arrow points downwards, signifying a decrease or decline. Attached to the arrow is a pink circular emblem featuring a white percentage sign. This graphic is isolated on a white background, making it suitable for representing concepts like price drops, sales, economic downturns, or negative trends. Value price decrease illustrations 3D Blue Downward Arrow with a Pink Percentage Sign Emblem decrease decline. A vibrant 3D rendered blue arrow points downwards, signifying a decrease or decline. Attached to the arrow is a pink circular emblem featuring a white percentage sign. This graphic is isolated on a white background, making it suitable for representing concepts like price drops, sales, economic downturns, or negative trends
Free with trial A graph showing a downward trend with a red arrow pointing downwards, indicating a decline or decrease in value or quantity over time. Value price decrease illustrations Declining trend indicated by red arrow on graph showing decrease over time. A graph showing a downward trend with a red arrow pointing downwards, indicating a decline or decrease in value or quantity over time
Free with trial The image shows a tag with a percentage symbol inside it, attached to a ring at the top, and an arrow pointing downward indicating a decrease in price or a sale discount. Value price decrease illustrations Image depicting a price reduction or discount sale with a percentage sign tag. The image shows a tag with a percentage symbol inside it, attached to a ring at the top, and an arrow pointing downward indicating a decrease in price or a sale discount
Free with trial The image depicts a stock chart with a blue background, displaying the fluctuations of a stock's value over a period. The chart includes various data points, such as the opening, closing, high, and low prices, represented by different candlestick patterns. The x-axis represents time, while the y-axis represents the stock price. The chart shows an overall upward trend with some periods of decline. Value price decrease illustrations A detailed stock chart showing the rise and fall of a stock\'s value over time. The image depicts a stock chart with a blue background, displaying the fluctuations of a stock's value over a period. The chart includes various data points, such as the opening, closing, high, and low prices, represented by different candlestick patterns. The x-axis represents time, while the y-axis represents the stock price. The chart shows an overall upward trend with some periods of decline
Free with trial A bold red arrow points directly downwards, positioned above a shiny gold coin. The coin features a prominent dollar sign embossed on its surface. The composition is clean and isolated on a white background, clearly symbolizing a decrease in value, financial loss, or a downward trend in currency or prices. Value price decrease illustrations Red Downward Arrow Hovering Over a Gold Coin with a Dollar Sign decrease decline. A bold red arrow points directly downwards, positioned above a shiny gold coin. The coin features a prominent dollar sign embossed on its surface. The composition is clean and isolated on a white background, clearly symbolizing a decrease in value, financial loss, or a downward trend in currency or prices
Free with trial The image shows three green downward-pointing arrows, each accompanied by a percentage sign. These arrows are aligned horizontally and symbolize discounts, price reductions, or decreases in value. The arrows are identical in design, with a bold outline and filled interior, and the percentage signs are located at the bottom tip of each arrow, suggesting a focus on financial or commercial contexts. Value price decrease illustrations Three downward arrows with percentage signs indicating discounts or price reductions. The image shows three green downward-pointing arrows, each accompanied by a percentage sign. These arrows are aligned horizontally and symbolize discounts, price reductions, or decreases in value. The arrows are identical in design, with a bold outline and filled interior, and the percentage signs are located at the bottom tip of each arrow, suggesting a focus on financial or commercial contexts
Free with trial A glossy red percentage symbol is superimposed on a downward pointing arrow, suggesting a decrease in value or price. Value price decrease vectors Red percentage symbol with downward arrow isolated on a transparent background sign. A glossy red percentage symbol is superimposed on a downward pointing arrow, suggesting a decrease in value or price
Free with trial The image features three green downward-pointing arrows, each containing a percentage symbol. The central arrow is larger and flanked by two smaller arrows on either side, symbolizing a decrease, reduction, or drop in percentage values, commonly used in contexts like discounts, declines, or losses. Value price decrease illustrations Green downward arrows with percentage signs indicating a decrease or reduction in value. The image features three green downward-pointing arrows, each containing a percentage symbol. The central arrow is larger and flanked by two smaller arrows on either side, symbolizing a decrease, reduction, or drop in percentage values, commonly used in contexts like discounts, declines, or losses
Free with trial A collection of silver bars arranged in perspective with a green line graph superimposed over them, suggesting a rising trend. The bars are reflective and metallic, representing financial concepts related to silver investments. The image conveys notions of value appreciation and economic analysis. Value price decrease illustrations Silver bars with a green line graph. a rising trend in the price or value of silver. financial concepts design element. A collection of silver bars arranged in perspective with a green line graph superimposed over them, suggesting a rising trend. The bars are reflective and metallic, representing financial concepts related to silver investments. The image conveys notions of value appreciation and economic analysis.
Free with trial Where the price will go up or down. Increase or decrease of the indicator. Market uncertainty and price speculation trends. Forecasting challenges and investor sentiment shifts. Value price decrease illustrations Where the price will go up or down. Increase or decrease of the indicator. Market uncertainty and price speculation trends
Free with trial Where the price will go up or down. Increase or decrease of the indicator. Market uncertainty and price speculation trends. Forecasting challenges and investor sentiment shifts. Value price decrease illustrations Where the price will go up or down. Increase or decrease of the indicator. Market uncertainty and price speculation trends
Free with trial Where the price will go up or down. Increase or decrease of the indicator. Market uncertainty and price speculation trends. Forecasting challenges and investor sentiment shifts. Value price decrease illustrations Where the price will go up or down. Increase or decrease of the indicator. Market uncertainty and price speculation trends
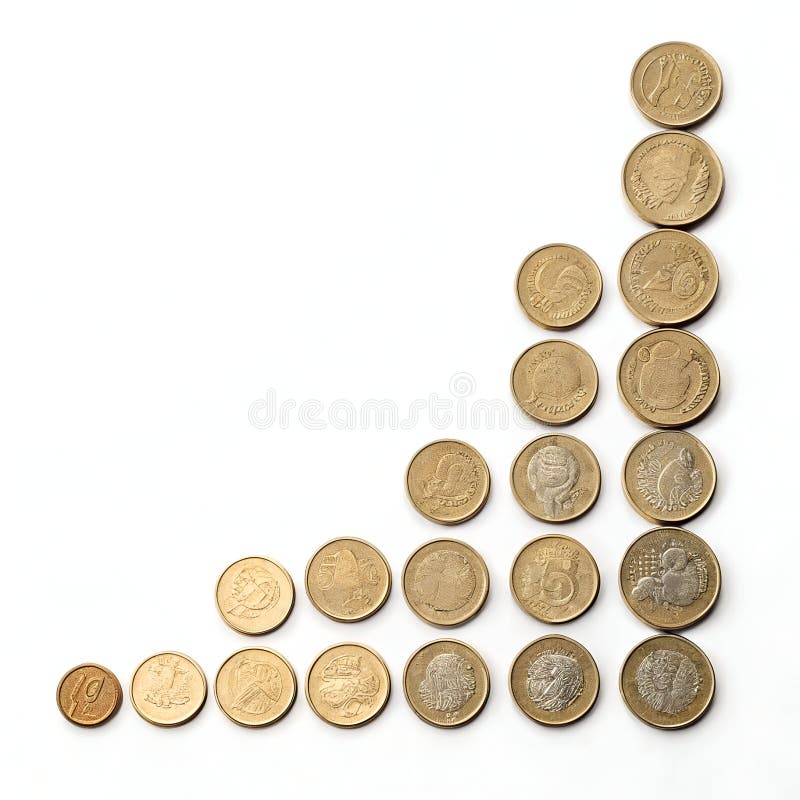
Free with trial Coins showing a decrease in value isolated on a white background, ideal for economic, financial, and market-related designs. Value price decrease illustrations Coins Decrease Isolated on White Background. Coins showing a decrease in value isolated on a white background, ideal for economic, financial, and market-related designs.
Free with trial A graphic illustration depicting the fluctuating value of digital currency, shown with a price performance chart and coins. this visual represents market ups and downs and financial trends. Value price decrease vectors Stylized illustration showing digital currency market volatility and virtual coin price trends on financial growth chart. a graphic illustration depicting the fluctuating value of digital currency, shown with a price performance chart and coins. this visual represents market ups and downs and financial trends
Free with trial Residential property value scale with percentage changes. illustrates market price dynamics and assessment, emphasizing real estate investment trends ,Generative ai. Value price decrease illustrations Real estate market dynamics, house on a scale illustrating percentagebased value changes and investment trends in the housing. Residential property value scale with percentage changes. illustrates market price dynamics and assessment, emphasizing real estate investment trends ,Generative ai
Free with trial A black and white line illustration features a speech bubble with a downward arrow and a dollar sign, indicating a decrease in value. Below, a stylized gold bar is depicted, flanked by two sparkles. The minimalistic design suggests an economic theme, likely related to changes in gold prices. Value price decrease vectors Gold Price Down. A black and white line illustration features a speech bubble with a downward arrow and a dollar sign, indicating a decrease in value. Below, a stylized gold bar is depicted, flanked by two sparkles. The minimalistic design suggests an economic theme, likely related to changes in gold prices.
Free with trial A minimalist black outline icon depicting a dollar sign with a downward arrow, indicating a decrease in value or price reduction. Value price decrease vectors Simple Outline Dollar Downward Arrow Currency Icon. A minimalist black outline icon depicting a dollar sign with a downward arrow, indicating a decrease in value or price reduction.
Free with trial A simple graphic depicting a downward pointing arrow, symbolizing a decrease or loss in financial value. The dollar sign is prominently featured. Value price decrease vectors Decreasing Dollar Value: Financial Loss Icon, Downward Trend. A simple graphic depicting a downward pointing arrow, symbolizing a decrease or loss in financial value. The dollar sign is prominently featured.
Free with trial Black and white bitcoin coin with a blue downward arrow indicating a decrease in value. Ideal for economic trends, cryptocurrency market analysis, financial decline, forex trading, money management. Value price decrease vectors Bitcoin Price Drop Representation with Blue Downward Arrow and Coin Illustration. Black and white bitcoin coin with a blue downward arrow indicating a decrease in value. Ideal for economic trends, cryptocurrency market analysis, financial decline, forex trading, money management
Free with trial Increase and decrease, optimization of price, competition thin black and red outline symbols vector illustration Price and discount, cost reduction, profit growth financial strategy line icon set. Value price decrease vectors Price and discount, cost reduction, profit growth financial strategy line icon set
Free with trial Two flat design icons, one red and one blue, showcasing a dollar sign within a circle with an arrow pointing downwards, signifying a decrease in value. Value price decrease vectors Dollar Down Symbol Round Icons Displaying in Red and Blue with Long Shadow. Decreasing Dollar Value. Two flat design icons, one red and one blue, showcasing a dollar sign within a circle with an arrow pointing downwards, signifying a decrease in value.
Free with trial Beige price tag with percentage symbol and torn bottom edge showing discount or diminishing value. Value price decrease vectors Beige price tag with percentage symbol and torn bottom edge showing discount or diminishing value
Free with trial Percentage decrease icon with downward arrow pointing into a download symbol. Price reduction or savings. Value price decrease vectors Percentage decrease icon with downward arrow pointing into a download symbol. Price reduction or savings
Free with trial Bear represents falling stock market on red chart background. Financial graph shows investment loss, price decrease. Bearish concept symbolizes economic recession, downturn global. Value price decrease illustrations Bear represents falling stock market on red chart background. Financial graph shows investment loss, price decrease. Bearish
Free with trial Decrease financial business on white background. Isolated 3D illustration. Value price decrease illustrations Decrease financial business on white background. Isolated 3D illustration
Free with trial Vector icons of money. National currency of the Republic of India. Banknotes and coins, bank accounts, payments and credit cards. Increase, decrease in value, spending and saving. Editable stroke. Value price decrease vectors Vector icons of money. National currency of the Republic of India. Banknotes and coins, bank accounts, payments and credit cards.
Free with trial Decrease : Decrease represents a reduction in value, profit, or financial performance over a specific period. Value price decrease vectors Illustration of Decrease. Decrease : Decrease represents a reduction in value, profit, or financial performance over a specific period.
Free with trial Decrease: Decrease represents a reduction in value, amount, or performance over time. Value price decrease illustrations Illustration of Decrease. Decrease: Decrease represents a reduction in value, amount, or performance over time.
Free with trial A 3d rendering of stack of gold bars with a red arrow pointing downwards, suggesting a decrease in the price or value of gold. Value price decrease illustrations Stack of gold bars with a red arrow pointing downwards
Free with trial A 3d rendering of stack of gold bars with a red arrow pointing downwards, suggesting a decrease in the price or value of gold. Value price decrease illustrations Stack of gold bars with a red arrow pointing downwards
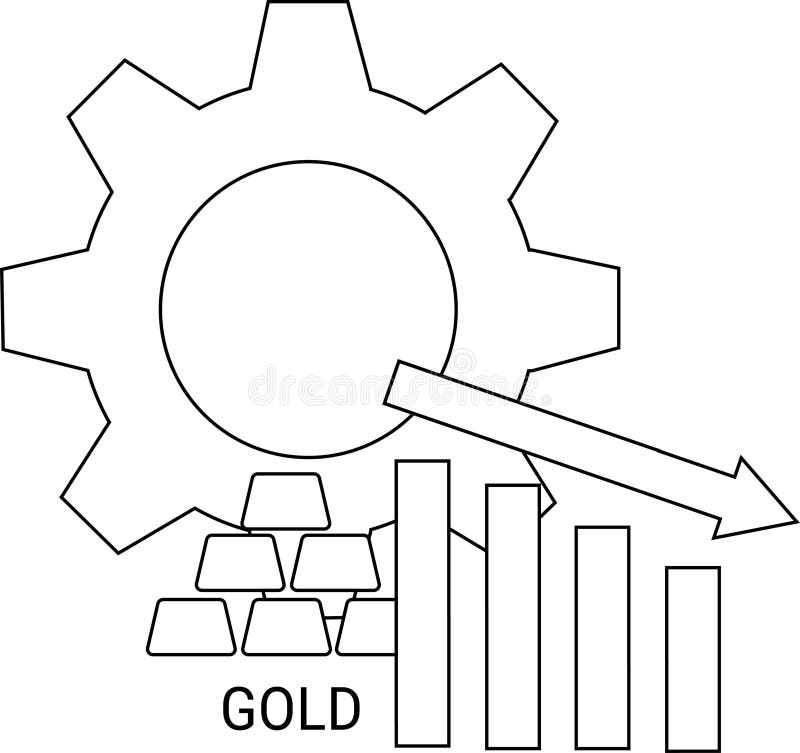
Free with trial Conceptual diagram depicting a decrease in gold production. Value price decrease illustrations Gold Production Decrease Gear, Bars, Arrow Concept. Conceptual diagram depicting a decrease in gold production.
Free with trial Isometric banner template showing inflation concept. Vector illustration of financial crisis, rising prices, and money value decrease. Data analysis report with charts and upward arrow for web design. Value price decrease vectors Inflation And Economic Crisis Data Analysis Isometric Banner Template Vector Illustration. Isometric banner template showing inflation concept. Vector illustration of financial crisis, rising prices, and money value decrease. Data analysis report with charts and upward arrow for web design
Free with trial Euro Currency Decrease Icons with Downward Arrow vol 30127. Value price decrease vectors Euro Currency Decrease Icons with Downward Arrow
Free with trial A conceptual icon representing a downturn in the housing market. A bold arrow points down into a house silhouette, symbolizing falling property values, price reductions, or a real estate recession. Value price decrease vectors House Price Reduction Vector Icon. A conceptual icon representing a downturn in the housing market. A bold arrow points down into a house silhouette, symbolizing falling property values, price reductions, or a real estate recession
Free with trial Arrow icon with percent symbol, economic growth, increase, decrease arrow, up and down arrow icon. Value price decrease vectors Arrow icon with percent symbol, economic growth, increase, decrease arrow, up and down arrow icon
Free with trial Arrow icon with percent symbol, economic growth, increase, decrease arrow, up and down arrow icon. Value price decrease vectors Arrow icon with percent symbol, economic growth, increase, decrease arrow, up and down arrow icon