Free with trial The leader wants the financial projections from the CFO even though it is obvious the company is losing money. Analysis decrease illustrations Financial Projections
Free with trial Analytical Reports Icon with Outline Style and Editable Stroke. Stack of Reports with Graphs and Charts. Analysis decrease vectors Analytical Reports Icon with Outline Style and Editable Stroke
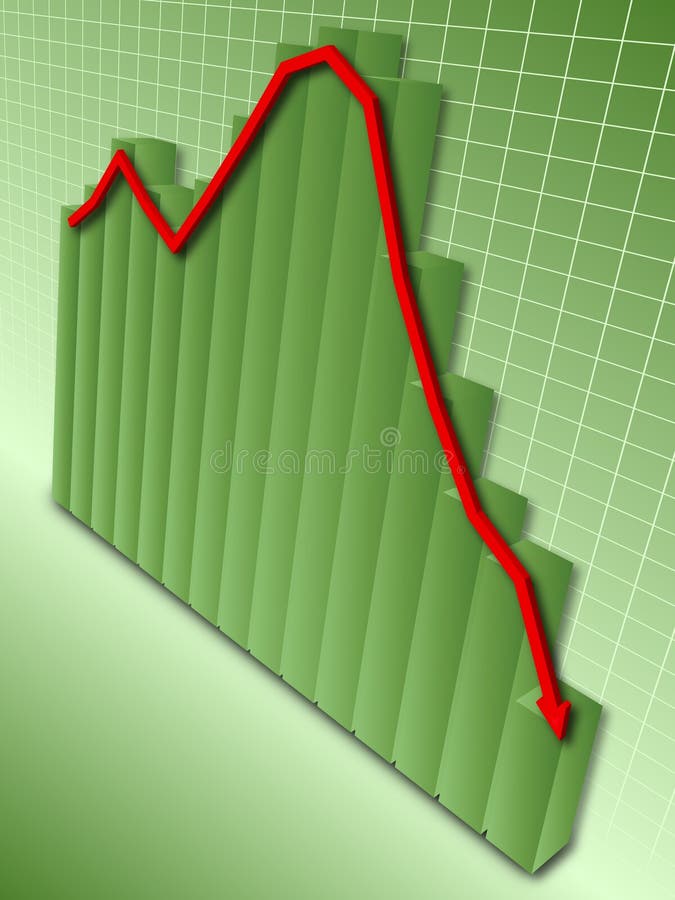
Free with trial Green bar graph with red arrow depicting downward trend of data symbolizing financial loss. Analysis decrease vectors Financial Loss
Free with trial Infographic timeline. Group, Diagram chart and Stats icons simple set. Certificate sign. Developers, Presentation graph, Business analysis. Verified document. Education set. 4 steps layout. Vector. Analysis decrease vectors Group, Diagram chart and Stats icons set. Certificate sign. Developers, Presentation graph, Business analysis. Vector. Infographic timeline. Group, Diagram chart and Stats icons simple set. Certificate sign. Developers, Presentation graph, Business analysis. Verified document. Education set. 4 steps layout. Vector
Free with trial Dollar increase decrease icon. Money symbol with arrow stretching rising up and drop fall down. Business cost sale and reduction icon. vector illustration. Analysis decrease vectors Dollar increase decrease icon. Money symbol with arrow stretching rising up and drop fall down. Business cost sale and reduction i
Free with trial On the blackboard analysis of the dynamics of the business, sales. Analysis decrease vectors On the board an analysis of business activities. On the blackboard analysis of the dynamics of the business, sales
Free with trial Market trend icon in flat style. Decline arrow with magnifier vector illustration on white isolated background. Decrease business concept. Analysis decrease vectors Market trend icon in flat style. Decline arrow with magnifier vector illustration on white isolated background. Decrease business
Free with trial Dollar rate decrease and increase, money arrow up and down. Vector icon template. Analysis decrease vectors Dollar rate decrease and increase, money arrow up and down. Vector icon template
Free with trial Set Global economic crisis, Burning dollar bill, Dollar rate decrease and. Business infographic template. Vector. Analysis decrease vectors Set Global economic crisis, Burning dollar bill, Dollar rate decrease and . Business infographic template. Vector
Free with trial Checklist, Idea and Stats icons simple set. Heartbeat sign. Graph report, Solution, Business analysis. Medical heart. Science set. Linear checklist icon. Colorful design set. Vector. Analysis decrease vectors Checklist, Idea and Stats icons set. Heartbeat sign. Graph report, Solution, Business analysis. Medical heart. Vector. Checklist, Idea and Stats icons simple set. Heartbeat sign. Graph report, Solution, Business analysis. Medical heart. Science set. Linear checklist icon. Colorful design set. Vector
Free with trial Group, Diagram chart and Stats icons simple set. Infographic timeline. Certificate sign. Developers, Presentation graph, Business analysis. Verified document. Education set. Cycle infographic. Vector. Analysis decrease vectors Group, Diagram chart and Stats icons set. Certificate sign. Developers, Presentation graph, Business analysis. Vector. Group, Diagram chart and Stats icons simple set. Infographic timeline. Certificate sign. Developers, Presentation graph, Business analysis. Verified document. Education set. Cycle infographic. Vector
Free with trial Stock market investment trading technical analysis candlestick, bar, line and area chart set on white background. Business candle stick graph exchange trends. Trader financial investment index. Vector. Analysis decrease vectors Stock market investment trading technical analysis candlestick, bar, line and area chart set on white background
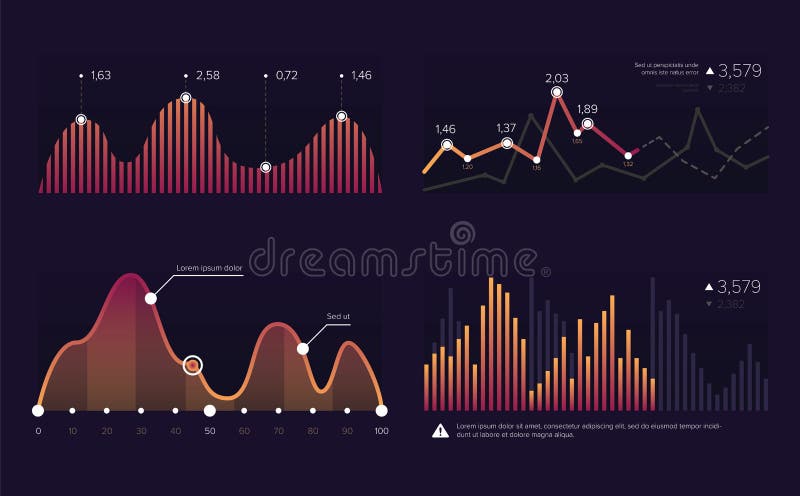
Free with trial Vector image charts and diagrams for presentation or financial report. Infographics concept. Increase and decrease of indicators in graphic diagram. Colorful vector illustration. Analysis decrease vectors Vector image charts and diagrams for presentation or financial report. Infographics concept.Increase and decrease of
Free with trial This image depicts wheat price analysis, showcasing agricultural economics and market trends. It emphasizes crop valuation, finance, and investment strategies in detail. Analysis decrease vectors Vector art of wheat price analysis a visual representation of agricultural economics and market trends with a focus on crop. This image depicts wheat price analysis, showcasing agricultural economics and market trends. It emphasizes crop valuation, finance, and investment strategies in detail
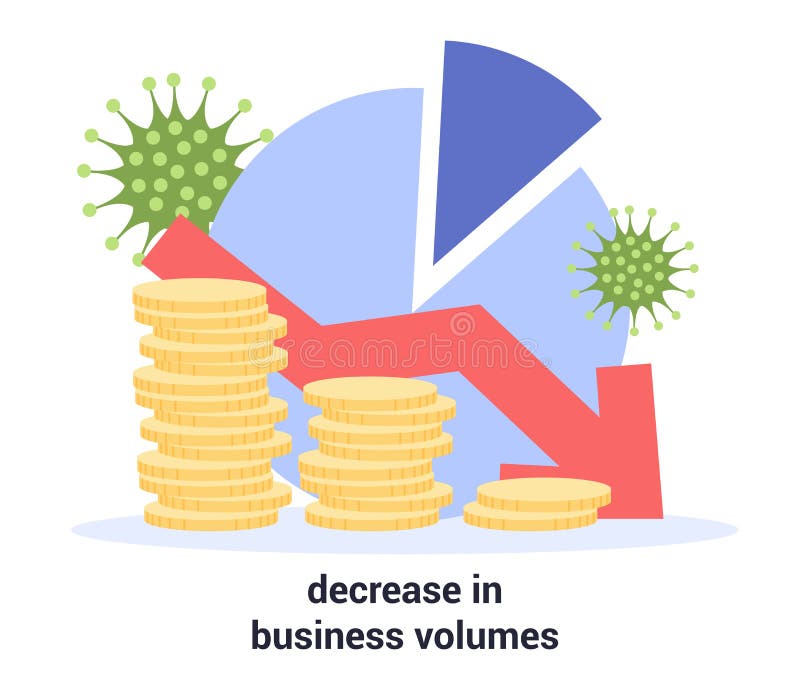
Free with trial Global decrease of business volumes due to COVID-19. 2019-nCoV, pandemic global impact. Isolated vector illustration. Analysis decrease vectors Global decrease of business volumes due to COVID-19. 2019-nCoV
Free with trial Red business graph being analyzed with magnifying glass. Analysis decrease vectors Analysis. Red business graph being analyzed with magnifying glass
Free with trial Statistic. Data analysis. Business and financial concept. Analysis decrease vectors Statistic
Free with trial Concept for risk analysis and risk management. Flat design illustration. Analysis decrease vectors Risk management
Free with trial Business strategy isometric icons set with brainstorming and analysis symbols on blue background isolated vector illustration. Analysis decrease vectors Business Strategy Icons Set. Business strategy isometric icons set with brainstorming and analysis symbols on blue background isolated vector illustration
Free with trial Economic forecast with financial stock value prediction tiny person concept. Business analysis as falling roller coaster up and down vector illustration. Money crisis and global decrease recession. Analysis decrease vectors Economic forecast with financial stock value prediction tiny person concept
Free with trial A 3D render shows a red thermometer with a white scale and a red bulb on the left, next to a blue square icon with two white downward-pointing arrows on the right. Both objects are isolated on a white background. The thermometer indicates a low temperature, and the down arrow suggests a decrease or decline. Analysis decrease illustrations Red Thermometer Icon Next to Blue Down Arrow Symbol on White Background temperature heat. A 3D render shows a red thermometer with a white scale and a red bulb. A 3D render shows a red thermometer with a white scale and a red bulb on the left, next to a blue square icon with two white downward-pointing arrows on the right. Both objects are isolated on a white background. The thermometer indicates a low temperature, and the down arrow suggests a decrease or decline
Free with trial Decreasing Report Meaning Graphic Statistics And Trend. Analysis decrease illustrations Decreasing Report Shows Graphic Analysis And Graphs. Decreasing Report Meaning Graphic Statistics And Trend
Free with trial Set statistics icon. Graphic analysis and asset management. Information chart profits. Business efficiency and investment. finance data. Line art, web and mobile app. Analysis decrease vectors Set statistics icon
Free with trial Cost reduction concept. Downward arrow. finance decrease diagram. Decrease down profit. Vector illustration. Analysis decrease vectors Cost reduction concept. Downward arrow
Free with trial Set statistics icon. Graphic analysis and asset management. Information chart profits. Business efficiency and investment. finance data. flat design. Analysis decrease vectors Set statistics icon
Free with trial Chart graph. Black Icon growth and downward with arrow isolated on background. Hologram positive, fall percentage. Design business concept direction growth, recession. Analysis. Vector illustration. Analysis decrease vectors Chart graph. Black Icon growth and downward with arrow. Hologram positive, fall percentage. Design business. Vector illustration. Chart graph. Black Icon growth and downward with arrow isolated on background. Hologram positive, fall percentage. Design business concept direction growth, recession. Analysis. Vector illustration
Free with trial Stock crisis red price drop down chart fall / Stock market exchange analysis or forex graph business and finance crash money losing moving economic investment loss. Analysis decrease illustrations Stock crisis red price drop down chart fall
Free with trial Economic crisis and money loss color line icons, downturn and bankruptcy symbols, vector economy. Financial recession, world finance and bank crisis, oil price decrease, stock market crash outline set. Analysis decrease vectors Economic crisis and money loss color line icons
Free with trial Concept Of Mortgage rate decline visualized as house symbol decrease. Analysis decrease illustrations Mortgage rate decline visualized as house symbol decrease
Free with trial Digital marketing strategy mistake fall down decrease with down arrow and modern flat style - vector illustration. Analysis decrease illustrations Digital marketing strategy mistake fall down decrease with down arrow and modern flat style - vector
Free with trial UK. London Stock Exchange market crisis red market price down chart fall / Stock analysis or forex charts graph Business and finance money crisis background red negative drop in sales economic fall. Analysis decrease illustrations UK. London Stock Exchange market crisis red market price down chart fall Business and finance money crisis background red negative. UK. London Stock Exchange market crisis red market price down chart fall / Stock analysis or forex charts graph Business and finance money crisis background red negative drop in sales economic fall
Free with trial Set of four red downward pointing arrows designed as parallel bars for internet and web use to show a decrease, negative return, loss or failure or as a direction pointer, design element. Analysis decrease illustrations Set of four red downward pointing arrows
Free with trial Down market, decrease graph icon design vector. Analysis decrease vectors Down market, decrease graph icon design
Free with trial Decline stage concept. Finance crisis with falling down graph and income decrease. Idea of bancruptcy and business risk. Money loss. Isolated flat vector illustration. Analysis decrease vectors Decline stage concept. Finance crisis with falling down graph
Free with trial Stock market icons. Set of 10 stock market trendy minimal icons. Bear, Bull, market analysis, Stock Exchange icon. Design signs for web page, mobile app, packaging design. Vector illustration. Analysis decrease vectors Stock market icons set. Stock market icons. Set of 10 stock market trendy minimal icons. Bear, Bull, market analysis, Stock Exchange icon. Design signs for web page, mobile app, packaging design. Vector illustration.
Free with trial This 3D rendering showcases a downward trending red arrow overlaid on a staircase, visually representing a declining market. The bar graph at the bottom further emphasizes the decrease. This image was generated by AI, ideal for illustrating financial news or presentations. Analysis decrease illustrations Falling Market Trend. This 3D rendering showcases a downward trending red arrow overlaid on a staircase, visually representing a declining market. The bar graph at the bottom further emphasizes the decrease. This image was generated by AI, ideal for illustrating financial news or presentations.
Free with trial Simple set of Security app, Computer cables and Loyalty points line icons. Include Shield, 360 degree, Cardboard box icons. Certificate, Discount button, Analysis graph web elements. Vector. Analysis decrease illustrations Simple set of Security app, Computer cables and Loyalty points line icons. For web application. Vector. Simple set of Security app, Computer cables and Loyalty points line icons. Include Shield, 360 degree, Cardboard box icons. Certificate, Discount button, Analysis graph web elements. Vector
Free with trial Artificial intelligence, Question mark and Open box icons simple set. Halftone dots button. Candlestick chart sign. Mind intellect, Quiz chat, Delivery package. Report analysis. Technology set. Vector. Analysis decrease vectors Artificial intelligence, Question mark and Open box icons set. Candlestick chart sign. Vector. Artificial intelligence, Question mark and Open box icons simple set. Halftone dots button. Candlestick chart sign. Mind intellect, Quiz chat, Delivery package. Report analysis. Technology set. Vector
Free with trial Financial crisis concept. cost reduction strategy and analysis. pile of dollar coin fall down symbol. economic decline, downfall, crisis and bankrupt. Business vector background illustration. Analysis decrease vectors Financial crisis concept. cost reduction strategy and analysis. pile of dollar coin fall down symbol. economic decline, downfall
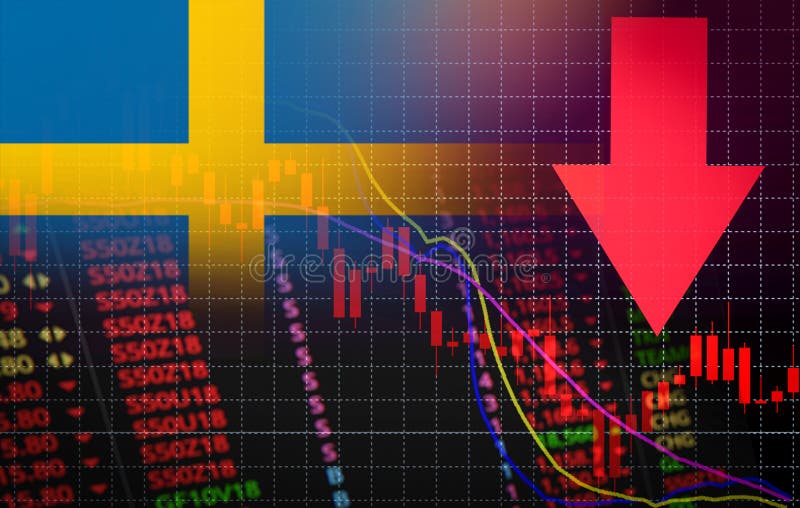
Free with trial Sweden Stock Exchange market crisis red market price down chart fall / Stock analysis or forex charts graph Business and finance money crisis red negative drop in sales economic fall. Analysis decrease illustrations Sweden Stock Exchange market crisis red market price down chart fall Business and finance money crisis red negative drop in sales. Sweden Stock Exchange market crisis red market price down chart fall / Stock analysis or forex charts graph Business and finance money crisis red negative drop in sales economic fall
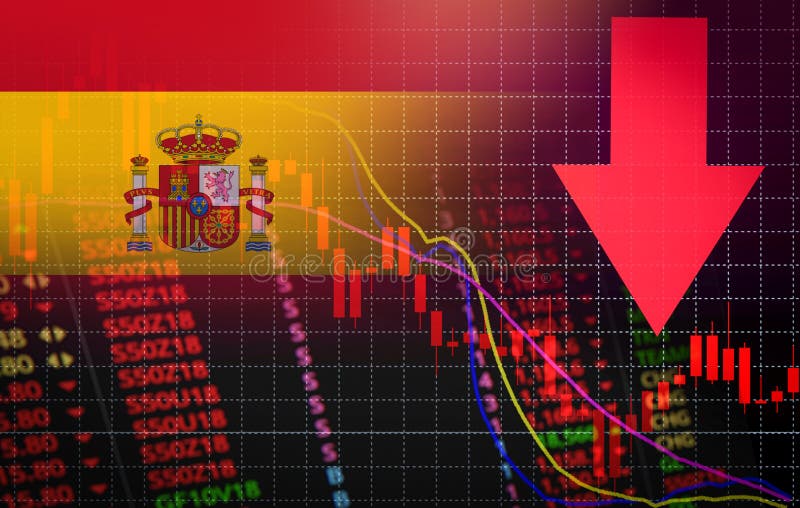
Free with trial Spain Stock Exchange market crisis red market price down chart fall / Stock analysis or forex charts graph Business and finance money crisis red negative drop in sales economic fall. Analysis decrease illustrations Spain Stock Exchange market crisis red market price down chart fall Business and finance money crisis red negative drop in sales. Spain Stock Exchange market crisis red market price down chart fall / Stock analysis or forex charts graph Business and finance money crisis red negative drop in sales economic fall
Free with trial Canada Stock Exchange market crisis red market price down chart fall / Stock analysis or forex charts graph Business and finance money crisis background red negative drop in sales economic fall. Analysis decrease illustrations Canada Stock Exchange market crisis red market price down chart fall Business and finance money crisis background red negative. Canada Stock Exchange market crisis red market price down chart fall / Stock analysis or forex charts graph Business and finance money crisis background red negative drop in sales economic fall
Free with trial Red business graph with red arrow down, represents decrease in the year 2020, three-dimensional rendering, 3D illustration. Analysis decrease illustrations Business graph down 2020. Red business graph with red arrow down, represents decrease in the year 2020, three-dimensional rendering, 3D illustration
Free with trial Red business graph with red arrow down, represents decrease in the year 2019, three-dimensional rendering, 3D illustration. Analysis decrease illustrations Business graph down 2019. Red business graph with red arrow down, represents decrease in the year 2019, three-dimensional rendering, 3D illustration
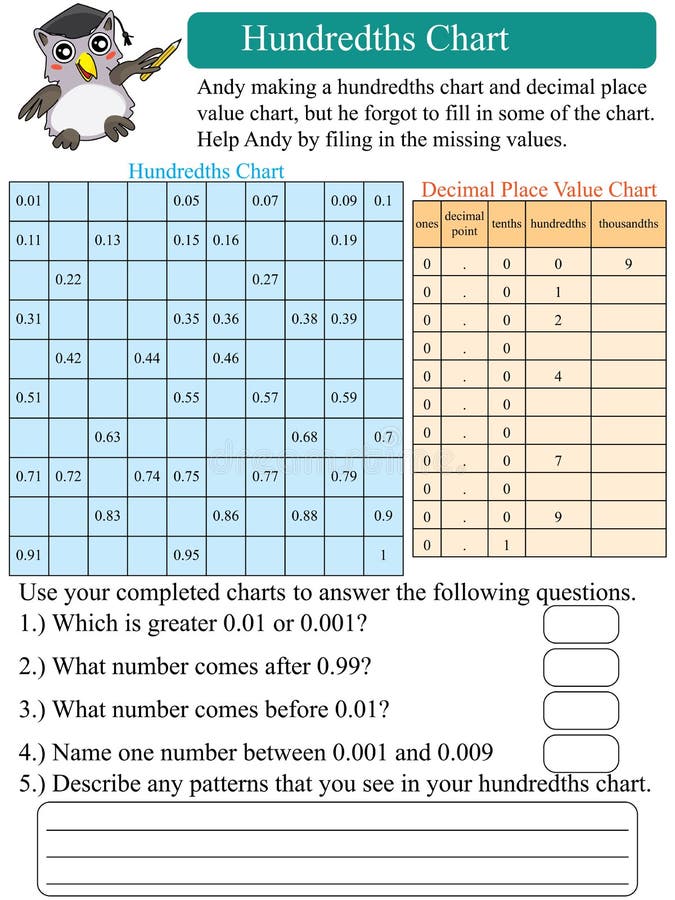
Free with trial Illustration design mathematics hundredths chart question. Analysis decrease vectors Mathematics hundredths chart
Free with trial Background business, abstract image of a computer screen of abstract stock market data. Analysis decrease illustrations Stock Market Data Screen. Background business, abstract image of a computer screen of abstract stock market data
Free with trial A conceptual image of a clipboard with a pie chart on it with a floating pen and some paper. Analysis decrease illustrations Clipboard With Piechart 71. A conceptual image of a clipboard with a pie chart on it with a floating pen and some paper.
Free with trial Background business, abstract image of a computer screen of abstract stock market data. Analysis decrease illustrations Stock Market Screen. Background business, abstract image of a computer screen of abstract stock market data
Free with trial Background business, abstract image of a computer screen of abstract stock market data. Analysis decrease illustrations Global Market Data Screen. Background business, abstract image of a computer screen of abstract stock market data
Free with trial An arrow plunges, depicted on the side of a stack of books, representing the death of the old-fashioned publishing industry in an era of e-books and new media. Analysis decrease illustrations Decline of Publishing Industry - Falling Sales. An arrow plunges, depicted on the side of a stack of books, representing the death of the old-fashioned publishing industry in an era of e-books and new media
Free with trial An Image representing global inequality. Analysis decrease illustrations The Rich Poor Divide. An Image representing global inequality.
Free with trial An image of a graphical pie chart, it could be useful for business concepts. Analysis decrease illustrations Pie Chart 127. An image of a graphical pie chart, it could be useful for business concepts.
Free with trial Stock market charts and graphs, Vector illustration template design. Analysis decrease vectors Vector stock market charts and graphs. Stock market charts and graphs, Vector illustration template design
Free with trial Businessmen falling down toward the economic crisis. Analysis decrease illustrations Businessmen falling down
Free with trial Declining chart and sad shareholder. Analysis decrease illustrations Shares fell. Declining chart and sad shareholder
Free with trial Business with startup ideas realization and team icons set flat isolated vector illustration. Analysis decrease vectors Business icons set. Business with startup ideas realization and team icons set flat isolated vector illustration
Free with trial An image of a graphical pie chart, it could be useful for business concepts. Analysis decrease illustrations Pie Chart 161. An image of a graphical pie chart, it could be useful for business concepts.
Free with trial Illustration that represent a business crisis. Analysis decrease vectors Business crisis
Free with trial Abstract stats graph chart yellow background design. Analysis decrease illustrations Graph background. Abstract stats graph chart yellow background design
Free with trial Chart of sales is in decline, but the businessman was planning success. Analysis decrease vectors Business failure. Chart of sales is in decline, but the businessman was planning success
Free with trial Three dimensional view of loss arrows. Analysis decrease illustrations View of loss arrows
Free with trial Business financial crisis concept diagram with big weight. Analysis decrease illustrations Business financial crisis concept diagram
Free with trial Profit warning and economic market value decline as a financial metaphor for falling lower earnings guidance signs as a profits chart casting a down arrow as a 3D illustration. Analysis decrease illustrations Profit Warning Financial Idea. Profit warning and economic market value decline as a financial metaphor for falling lower earnings guidance signs as a profits chart casting a down arrow as a 3D illustration.
Free with trial Cost down business chart graph illustration design over white. Analysis decrease illustrations Cost down business chart graph
Free with trial Cost efficiency, quality and costs as production optimization outline set. Labeled diagram with performance improvement and financial profit growth vector illustration. Reduce spending and expenses. Analysis decrease vectors Cost, efficiency and quality as production expenses optimization outline set. Cost efficiency, quality and costs as production optimization outline set. Labeled diagram with performance improvement and financial profit growth vector illustration. Reduce spending and expenses.
Free with trial 3D illustration of a green dollar sign and a yellow humanoid figure holding a red arrow in a downward direction, isolated on a white background. Conceptual. Analysis decrease illustrations Dollar down concept. 3D illustration of a green dollar sign and a yellow humanoid figure holding a red arrow in a downward direction, isolated on a white background. Conceptual.
Free with trial Modern business technology background frame illustration. Analysis decrease illustrations Modern business technology frame illustration. Modern business technology background frame illustration
Free with trial Down trend Stock market or forex trading graph in graphic concept suitable for financial investment or Economic trends business idea and all art work design. Abstract finance background. Analysis decrease illustrations Stock market or forex trading graph in graphic concept suitable
Free with trial The small houses with a green roof on diagramme background. Analysis decrease illustrations The houses. The small houses with a green roof on diagramme background
Free with trial Bar graph with magnifying glass. Analysis decrease vectors Decreasing Bar Graph. Bar graph with magnifying glass
Free with trial Declining chart and businessman in panic. Analysis decrease illustrations Business crash. Declining chart and businessman in panic.
Free with trial 3d render image of silver bars with declining graph. Analysis decrease illustrations Silver with declining graph. 3d render image of silver bars with declining graph
Free with trial Line chart with points. Positive and negative index. Business concept. Analysis decrease vectors Line chart with points. Positive and negative index. Business concept
Free with trial Crisis in travel and tourism industry. Graph and diagram from suitcases on the map of world. 3d illustration. Analysis decrease illustrations Crisis in travel and tourism industry. Graph and diagram from suitcases on the map of world
Free with trial Stick figures with plus or minus an making a decision. Analysis decrease vectors Stick figures with plus or minus
Free with trial Color Business Graph and Chart Set. Vector. Analysis decrease vectors Color Business Graph and Chart Set
Free with trial Declining business report bar chart. Analysis decrease illustrations Declining business report bar chart
Free with trial Declining business report bar chart. Analysis decrease illustrations Declining business report bar chart
Free with trial Isometric world financial crisis set with isolated human characters of business people money and infographic icons vector illustration. Analysis decrease vectors Financial Crisis Icon Set. Isometric world financial crisis set with isolated human characters of business people money and infographic icons vector illustration