Free with trial Black arrows illustrating an upward and downward zigzag fluctuation, symbolizing a dynamic process of movement, change, and varying trends on a clean white background. Analysis decrease vectors Fluctuation movement with up and down zigzag arrows. Black arrows illustrating an upward and downward zigzag fluctuation, symbolizing a dynamic process of movement, change, and varying trends on a clean white background
Free with trial Downward trend line on grid chart with sad face and progress icon signaling mediocre results or declining metrics. Ideal for failure, analytics, market loss, strategy, performance, results, simple. Analysis decrease illustrations Declining Trend on Graph with Sad Face Symbolizing Negative Results or Performance. Downward trend line on grid chart with sad face and progress icon signaling mediocre results or declining metrics. Ideal for failure, analytics, market loss, strategy, performance, results, simple
Free with trial Flat vector illustration of a colorful bar graph showing a decreasing trend with an arrow on a black backdrop. Analysis decrease vectors Decreasing bar graph with downward arrow on black background. Flat vector illustration of a colorful bar graph showing a decreasing trend with an arrow on a black backdrop.
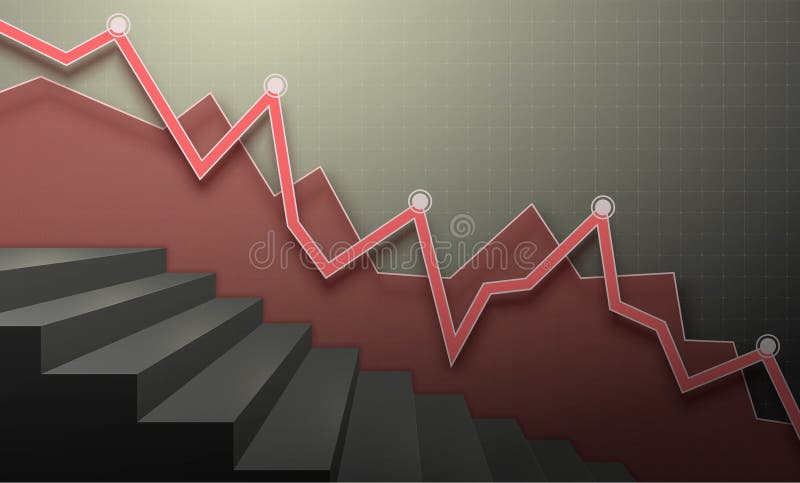
Free with trial Red financial chart with descending lines and a ladder. Vector 3D illustration. Analysis decrease vectors Red financial chart with descending lines and a ladder. Vector 3D
Free with trial Vector graphic showing business profit and loss statement with green upward trends, red declines, percentages, calculator, and money icons. Analysis decrease illustrations Illustrated Profit and Loss Financial Report with Charts and Graphs. Vector graphic showing business profit and loss statement with green upward trends, red declines, percentages, calculator, and money icons
Free with trial Declining Business Line Graph Icon Set vol 32485. Analysis decrease vectors Declining Business Line Graph Icon Set
Free with trial An illustration showing a declining blue bar graph with a sad person icon next to a downward arrow in flat style. Analysis decrease vectors Declining bar graph with a sad person illustration. An illustration showing a declining blue bar graph with a sad person icon next to a downward arrow in flat style.
Free with trial Downward Trend Line Graph Icons for Financial Data vol 34820. Analysis decrease vectors Downward Trend Line Graph Icons for Financial Data
Free with trial Sad face beside a chart showing a downward curve, circular target design, and finger tap icon. Ideal for business losses, failure, feedback, analytics, disappointment usability data trends. Simple. Analysis decrease vectors Declining Trend Displayed with Sad Face, Downward Graph Line, and Finger Tap Icon. Sad face beside a chart showing a downward curve, circular target design, and finger tap icon. Ideal for business losses, failure, feedback, analytics, disappointment usability data trends. Simple
Free with trial Decreasing Bar Chart Icons for Business Analytics vol 34819. Analysis decrease vectors Decreasing Bar Chart Icons for Business Analytics
Free with trial Creative Productivity Falling Chart Made of Clock Symbols on Yellow Background. Deadline Pressure and Productivity Decline. Analysis decrease illustrations Creative Productivity Falling Chart Made of Clock Symbols on Yellow Background. Deadline Pressure and Productivity Decline
Free with trial Decline Chart : A decline chart illustrates a decrease in financial performance, sales, or market value over time. Analysis decrease illustrations Decline Chart
Free with trial Tax Graph Down : A Tax Graph Down represents a decrease in tax revenue or a financial decline. Analysis decrease vectors Tax Graph Down
Free with trial A contrasting vector graphic set showing rising green bars with an upward arrow and falling red bars with a downward arrow, representing financial growth and decline. Analysis decrease vectors Business bar charts indicating growth and decline. A contrasting vector graphic set showing rising green bars with an upward arrow and falling red bars with a downward arrow, representing financial growth and decline
Free with trial Business decline. Bar chart falling growth levels, paired with a sad face icon negative outcomes. Ideal for business reports, marketing, finance, corporate strategy, data visualization. Analysis decrease illustrations Declining Business Growth Concept with Negative Emotional Impact Icon. Business decline. Bar chart falling growth levels, paired with a sad face icon negative outcomes. Ideal for business reports, marketing, finance, corporate strategy, data visualization
Free with trial Marketing investment and budget speech bubble on blue background. Analysis decrease illustrations Marketing investment and budget speech bubble on blue
Free with trial A flat design bar chart displays a downward trend, highlighted by a red arrow. Minimalist graphic, illustrative style. Analysis decrease vectors Flat bar chart showing downward trend with red arrow. A flat design bar chart displays a downward trend, highlighted by a red arrow. Minimalist graphic, illustrative style.
Free with trial A set of financial growth and decline chart icons featuring up and down arrows with colorful bars, indicating economic trends. the concept of financial market increases, decreases and fluctuations. Analysis decrease vectors Set of Financial Fluctuation Chart Icons in Flat Design. A set of financial growth and decline chart icons featuring up and down arrows with colorful bars, indicating economic trends. the concept of financial market increases, decreases and fluctuations
Free with trial Iconic green arrow graph rising, symbolizing growth and success, contrasted with a red arrow graph falling, representing decline. Flat design graphic. Analysis decrease vectors Jagged arrows indicating fluctuating market trends. Iconic green arrow graph rising, symbolizing growth and success, contrasted with a red arrow graph falling, representing decline. Flat design graphic
Free with trial Problem of bankruptcy for girl lost savings due to financial crisis, sitting near falling economic chart. Girl is bankruptcy fighter after being fired from job and losing investments. Analysis decrease vectors Problem of bankruptcy for girl lost savings due to financial crisis, sitting near falling chart. Problem of bankruptcy for girl lost savings due to financial crisis, sitting near falling economic chart. Girl is bankruptcy fighter after being fired from job and losing investments.
Free with trial Bankruptcy concept in flat design business. design vector illustration. Analysis decrease vectors Bankruptcy finance business concept flat vector design. bankruptcy concept in flat design business.design vector illustration
Free with trial Red frowning face, line graph showing decline, pants, and small graph inset. Ideal for retail, business trends, economic downturn, loss, failure clothing sales simple flat metaphor. Analysis decrease illustrations Declining Sales Concept with Frowning Face, Pants, and Downward Line Graph. Red frowning face, line graph showing decline, pants, and small graph inset. Ideal for retail, business trends, economic downturn, loss, failure clothing sales simple flat metaphor
Free with trial Wooden blocks spelling tax with stacks of golden and silver coins on a rustic surface. Analysis decrease illustrations Tax word on wooden blocks with coin stacks. Wooden blocks spelling tax with stacks of golden and silver coins on a rustic surface
Free with trial A stylized illustration of a descending bar graph within a website window, rendered in a flat, minimalist design. Analysis decrease vectors Decreasing bar graph inside a website window interface. A stylized illustration of a descending bar graph within a website window, rendered in a flat, minimalist design.
Free with trial Flat icon showing a person, bars decreasing, and a downturn arrow next to a cross. Analysis decrease vectors Declining performance icon: person, bars, arrow, and cross. Flat icon showing a person, bars decreasing, and a downturn arrow next to a cross
Free with trial Abstract bull and bear market graph. Analysis decrease illustrations Bull and Bear Neon Silhouettes on Stock Market Data Chart Background. Abstract bull and bear market graph
Free with trial The image depicts mitigation strategies for risk management and security. It features three icons representing different aspects of mitigation. The top left icon shows a shield over a grid, symbolizing protection and security measures. The top right icon depicts a person escaping from a striped box, indicating risk avoidance or escape. The bottom icon displays a downward trend line, representing a. Analysis decrease vectors Mitigation strategies for risk management and security
Free with trial Person seated on bar chart with laptop, upward and downward arrows, cloud element. Ideal for data trends, analytics, cloud computing, statistics, progress tracking, career growth simple flat. Analysis decrease vectors Woman Analyzing Data on Laptop, Representing Cloud-Based Growth and Decline Trends. Person seated on bar chart with laptop, upward and downward arrows, cloud element. Ideal for data trends, analytics, cloud computing, statistics, progress tracking, career growth simple flat
Free with trial Flat design vector illustration of a green arrow pointing up with a percent sign and a red arrow pointing down with a percent sign, representing growth and decline. Analysis decrease vectors Statistical change with up and down percentage icons. Flat design vector illustration of a green arrow pointing up with a percent sign and a red arrow pointing down with a percent sign, representing growth and decline
Free with trial Economic crisis and money loss outline icon. Economy bankruptcy gander, economic crisis or financial problem, money loss line vector sign. Business downturn linear pictogram or symbol with dollar bill. Analysis decrease vectors Economic crisis and money loss outline icon
Free with trial Sad face beside a downward trend graph with red nodes, a pointing hand, blue card. Ideal for business loss, economic decline, poor performance, failure, recession, financial crisis simple flat. Analysis decrease vectors Declining Line Graph with Sad Face and Pointer Highlighting Negative Performance. Sad face beside a downward trend graph with red nodes, a pointing hand, blue card. Ideal for business loss, economic decline, poor performance, failure, recession, financial crisis simple flat
Free with trial Two simple icons representing financial market performance, one showing a downward trend and the other an upward trend, both with dollar symbols. Analysis decrease vectors Financial graph icons showing market trends up and down. Two simple icons representing financial market performance, one showing a downward trend and the other an upward trend, both with dollar symbols
Free with trial Downgrade credit rating, businessman hit star credit rating with big hammer. Analysis decrease vectors Downgrade credit rating, businessman hit star credit rating with big hammer
Free with trial A clean black and white set of nine vector icons showing growth, decline, stability, and financial trends for business presentations and reports. Analysis decrease vectors Economic trend icons set flat design vector illustration. A clean black and white set of nine vector icons showing growth, decline, stability, and financial trends for business presentations and reports.
Free with trial Abstract financial data visualization graphic. Analysis decrease illustrations Blue Digital Data Visualization Abstract Background with Bars and Lines. Abstract financial data visualization graphic
Free with trial Downgrade credit rating, businessman hit star credit rating with big hammer. Analysis decrease vectors Downgrade credit rating, businessman hit star credit rating with big hammer.
Free with trial A striking 3D isometric illustration featuring a blue house icon positioned above a downward-trending red arrow and a blue base, all set against a clean white background. This graphic powerfully symbolizes a falling housing market, real estate crisis, property value depreciation, economic recession, or financial downturn. It's an ideal visual for conveying concepts of market instability, investment risks, and challenges within the housing industry, suitable for financial reports, news articles, and business presentations. Analysis decrease vectors Housing Market Decline with Downward Arrow Icon. A striking 3D isometric illustration featuring a blue house icon positioned above a downward-trending red arrow and a blue base, all set against a clean white background. This graphic powerfully symbolizes a falling housing market, real estate crisis, property value depreciation, economic recession, or financial downturn. It's an ideal visual for conveying concepts of market instability, investment risks, and challenges within the housing industry, suitable for financial reports, news articles, and business presentations.
Free with trial A money loss chart icon featuring a downward arrow and a dollar sign, indicating financial decline. concepts of economic decline, financial losses, and negative trends, financial and business. Analysis decrease vectors Economic Downturn Chart with Decreasing Bars and Dollar Sign. A money loss chart icon featuring a downward arrow and a dollar sign, indicating financial decline. concepts of economic decline, financial losses, and negative trends, financial and business
Free with trial Two black bar chart graphs with a rising arrow and a falling arrow on a white background, indicating growth and decline in data or business performance. Scalable format print and digital media. Analysis decrease vectors Black bar chart graphs with rising and falling arrows rising arrow. Two black bar chart graphs with a rising arrow and a falling arrow on a white background, indicating growth and decline in data or business performance. Scalable format print and digital media
Free with trial Economic downturn, financial stress, investment failure, business loss, market decline, risk. Line graph shows downward trend. Financial stress and economic downturn. Analysis decrease illustrations Financial Loss Concept with Declining Line Graph, Sad Face, and Coin Symbol. Economic downturn, financial stress, investment failure, business loss, market decline, risk. Line graph shows downward trend. Financial stress and economic downturn
Free with trial The image depicts a bar graph with a downward trend. The bars start at a higher value and progressively decrease, indicating a decline. An arrow at the end of the graph further emphasizes the downward direction. Analysis decrease illustrations Decreasing bar graph. The image depicts a bar graph with a downward trend. The bars start at a higher value and progressively decrease, indicating a decline. An arrow at the end of the graph further emphasizes the downward direction
Free with trial Flat design illustration showing downward trend with graph, coins and descending arrow. Demonstrates financial loss and market decline. Analysis decrease vectors Declining financial graph with downward trend and currency. Flat design illustration showing downward trend with graph, coins and descending arrow. Demonstrates financial loss and market decline.
Free with trial Bankruptcy, economic crisis and money loss line icon. Business money loss, company bankruptcy gander or economic recession risk outline vector icon. Financial problem symbol with broken piggybank. Analysis decrease vectors Bankruptcy, economic crisis and money loss icon. Bankruptcy, economic crisis and money loss line icon. Business money loss, company bankruptcy gander or economic recession risk outline vector icon. Financial problem symbol with broken piggybank
Free with trial A graphic depicting financial downturn. A red arrow slants downwards across a yellow circle containing a dollar sign, indicating loss. Analysis decrease vectors Red arrow graph shows financial decline with dollar symbol. A graphic depicting financial downturn. A red arrow slants downwards across a yellow circle containing a dollar sign, indicating loss
Free with trial A bar chart showing a steady decline with a red downward arrow, symbolizing financial loss, economic downturn, business decline, or negative performance trends. Analysis decrease illustrations Economic Downtrend Bar Chart for Business concept 3d Rendering. A bar chart showing a steady decline with a red downward arrow, symbolizing financial loss, economic downturn, business decline, or negative performance trends
Free with trial A bar chart showing a steady decline with a red downward arrow, symbolizing financial loss, economic downturn, business decline, or negative performance trends. Analysis decrease illustrations Economic Downtrend Bar Chart for Business concept 3d Rendering. A bar chart showing a steady decline with a red downward arrow, symbolizing financial loss, economic downturn, business decline, or negative performance trends
Free with trial A bar chart showing a steady decline with a red downward arrow, symbolizing financial loss, economic downturn, business decline, or negative performance trends. Analysis decrease illustrations Economic Downtrend Bar Chart for Business concept 3d Rendering. A bar chart showing a steady decline with a red downward arrow, symbolizing financial loss, economic downturn, business decline, or negative performance trends
Free with trial A bar chart showing a steady decline with a red downward arrow, symbolizing financial loss, economic downturn, business decline, or negative performance trends. Analysis decrease illustrations Economic Downtrend Bar Chart for Business concept 3d Rendering. A bar chart showing a steady decline with a red downward arrow, symbolizing financial loss, economic downturn, business decline, or negative performance trends
Free with trial A professional businessman analyzes private equity portfolio management data on a large screen, evaluating ebitda growth, revenue increase, and cost optimization charts while taking notes. Analysis decrease vectors Man Analyzing Financial Charts for Private Equity Portfolio. A professional businessman analyzes private equity portfolio management data on a large screen, evaluating ebitda growth, revenue increase, and cost optimization charts while taking notes
Free with trial Medicine bottle surrounded by upward and downward arrows with bar chart illustrating statistics and growth. Ideal for health, medicine, pharmaceutical industry, research, statistics, marketing, data. Analysis decrease vectors Medicine Bottle with Rising Arrow and Bar Chart Representing Growth and Decline Trends. Medicine bottle surrounded by upward and downward arrows with bar chart illustrating statistics and growth. Ideal for health, medicine, pharmaceutical industry, research, statistics, marketing, data
Free with trial A simplified flat style icon displays a declining bar graph with arrow. Focuses on business and financial themes. Analysis decrease vectors Flat icon illustration showing bar chart trending downwards. A simplified flat style icon displays a declining bar graph with arrow. Focuses on business and financial themes.
Free with trial Business trends, financial shifts, growth, decline, recovery, cloud computing. Downward blue arrow and upward symbol towards a cloud. financial shifts and growth concepts. Analysis decrease vectors Decrease and Growth Concept with Downward Arrow and Rising Symbol Towards a Cloud. Business trends, financial shifts, growth, decline, recovery, cloud computing. Downward blue arrow and upward symbol towards a cloud. financial shifts and growth concepts
Free with trial A comprehensive set of vector line icons depicting bull and bear market trends. This collection features various combinations of bull and bear silhouettes integrated with financial charts, including rising and falling line graphs and bar graphs. Each icon clearly symbolizes either a bullish market (growth, upward trend) or a bearish market (decline, downward trend). Ideal for financial websites, trading applications, investment presentations, economic reports, infographics, and educational materials illustrating stock market dynamics and investment strategies. Analysis decrease vectors Bull and Bear Market Stock Trading Line Icons Set. A comprehensive set of vector line icons depicting bull and bear market trends. This collection features various combinations of bull and bear silhouettes integrated with financial charts, including rising and falling line graphs and bar graphs. Each icon clearly symbolizes either a bullish market (growth, upward trend) or a bearish market (decline, downward trend). Ideal for financial websites, trading applications, investment presentations, economic reports, infographics, and educational materials illustrating stock market dynamics and investment strategies.
Free with trial Digital financial crisis visual with downward arrow impacting a stock chart on a phone. Analysis decrease illustrations Digital Arrow Down on Smartphone Screen Showing Falling Stock Market Chart. Digital financial crisis visual with downward arrow impacting a stock chart on a phone
Free with trial Abstract green line graph on black background. Stock photo of financial chart. Analysis decrease illustrations Vibrant Green Lightning Bolt on Black Background, Electric Energy Discharge. Abstract green line graph on black background. Stock photo of financial chart
Free with trial Financial Loss Report Document Icon Set with Downward Trend vol 11427. Analysis decrease vectors Financial Loss Report Document Icon Set with Downward Trend
Free with trial A flat design shows a bar graph depicting decreasing sales, with a downward trending red arrow. Analysis decrease vectors Decreasing Business Chart Shows a Dramatic Downturn in Sales. A flat design shows a bar graph depicting decreasing sales, with a downward trending red arrow.
Free with trial A clean, minimalist illustration of a blue bar chart on a black backdrop, simple and effective visual for data presentation. Analysis decrease vectors Minimalist blue bar chart illustration on a black background. A clean, minimalist illustration of a blue bar chart on a black backdrop, simple and effective visual for data presentation.
Free with trial Candlestick chart line icon. Neumorphic, Flat shadow, 3d buttons. Analytics graph sign. Market analytics symbol. Line candlestick chart icon. Social media icons. Vector. Analysis decrease vectors Candlestick chart line icon. Analytics graph sign. Neumorphic buttons. Vector. Candlestick chart line icon. Neumorphic, Flat shadow, 3d buttons. Analytics graph sign. Market analytics symbol. Line candlestick chart icon. Social media icons. Vector
Free with trial Cost reduction concept with red downward arrow, bar chart, and coins on financial market background. Business finance idea for expense control, budgeting, and profit management. Analysis decrease illustrations Cost Reduction Strategy with Financial Chart and Arrow 3d render. Cost reduction concept with red downward arrow, bar chart, and coins on financial market background. Business finance idea for expense control, budgeting, and profit management
Free with trial Cost reduction concept with red downward arrow, bar chart, and coins on financial market background. Business finance idea for expense control, budgeting, and profit management. Analysis decrease illustrations Cost Reduction Strategy with Financial Chart and Arrow 3d render. Cost reduction concept with red downward arrow, bar chart, and coins on financial market background. Business finance idea for expense control, budgeting, and profit management
Free with trial Cost reduction concept with red downward arrow, bar chart, and coins on financial market background. Business finance idea for expense control, budgeting, and profit management. Analysis decrease illustrations Cost Reduction Strategy with Financial Chart and Arrow 3d render. Cost reduction concept with red downward arrow, bar chart, and coins on financial market background. Business finance idea for expense control, budgeting, and profit management
Free with trial Cost reduction concept with red downward arrow, bar chart, and coins on financial market background. Business finance idea for expense control, budgeting, and profit management. Analysis decrease illustrations Cost Reduction Strategy with Financial Chart and Arrow 3d render. Cost reduction concept with red downward arrow, bar chart, and coins on financial market background. Business finance idea for expense control, budgeting, and profit management
Free with trial Cost reduction concept with red downward arrow, bar chart, and coins on financial market background. Business finance idea for expense control, budgeting, and profit management. Analysis decrease illustrations Cost Reduction Strategy with Financial Chart and Arrow 3d render. Cost reduction concept with red downward arrow, bar chart, and coins on financial market background. Business finance idea for expense control, budgeting, and profit management
Free with trial Cost reduction concept with red downward arrow, bar chart, and coins on financial market background. Business finance idea for expense control, budgeting, and profit management. Analysis decrease illustrations Cost Reduction Strategy with Financial Chart and Arrow 3d render. Cost reduction concept with red downward arrow, bar chart, and coins on financial market background. Business finance idea for expense control, budgeting, and profit management
Free with trial Cost reduction concept with red downward arrow, bar chart, and coins on financial market background. Business finance idea for expense control, budgeting, and profit management. Analysis decrease illustrations Cost Reduction Strategy with Financial Chart and Arrow 3d render. Cost reduction concept with red downward arrow, bar chart, and coins on financial market background. Business finance idea for expense control, budgeting, and profit management
Free with trial Cost reduction concept with red downward arrow, bar chart, and coins on financial market background. Business finance idea for expense control, budgeting, and profit management. Analysis decrease illustrations Cost Reduction Strategy with Financial Chart and Arrow 3d render. Cost reduction concept with red downward arrow, bar chart, and coins on financial market background. Business finance idea for expense control, budgeting, and profit management
Free with trial Cost reduction concept with red downward arrow, bar chart, and coins on financial market background. Business finance idea for expense control, budgeting, and profit management. Analysis decrease illustrations Cost Reduction Strategy with Financial Chart and Arrow 3d render. Cost reduction concept with red downward arrow, bar chart, and coins on financial market background. Business finance idea for expense control, budgeting, and profit management
Free with trial A flat style graph depicting a downward trend with declining bars and arrow. Strong use of contrasting colors. Analysis decrease vectors Declining bar graph showing negative trend with falling arrow. A flat style graph depicting a downward trend with declining bars and arrow. Strong use of contrasting colors.
Free with trial Minimalist style gradient blue diagram showing downward trend line graph on black background representing economic decline or loss. Analysis decrease vectors Downward trend line graph on black background for infographic. Minimalist style gradient blue diagram showing downward trend line graph on black background representing economic decline or loss.
Free with trial Neon Bull and Bear Stock Market Trading. Analysis decrease illustrations Bull Versus Bear Neon Neon Glowing Figures Facing Off, Stock Market Trend Concept. Neon Bull and Bear Stock Market Trading
Free with trial Downward trend, symbolic chart for falling prices. Decreasing red line of a diagram falls with fluctuations into the bottomless, indicating sudden heavy losses, bursting bubbles and downward movement. Analysis decrease vectors Downward trend, symbolic chart for falling prices
Free with trial Stock market correction concept. Bankrupt financial information. Descending trading graph. Analysis decrease vectors Stock market correction concept. Bankrupt financial information. Descending trading graph
Free with trial A simple line style icon of a falling chart displayed on a computer monitor, symbolizing financial loss or decline. Analysis decrease vectors Line Style Simple Falling Chart on Monitor Display Icon Symbol. A simple line style icon of a falling chart displayed on a computer monitor, symbolizing financial loss or decline.
Free with trial Business performance, emotional reactions, statistics, analytics decline, financial troubles, problem-solving. Bar graph with downward trend and neutral face. Business challenges and emotional. Analysis decrease illustrations Declining Bar Graph with Neutral Face Emotional Impact and Business Challenges. Business performance, emotional reactions, statistics, analytics decline, financial troubles, problem-solving. Bar graph with downward trend and neutral face. Business challenges and emotional
Free with trial A simple flat style bar graph shows a negative trend, with a downward arrow on a black background. Analysis decrease vectors Decreasing bar graph with downward arrow over black background. A simple flat style bar graph shows a negative trend, with a downward arrow on a black background.