Free with trial A hand draws a downward trending graph on a whiteboard, illustrating a market decline. This image, generated by AI, is perfect for illustrating concepts like economic downturn, market analysis, or financial forecasting. The simple yet effective visual communicates the message instantly. Analysis decrease illustrations AI-Generated Market Trend. A hand draws a downward trending graph on a whiteboard, illustrating a market decline. This image, generated by AI, is perfect for illustrating concepts like economic downturn, market analysis, or financial forecasting. The simple yet effective visual communicates the message instantly.
Free with trial A 3D illustration featuring a bar chart with four ascending blue bars of varying heights, representing data growth. To the right of the chart are two white arrows, one pointing upwards and the other downwards, symbolizing increase and decrease respectively. The entire graphic is presented on a clean white background. Analysis decrease illustrations 3D Bar Chart with Up and Down Arrows on White Background graph statistics. A 3D illustration featuring a bar chart with four ascending blue bars of varying heights, representing data growth. To the right of the chart are two white arrows, one pointing upwards and the other downwards, symbolizing increase and decrease respectively. The entire graphic is presented on a clean white background
Free with trial A three-dimensional line graph depicts a significant decrease in market value over a period of four months, indicated by a sharp downward trend. Analysis decrease illustrations Sharp market value decline over time illustrated by a downward trend graph. A three-dimensional line graph depicts a significant decrease in market value over a period of four months, indicated by a sharp downward trend
Free with trial Abstract digital illustration depicting two contrasting glowing line graphs. A vibrant blue/cyan line trends steeply upwards with an arrow, while a bright red line trends downwards with its arrow, crossing over the blue line mid-way. Subtle dotted lines and sparkling light effects add detail against the dark, moody background. This dynamic image conveys energy and volatility, suitable for representing concepts like market fluctuations, contrasting financial trends (growth vs. decline), stock market analysis, competition, data comparison, economic divergence, risk assessment, and critical crossover points. Ideal for financial reports, articles on market volatility, illustrating competitive analysis, or business strategy presentations. Analysis decrease illustrations Contrasting red downward and blue upward glowing graph arrows crossing. Abstract digital illustration depicting two contrasting glowing line graphs. A vibrant blue/cyan line trends steeply upwards with an arrow, while a bright red line trends downwards with its arrow, crossing over the blue line mid-way. Subtle dotted lines and sparkling light effects add detail against the dark, moody background. This dynamic image conveys energy and volatility, suitable for representing concepts like market fluctuations, contrasting financial trends (growth vs. decline), stock market analysis, competition, data comparison, economic divergence, risk assessment, and critical crossover points. Ideal for financial reports, articles on market volatility, illustrating competitive analysis, or business strategy presentations.
Free with trial A 3D rendered icon depicting a downward trend, symbolizing financial decrease and economic challenges. Analysis decrease illustrations Financial decline icon representing economic downturn and losses. A 3D rendered icon depicting a downward trend, symbolizing financial decrease and economic challenges
Free with trial Downward line graph with data points, sad orange face symbolizing negativity, and a robot suggesting AI involvement or automation. Ideal for business, AI, automation, data analysis, technology. Analysis decrease vectors Declining Chart with Robot and Sad Face Indicating Negative Trends and AI Interaction. Downward line graph with data points, sad orange face symbolizing negativity, and a robot suggesting AI involvement or automation. Ideal for business, AI, automation, data analysis, technology
Free with trial Declining bar chart with bold red fake label above a minimal cloud. Ideal for misinformation, fraud, analysis, skepticism, distrust, validation, critical thinking. Simple flat metaphor. Analysis decrease vectors Data Misrepresentation Concept with Declining Graph and Fake Label in Simple Style. Declining bar chart with bold red fake label above a minimal cloud. Ideal for misinformation, fraud, analysis, skepticism, distrust, validation, critical thinking. Simple flat metaphor
Free with trial This image features a vibrant 3D representation of a bar chart, composed of translucent, glowing blocks in shades of pink, yellow, and cyan. The bars are arranged in varying heights, suggesting growth or data representation. The background is a dark green digital grid with subtle light effects and floating particles, creating a futuristic and technological atmosphere. This visual is ideal for concepts related to finance, data analysis, technology, growth, and digital trends. Analysis decrease illustrations Abstract 3D Bar Chart with Neon Glow on Green Digital Background. This image features a vibrant 3D representation of a bar chart, composed of translucent, glowing blocks in shades of pink, yellow, and cyan. The bars are arranged in varying heights, suggesting growth or data representation. The background is a dark green digital grid with subtle light effects and floating particles, creating a futuristic and technological atmosphere. This visual is ideal for concepts related to finance, data analysis, technology, growth, and digital trends.
Free with trial Hourglass with sand flowing, a lightning bolt, and bar chart aligned as decreasing bars. Ideal for time management, efficiency, productivity, energy flow, deadlines, data analysis simple flat. Analysis decrease vectors Hourglass with Lightning Bolt and Graph Bars Representing Time, Energy, and Productivity. Hourglass with sand flowing, a lightning bolt, and bar chart aligned as decreasing bars. Ideal for time management, efficiency, productivity, energy flow, deadlines, data analysis simple flat
Free with trial Large pie chart alongside heart and drooping plant with dashed line. Ideal for data analysis, loss, emotional impact, decline, sustainability, environmental issues, simple flat metaphor. Analysis decrease vectors Pie Chart with Heart Symbol and Wilting Plant Representing Decline and Emotional Impact. Large pie chart alongside heart and drooping plant with dashed line. Ideal for data analysis, loss, emotional impact, decline, sustainability, environmental issues, simple flat metaphor
Free with trial This image features a striking red neon-style line graph on a black background, symbolizing decline, decrease, or downward trend in data visualization. Ideal for business, finance, and analytics concepts, it visually represents performance drops or negative growth in a modern, eye-catching manner. Analysis decrease illustrations Red Neon Declining Graph Line Icon for Business Data Visualization. This image features a striking red neon-style line graph on a black background, symbolizing decline, decrease, or downward trend in data visualization. Ideal for business, finance, and analytics concepts, it visually represents performance drops or negative growth in a modern, eye-catching manner.
Free with trial A hand holding a pen traces a red downward trending stock market chart, symbolizing a bear market or financial downturn. The background shows stock data. Analysis decrease illustrations Bear Market Analysis: Hand with Pen Tracing a Declining Stock Chart. A hand holding a pen traces a red downward trending stock market chart, symbolizing a bear market or financial downturn. The background shows stock data
Free with trial A set of six black outline icons depicting magnifying glasses, graphs, a computer monitor displaying a waveform, and network connections. Analysis decrease vectors Magnifying glass and data analysis icons with graphs and monitor search. A set of six black outline icons depicting magnifying glasses, graphs, a computer monitor displaying a waveform, and network connections
Free with trial A chrome metallic arrow points diagonally downward, indicating direction. The glossy arrow with a polished reflection represents a symbol for a decline on reports, charts, business or investment losses. The arrow sign is isolated on transparent background and shows a sign of navigation, targeting and analysis. Analysis decrease vectors Metallic Downward Arrow Sign on transparent background AI Generated. A chrome metallic arrow points diagonally downward, indicating direction. The glossy arrow with a polished reflection represents a symbol for a decline on reports, charts, business or investment losses. The arrow sign is isolated on transparent background and shows a sign of navigation, targeting and analysis.
Free with trial Bar chart with upward trend, sad face, and analytics dashboard highlights challenges in progress or data performance. Ideal for financial difficulty, business risk, loss assessment, data analysis. Analysis decrease vectors Rising Bar Graph with Sad Face Symbolizing Negative Growth or Challenges in Analytics. Bar chart with upward trend, sad face, and analytics dashboard highlights challenges in progress or data performance. Ideal for financial difficulty, business risk, loss assessment, data analysis
Free with trial A minimalist graphic depicting a bar chart with falling bars and a downward-pointing arrow, symbolizing a negative trend, economic downturn, or performance decline. Clean and clear representation of loss. Analysis decrease illustrations Simple downward trend bar chart icon indicating decline or decrease. A minimalist graphic depicting a bar chart with falling bars and a downward-pointing arrow, symbolizing a negative trend, economic downturn, or performance decline. Clean and clear representation of loss
Free with trial Three-dimensional pie charts and cylinder graphs in orange and blue, perfect for business presentations illustrating data analysis and market trends. Analysis decrease illustrations 3D Colorful Pie Charts and Cylinder Graphs for Business Presentation. Three-dimensional pie charts and cylinder graphs in orange and blue, perfect for business presentations illustrating data analysis and market trends.
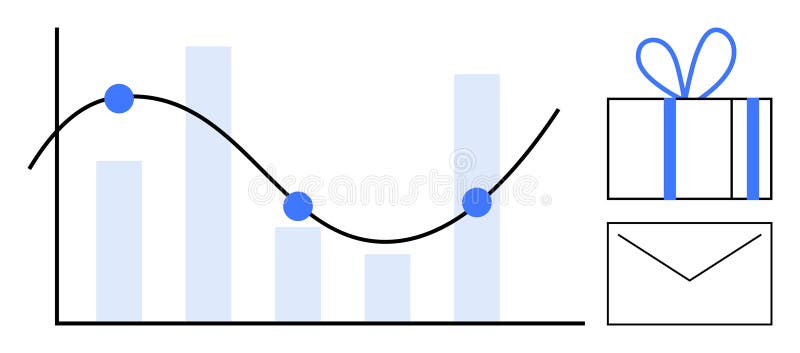
Free with trial Graph with decreasing bar chart and line graph noting key points beside a gift box and envelope. Ideal for business analysis, performance tracking, rewards programs, marketing, sales targets, client. Analysis decrease vectors Bar Graph with Line Chart, Gift Box, and Envelope Representing Business Metrics and Rewards. Graph with decreasing bar chart and line graph noting key points beside a gift box and envelope. Ideal for business analysis, performance tracking, rewards programs, marketing, sales targets, client
Free with trial Two distinct lines illustrate a decrease and an increase, creating a dynamic contrast in shades of orange that captures attention and represents change. Analysis decrease illustrations Visual Representation of Contrasting Trends With Realistic Orange Hues. Two distinct lines illustrate a decrease and an increase, creating a dynamic contrast in shades of orange that captures attention and represents change
Free with trial A crisp vector illustration of an orange downward trending line graph, signifying a fall, loss, or negative economic movement. This versatile icon is perfect for financial dashboards, business analysis, or reporting on declining statistics. Its clear visual representation quickly conveys a reduction in values, making it highly effective, vector design Generative AI. Analysis decrease vectors Orange Downward Trending Financial Graph, vector design Generative AI. A crisp vector illustration of an orange downward trending line graph, signifying a fall, loss, or negative economic movement. This versatile icon is perfect for financial dashboards, business analysis, or reporting on declining statistics. Its clear visual representation quickly conveys a reduction in values, making it highly effective, vector design Generative AI
Free with trial Falling down charts against downtown silhouette background image, Economy decrease 3d illustration wallpaper picture backdrop. Depression concept for business presentation corporate. Analysis decrease illustrations Falling down charts against downtown silhouette background image, ai generated. Falling down charts against downtown silhouette background image, Economy decrease 3d illustration wallpaper picture backdrop. Depression concept for business presentation corporate
Free with trial A chart showing a decrease with an arrow pointing down, isolated on a white background, representing a decline in data or performance. Analysis decrease illustrations Decreasing chart with arrow isolated on white background. A chart showing a decrease with an arrow pointing down, isolated on a white background, representing a decline in data or performance
Free with trial A digital illustration showing a blue, dotted Earth globe overlaid with red and blue stock market trend lines, representing global market fluctuations and financial data analysis. Analysis decrease illustrations Global Market Fluctuations: Red and Blue Stock Trends Over Earth Globe. A digital illustration showing a blue, dotted Earth globe overlaid with red and blue stock market trend lines, representing global market fluctuations and financial data analysis
Free with trial A close-up shot of a finger interacting with a colorful digital stock market graph. This image depicts modern finance technology and data analysis, capturing market trends. Analysis decrease illustrations Finger Touching Digital Stock Market Graph with Colorful Data Display. A close-up shot of a finger interacting with a colorful digital stock market graph. This image depicts modern finance technology and data analysis, capturing market trends
Free with trial This image showcases a futuristic holographic display, generated by AI, depicting a declining graph. The sleek, modern design highlights technological advancements in data presentation and analysis. The displayed data is likely financial or scientific, emphasizing the potential of AI in various fi. Analysis decrease illustrations AI-Generated Data Visualization. This image showcases a futuristic holographic display, generated by AI, depicting a declining graph. The sleek, modern design highlights technological advancements in data presentation and analysis. The displayed data is likely financial or scientific, emphasizing the potential of AI in various fi
Free with trial A computer screen displays a red data visualization, generated by AI, resembling a declining graph. The image is set against a minimalist, clean background, suggesting a modern office or workspace. The overall aesthetic conveys a sense of technological advancement and data analysis. Analysis decrease illustrations AI-Generated Data Visualization. A computer screen displays a red data visualization, generated by AI, resembling a declining graph. The image is set against a minimalist, clean background, suggesting a modern office or workspace. The overall aesthetic conveys a sense of technological advancement and data analysis.
Free with trial A financial market graph on a blue background illustrating investment trends, this is a visual representation of market fluctuations and volume, reflecting economic movements, investment strategies and business performance analysis. Generative AI. Analysis decrease illustrations Financial markets graph on a blue background showing investment trends. A financial market graph on a blue background illustrating investment trends, this is a visual representation of market fluctuations and volume, reflecting economic movements, investment strategies and business performance analysis. Generative AI
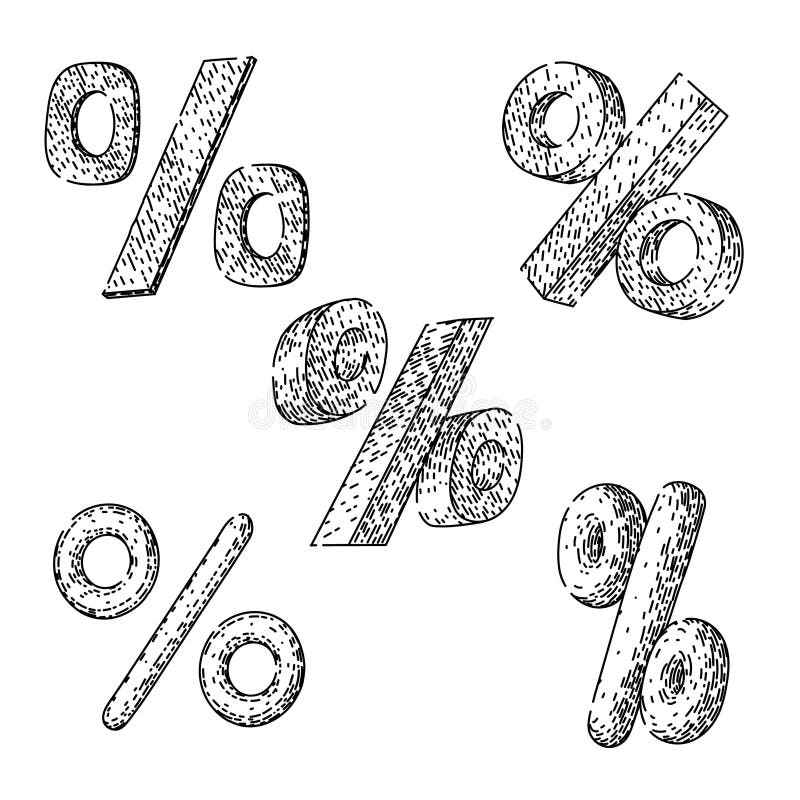
Free with trial Percentage sign set hand drawn. math calculation, finance statistics, increase decrease percentage sign vector sketch. isolated black illustration. Analysis decrease illustrations Percentage sign set sketch hand drawn vector. percentage sign set hand drawn. math calculation, finance statistics, increase decrease percentage sign vector sketch. isolated black illustration
Free with trial Illustrating market decline and data analysis with modern visual elements. Analysis decrease vectors Red arrow downtrend graph and bar chart in digital and tech theme. Illustrating market decline and data analysis with modern visual elements.
Free with trial Illustrating market decline and data analysis with modern visual elements. Analysis decrease vectors Red arrow downtrend graph and bar chart in digital and tech theme. Illustrating market decline and data analysis with modern visual elements.
Free with trial Dollar coin next to declining bar graph and directional arrow illustrating financial downturn. Ideal for finance, economics, investment, stock market, loss, budget analysis, simple flat metaphor. Analysis decrease illustrations Dollar Sign Coin and Declining Bar Chart with Arrow Indicating Financial Downward Trend. Dollar coin next to declining bar graph and directional arrow illustrating financial downturn. Ideal for finance, economics, investment, stock market, loss, budget analysis, simple flat metaphor
Free with trial Detailed 3D rendering of colorful bar charts, pie charts, line graphs, and calculator showcasing financial data analysis and business growth. Analysis decrease illustrations Colorful 3D Business Charts, Graphs, and Calculator for Financial Success. Detailed 3D rendering of colorful bar charts, pie charts, line graphs, and calculator showcasing financial data analysis and business growth.
Free with trial Math percentage sign hand drawn. calculation finance, statistics increase, decrease ratio math percentage sign vector sketch. isolated black illustration. Analysis decrease vectors Math percentage sign sketch hand drawn vector. math percentage sign hand drawn. calculation finance, statistics increase, decrease ratio math percentage sign vector sketch. isolated black illustration
Free with trial Math percentage sign hand drawn. calculation finance, statistics increase, decrease ratio math percentage sign vector sketch. isolated black illustration. Analysis decrease illustrations Math percentage sign sketch hand drawn vector. math percentage sign hand drawn. calculation finance, statistics increase, decrease ratio math percentage sign vector sketch. isolated black illustration
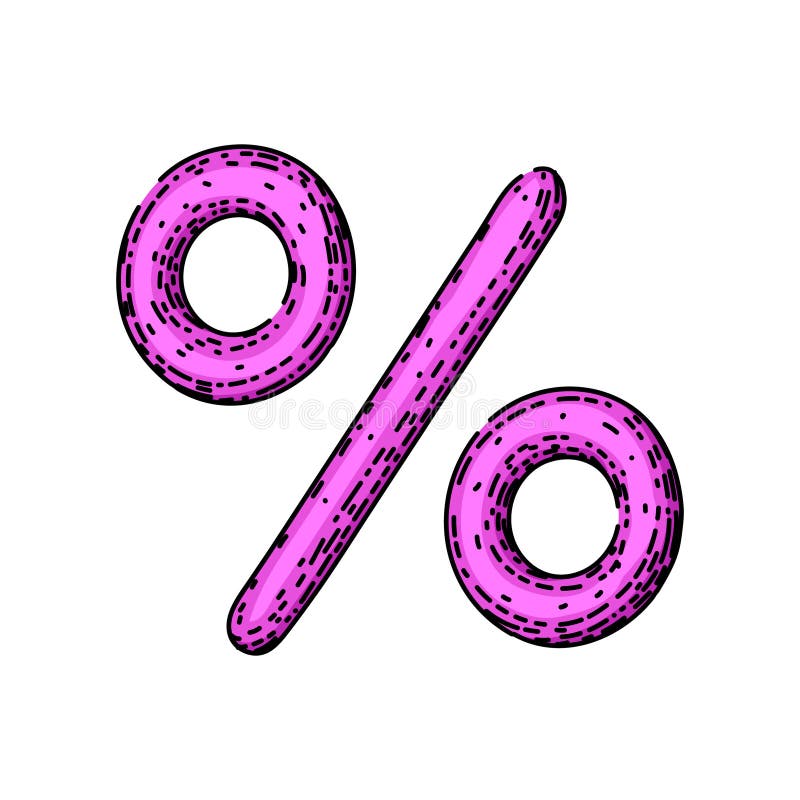
Free with trial Math percentage sign hand drawn. calculation finance, statistics increase, decrease ratio math percentage sign vector sketch. isolated color illustration. Analysis decrease illustrations Math percentage sign sketch hand drawn vector. math percentage sign hand drawn. calculation finance, statistics increase, decrease ratio math percentage sign vector sketch. isolated color illustration
Free with trial A visual representation of data showing a decline over a period. The blue bars are arranged in descending order of height, each marked with numerical indicators, suggesting a decrease in value or quantity. Analysis decrease illustrations Blue bar chart showing decreasing trend over time with numerical labels. A visual representation of data showing a decline over a period. The blue bars are arranged in descending order of height, each marked with numerical indicators, suggesting a decrease in value or quantity
Free with trial A collection of modern, minimalist icons related to business, finance, and data analysis. The icons feature upward and downward trends, graphs, arrows, checkmarks, targets, and warning signs. The color scheme is primarily black and green, creating a clean and professional look. Ideal for presentations, websites, infographics, and marketing materials. Analysis decrease vectors Set of Business and Finance Icons. A collection of modern, minimalist icons related to business, finance, and data analysis. The icons feature upward and downward trends, graphs, arrows, checkmarks, targets, and warning signs. The color scheme is primarily black and green, creating a clean and professional look. Ideal for presentations, websites, infographics, and marketing materials.
Free with trial A close-up view of a financial bar and line graph with a pen resting on it, indicating analysis and financial data. Analysis decrease illustrations Close-up of a financial graph with bars and line chart and a pen business data. A close-up view of a financial bar and line graph with a pen resting on it, indicating analysis and financial data
Free with trial The image depicts an abstract and colorful representation of financial data and market trends. It uses vivid colors and shapes. Analysis decrease illustrations An abstract visual representation of fluctuating financial data analysis. The image depicts an abstract and colorful representation of financial data and market trends. It uses vivid colors and shapes
Free with trial This image shows a stock market graph with a downward trend, generated by AI. The red line vividly depicts a significant market decline, potentially indicating economic instability or investor uncertainty. Analyzing this data requires further context and analysis. Analysis decrease illustrations AI-Generated Stock Market Decline. This image shows a stock market graph with a downward trend, generated by AI. The red line vividly depicts a significant market decline, potentially indicating economic instability or investor uncertainty. Analyzing this data requires further context and analysis.
Free with trial Downward arrow with SALE, bar chart displaying data trends, and dynamic stick figure. Ideal for business, marketing, analysis, economics, sales, growth statistics simple flat metaphor. Analysis decrease illustrations Arrow pointing downward labeled SALE with bar chart and dynamic figure symbolizing action. Downward arrow with SALE, bar chart displaying data trends, and dynamic stick figure. Ideal for business, marketing, analysis, economics, sales, growth statistics simple flat metaphor
Free with trial Abstract vector illustration of colorful bar graphs for business analysis and trends. Analysis decrease vectors Multiple colorful bar charts abstractly representing data and statistics. Abstract vector illustration of colorful bar graphs for business analysis and trends.
Free with trial Woman dressed in gray and red points at a downward red line graph symbolizing loss or decline, conveying concern and analysis mood. Generative AI. Analysis decrease vectors Woman pointing at declining red line graph showing financial loss vector illustration. Woman dressed in gray and red points at a downward red line graph symbolizing loss or decline, conveying concern and analysis mood. Generative AI
Free with trial Open book beside sad face, declining graph, and padlock icon with passwords. Ideal for data security, education, technology risks, privacy, business analysis learning concern metaphor. Simple flat. Analysis decrease vectors Open Book, Declining Graph, Sad Face, and Cybersecurity Elements Highlight Data Privacy Issues. Open book beside sad face, declining graph, and padlock icon with passwords. Ideal for data security, education, technology risks, privacy, business analysis learning concern metaphor. Simple flat
Free with trial This image showcases colorful 3D rendered charts and graphs displayed on a digital tablet, perfect for business presentations or reports illustrating growth and data analysis. The vibrant colors and clean design make it visually appealing and easy to understand. Analysis decrease illustrations Colorful 3D Charts and Graphs on Digital Tablet for Business Presentation. This image showcases colorful 3D rendered charts and graphs displayed on a digital tablet, perfect for business presentations or reports illustrating growth and data analysis. The vibrant colors and clean design make it visually appealing and easy to understand.
Free with trial A human hand is shown presenting a vivid, glowing yellow percentage symbol, radiating light and prominence. In the background, a digital bar chart visually represents growth and data analysis, set against a dark, abstract backdrop with subtle bokeh lights. This image powerfully conveys concepts related to finance, interest rates, discounts, business growth, profit, and investment. It's perfect for illustrating financial reports, economic articles, banking promotions, or investment strategy presentations. Analysis decrease illustrations Financial Growth and Interest Rates Concept with Glowing Percentage Symbol. A human hand is shown presenting a vivid, glowing yellow percentage symbol, radiating light and prominence. In the background, a digital bar chart visually represents growth and data analysis, set against a dark, abstract backdrop with subtle bokeh lights. This image powerfully conveys concepts related to finance, interest rates, discounts, business growth, profit, and investment. It's perfect for illustrating financial reports, economic articles, banking promotions, or investment strategy presentations.
Free with trial This image captures a conceptual business planning session, suggesting a focus on market trend analysis, charting of progress and addressing potential declines. Analysis decrease illustrations Conceptual business strategy session with downward trend and coffee break. This image captures a conceptual business planning session, suggesting a focus on market trend analysis, charting of progress and addressing potential declines
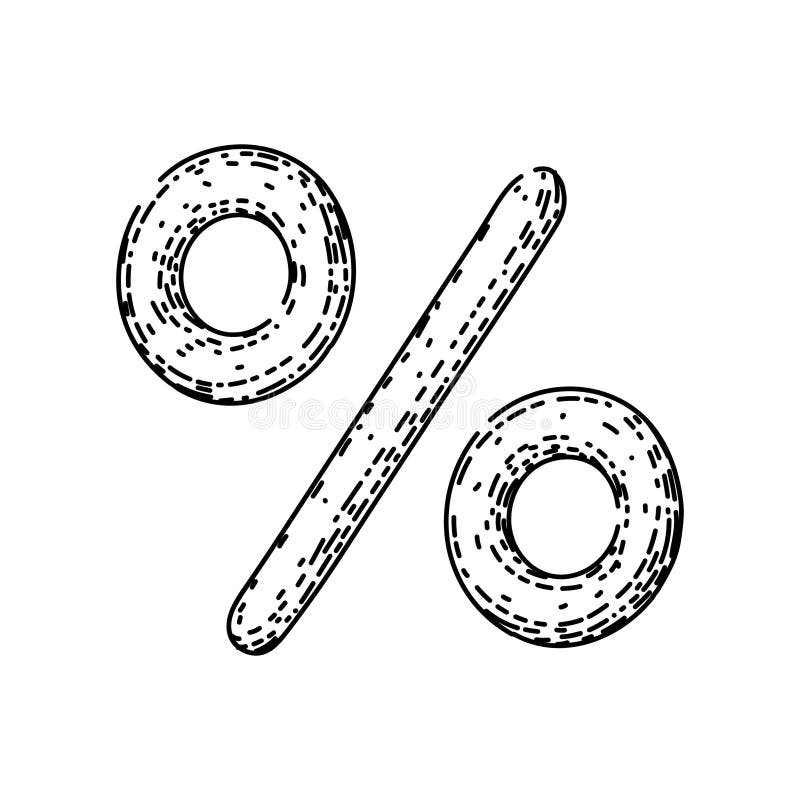
Free with trial Symbol percentage sign hand drawn. math calculation, finance statistics, increase decrease symbol percentage sign vector sketch. isolated black illustration. Analysis decrease illustrations Symbol percentage sign sketch hand drawn vector. symbol percentage sign hand drawn. math calculation, finance statistics, increase decrease symbol percentage sign vector sketch. isolated black illustration
Free with trial Symbol percentage sign hand drawn. math calculation, finance statistics, increase decrease symbol percentage sign vector sketch. isolated color illustration. Analysis decrease illustrations Symbol percentage sign sketch hand drawn vector. symbol percentage sign hand drawn. math calculation, finance statistics, increase decrease symbol percentage sign vector sketch. isolated color illustration
Free with trial Symbol percentage sign hand drawn. math calculation, finance statistics, increase decrease symbol percentage sign vector sketch. isolated color illustration. Analysis decrease vectors Symbol percentage sign sketch hand drawn vector. symbol percentage sign hand drawn. math calculation, finance statistics, increase decrease symbol percentage sign vector sketch. isolated color illustration
Free with trial Symbol percentage sign hand drawn. math calculation, finance statistics, increase decrease symbol percentage sign vector sketch. isolated black illustration. Analysis decrease illustrations Symbol percentage sign sketch hand drawn vector. symbol percentage sign hand drawn. math calculation, finance statistics, increase decrease symbol percentage sign vector sketch. isolated black illustration
Free with trial Woman holding glasses and a tablet while examining large upward and downward arrows. Ideal for business analysis, decision-making, growth, statistics, market trends, planning, and presentations in. Analysis decrease illustrations Professional woman analyzing upward and downward trends alongside graphical arrows and metrics. Woman holding glasses and a tablet while examining large upward and downward arrows. Ideal for business analysis, decision-making, growth, statistics, market trends, planning, and presentations in
Free with trial A bright red arrow points upwards symbolizing growth and profit, while a vibrant green arrow points downwards signifying a decrease or loss. Ideal for finance and business concepts. Analysis decrease vectors Red up arrow and green down arrow symbols representing financial growth and decline. A bright red arrow points upwards symbolizing growth and profit, while a vibrant green arrow points downwards signifying a decrease or loss. Ideal for finance and business concepts
Free with trial A hand uses a stylus to draw a glowing bar graph. The graph illustrates increasing income and decreasing expenses, symbolizing financial management and growth. Analysis decrease illustrations Hand drawing a financial graph showing income growth and expense decrease. A hand uses a stylus to draw a glowing bar graph. The graph illustrates increasing income and decreasing expenses, symbolizing financial management and growth
Free with trial Finance percentage sign hand drawn. statistics increase, decrease ratio, proportion interest finance percentage sign vector sketch. isolated color illustration. Analysis decrease vectors Finance percentage sign sketch hand drawn vector. finance percentage sign hand drawn. statistics increase, decrease ratio, proportion interest finance percentage sign vector sketch. isolated color illustration
Free with trial Finance percentage sign hand drawn. statistics increase, decrease ratio, proportion interest finance percentage sign vector sketch. isolated black illustration. Analysis decrease vectors Finance percentage sign sketch hand drawn vector. finance percentage sign hand drawn. statistics increase, decrease ratio, proportion interest finance percentage sign vector sketch. isolated black illustration
Free with trial Finance percentage sign hand drawn. statistics increase, decrease ratio, proportion interest finance percentage sign vector sketch. isolated black illustration. Analysis decrease illustrations Finance percentage sign sketch hand drawn vector. finance percentage sign hand drawn. statistics increase, decrease ratio, proportion interest finance percentage sign vector sketch. isolated black illustration
Free with trial A person's open palm supports a glowing blue graph illustrating a downward trend for cost and an upward trend for quality against a dark background. Analysis decrease illustrations Hand holding graph showing decreasing cost and increasing quality decrease. A person's open palm supports a glowing blue graph illustrating a downward trend for cost and an upward trend for quality against a dark background
Free with trial Area chart illustrating trends in Sareorplojicam and S�snpavai across years. Shows variations over time. Analysis decrease illustrations . Area chart illustrating trends in Sareorplojicam and S�snpavai across years. Shows variations over time
Free with trial A stark visual representation of a financial downturn with a bold red arrow pointing downwards. This graphic captures market decline and economic recession trends, ideal for financial analysis and reporting. Analysis decrease illustrations Financial downturn visualized red arrow chart showing decline candlestick graph indicating market drop economic recession trend. A stark visual representation of a financial downturn with a bold red arrow pointing downwards. This graphic captures market decline and economic recession trends, ideal for financial analysis and reporting
Free with trial Stock market chart displaying investment trends with red and blue candlesticks on a dark background. The chart features a timeline labeled by months at the top and numbers at the bottom, illustrating dynamic financial data. Candlesticks show market fluctuations, with red indicating a decrease and blue an increase in value. A faint blue line overlays the candles, representing the moving average. The scene is likely within a financial or trading setting, emphasizing the analysis of market activity. Analysis decrease illustrations Dynamic stock market chart with vibrant red and blue candles showing investment trends and financial data. Stock market chart displaying investment trends with red and blue candlesticks on a dark background. The chart features a timeline labeled by months at the top and numbers at the bottom, illustrating dynamic financial data. Candlesticks show market fluctuations, with red indicating a decrease and blue an increase in value. A faint blue line overlays the candles, representing the moving average. The scene is likely within a financial or trading setting, emphasizing the analysis of market activity.
Free with trial This visually striking graph displays two contrasting trends one line shows a sharp decrease while the other illustrates a significant increase in an engaging orange palette. Analysis decrease illustrations Dynamic Trends of Change Illustrated Through Contrasting Lines in Orange Hues. This visually striking graph displays two contrasting trends one line shows a sharp decrease while the other illustrates a significant increase in an engaging orange palette
Free with trial Two distinct lines illustrate contrasting trends, one rising and the other falling. The gradient colors blend harmoniously, enhancing the visual impact. Analysis decrease illustrations Analysis of Fluctuating Trends in a Colorful Gradient Landscape Representation. Two distinct lines illustrate contrasting trends, one rising and the other falling. The gradient colors blend harmoniously, enhancing the visual impact
Free with trial An abstract digital rendering of a financial market chart with a prominent red line indicating fluctuations in a stock market or trading scenario, set against a background of data streams and numerical information. It can be used for visualizing economic trends or for representing financial analytics. Analysis decrease illustrations Abstract financial chart depicting market trends and data analysis interface. An abstract digital rendering of a financial market chart with a prominent red line indicating fluctuations in a stock market or trading scenario, set against a background of data streams and numerical information. It can be used for visualizing economic trends or for representing financial analytics
Free with trial CO2 inside cloud shape with blue downward arrows indicating reduction, next to bar chart and small cloud. Ideal for sustainability, environment, data, carbon reduction, climate change, eco-friendly. Analysis decrease vectors Reducing Carbon Emissions with Data Analysis Highlighted by Cloud Imagery and Downward Arrows. CO2 inside cloud shape with blue downward arrows indicating. CO2 inside cloud shape with blue downward arrows indicating reduction, next to bar chart and small cloud. Ideal for sustainability, environment, data, carbon reduction, climate change, eco-friendly
Free with trial A whiteboard easel displays a bar graph with a downward trend and a red arrow indicating a decrease, isolated on a white background. Analysis decrease illustrations Business bar chart showing decline isolated on white background. A whiteboard easel displays a bar graph with a downward trend and a red arrow indicating a decrease, isolated on a white background
Free with trial Elevate your everyday style with Abu Taher's collection of Typography T-Shirt Designs, where words meet artistry. Analysis decrease vectors Collection of 32 icons representing increase and decrease in business and finance. Elevate your everyday style with Abu Taher's collection of Typography T-Shirt Designs, where words meet artistry
Free with trial Statistics percentage sign hand drawn. increase decrease, ratio proportion, interest profit statistics percentage sign vector sketch. isolated color illustration. Analysis decrease illustrations Statistics percentage sign sketch hand drawn vector. statistics percentage sign hand drawn. increase decrease, ratio proportion, interest profit statistics percentage sign vector sketch. isolated color illustration
Free with trial Statistics percentage sign hand drawn. increase decrease, ratio proportion, interest profit statistics percentage sign vector sketch. isolated color illustration. Analysis decrease illustrations Statistics percentage sign sketch hand drawn vector. statistics percentage sign hand drawn. increase decrease, ratio proportion, interest profit statistics percentage sign vector sketch. isolated color illustration
Free with trial Globe outline with five stars arranged in an arc and a black downward arrow with a cloud above. Ideal for global ranking, review system, feedback, decision-making, quality metrics, trend analysis. Analysis decrease vectors Global rating concept with stars, globe, and downward arrow indicating feedback or ranking shift. Globe outline with five stars arranged in an arc and a black downward arrow with a cloud above. Ideal for global ranking, review system, feedback, decision-making, quality metrics, trend analysis
Free with trial Modern abstract blue bars illustrating business statistics, trends, and analytics. Analysis decrease vectors Digital data analysis bars in blue hues, conceptualizing statistics and trends. Modern abstract blue bars illustrating business statistics, trends, and analytics.
Free with trial Signed document with a frown face and declining bar chart symbolizing failure, loss, rejection, or performance drop. Ideal for business, finance, loss, analysis, feedback strategy simple landing. Analysis decrease vectors Document with Signature, Sad Face, and Bar Graph Highlighting Decline in Performance or Approval. Signed document with a frown face and declining bar chart symbolizing failure, loss, rejection, or performance drop. Ideal for business, finance, loss, analysis, feedback strategy simple landing
Free with trial A striking red arrow plunges downwards, symbolizing a significant drop in data trends. This representation highlights a negative change in performance or market activity. Analysis decrease illustrations A red downward arrow indicating a sharp decline in numbers during market analysis. A striking red arrow plunges downwards, symbolizing a significant drop in data trends. This representation highlights a negative change in performance or market activity.
Free with trial Calculation percentage sign hand drawn. finance statistics, increase decrease, ratio proportion calculation percentage sign vector sketch. isolated black illustration. Analysis decrease vectors Calculation percentage sign sketch hand drawn vector. calculation percentage sign hand drawn. finance statistics, increase decrease, ratio proportion calculation percentage sign vector sketch. isolated black illustration
Free with trial Calculation percentage sign hand drawn. finance statistics, increase decrease, ratio proportion calculation percentage sign vector sketch. isolated black illustration. Analysis decrease illustrations Calculation percentage sign sketch hand drawn vector. calculation percentage sign hand drawn. finance statistics, increase decrease, ratio proportion calculation percentage sign vector sketch. isolated black illustration
Free with trial A character stands alone holding a big red arrow pointing downwards, symbolizing a decrease or decline, against a plain white backdrop. Analysis decrease illustrations Character Holds Large Red Downward Arrow Representing Decline on White Background. A character stands alone holding a big red arrow pointing downwards, symbolizing a decrease or decline, against a plain white backdrop
Free with trial Visualize financial decline with this striking depiction of a report showing falling tax revenue and a clear downward trend, perfect for economic analysis and business strategy content. Analysis decrease vectors Business financial report shows declining tax revenue with downward trend arrow. Visualize financial decline with this striking depiction of a report showing falling tax revenue and a clear downward trend, perfect for economic analysis and business strategy content
Free with trial This 3D rendering showcases colorful bar graphs, pie charts, and a calculator, vividly illustrating concepts of business growth, financial success, and data analysis. The upward-trending arrow emphasizes positive progress. Analysis decrease illustrations Colorful 3D Charts and Calculator Illustrating Business Growth and Financial Success. This 3D rendering showcases colorful bar graphs, pie charts, and a calculator, vividly illustrating concepts of business growth, financial success, and data analysis. The upward-trending arrow emphasizes positive progress.
Free with trial 3D red zigzag arrow trending downward across white studio backdrop, casting subtle shadow. Graph, finance, analysis, growth, decline, investment, strategy. Analysis decrease illustrations 3D red zigzag arrow trending downward across white studio backdrop, casting subtle shadow