Free with trial Golden bar chart with downward arrow and dollar coin. Symbolizes economic decline, financial loss, market crash, recession, currency depreciation, business challenges. Analysis decrease illustrations Economic downturn represented by golden bar chart and dollar. Golden bar chart with downward arrow and dollar coin. Symbolizes economic decline, financial loss, market crash, recession, currency depreciation, business challenges
Free with trial Red and green candlestick chart shows a descending pattern against a black background, creating a dramatic financial illustration for use in economic or investment themed visuals. Analysis decrease illustrations Descending Chart Pattern with Red and Green Candlesticks on Black. Red and green candlestick chart shows a descending pattern against a black background, creating a dramatic financial illustration for use in economic or investment themed visuals
Free with trial Black and white icon of a bar graph with a diagonal arrow indicating a sharp decline. Analysis decrease illustrations Falling bar graph with diagonal arrow showing sharp decline bar chart. Black and white icon of a bar graph with a diagonal arrow indicating a sharp decline
Free with trial Currency Exchange Rate and Financial Market Concept. Magnifying glass with a percentage symbol in focus, up green arrow and a down red arrow, currency exchange rate fluctuations, and market dynamics. Analysis decrease illustrations Magnifying glass with percent, up and down arrows. Currency Exchange Rate and Financial Market Concept. Magnifying glass with a percentage symbol in focus, up green arrow and a down red arrow, currency exchange rate fluctuations, and market dynamics
Free with trial The chart shows falling oil prices with an oil rig visible in the background. Data highlights market changes. Analysis decrease illustrations Oil price trends show decline near oil extraction site in industry setting Generative AI. The chart shows falling oil prices with an oil rig visible in the background. Data highlights market changes
Free with trial A simple black and red bar chart displays data with varying heights on a white background. Analysis decrease illustrations Simple Bar Chart with One Red Bar on White Background graph data. A simple black and red bar chart displays data with varying heights on a white background
Free with trial A 3D golden bar chart is arranged in a descending sequence, illustrating a downward trend. The bars are polished and reflective, casting subtle shadows on the pure white background. This visual represents a decline in data or financial performance. Analysis decrease illustrations Golden Bar Chart Showing Downward Trend on White Background graph metallic. A 3D golden bar chart is arranged in a descending sequence, illustrating a downward trend. The bars are polished and reflective, casting subtle shadows on the pure white background. This visual represents a decline in data or financial performance
Free with trial This illustration depicts a financial concept with a bar graph showing a downward trend, alternating between green (profit) and red (loss) bars. A red line graph with an arrow indicates a significant decline. To the right, a stack of documents represents a profit and loss statement, with 'Profit' and 'Loss' clearly labeled. This visual is ideal for representing financial performance, business challenges, economic downturns, or the need for strategic adjustments. Analysis decrease vectors Declining Profit and Loss Statement with Downward Trend Graph. This illustration depicts a financial concept with a bar graph showing a downward trend, alternating between green (profit) and red (loss) bars. A red line graph with an arrow indicates a significant decline. To the right, a stack of documents represents a profit and loss statement, with 'Profit' and 'Loss' clearly labeled. This visual is ideal for representing financial performance, business challenges, economic downturns, or the need for strategic adjustments.
Free with trial A visual representation of a stock market candlestick chart is depicted with a downward trend. The chart features alternating red and green candlesticks, indicating price fluctuations. A subtle shadow is cast on the white background, adding depth to the financial data visualization. Analysis decrease illustrations Downward Trending Stock Market Candlestick Chart with Red and Green Bars and Shadow finance. A visual representation of a stock market candlestick chart is depicted with a downward trend. The chart features alternating red and green candlesticks, indicating price fluctuations. A subtle shadow is cast on the white background, adding depth to the financial data visualization
Free with trial The image depicts a currency exchange concept with a prominent yen symbol at the center. Surrounding the yen symbol are two arrows, one in blue and one in red. The blue arrow points downward, indicating a decrease or downward trend, while the red arrow points upward, indicating an increase or upward trend. The background is plain white, which makes the blue and red arrows stand out clearly. The. Analysis decrease vectors Currency exchange concept with yen symbol and arrows in blue and red. The image depicts a currency exchange concept with a prominent yen symbol at the center. Surrounding the yen symbol are two arrows, one in blue and one in red. The blue arrow points downward, indicating a decrease or downward trend, while the red arrow points upward, indicating an increase or upward trend. The background is plain white, which makes the blue and red arrows stand out clearly. The
Free with trial Human Hand and Robot Hand Interacting with Home Icon Representing Real Estate Market Trends and Technology Integration in Urban Environment Sigmoid. Analysis decrease illustrations A futuristic representation of interaction between a human hand and a robotic hand, focusing on real estate trends and. Human Hand and Robot Hand Interacting with Home Icon Representing Real Estate Market Trends and Technology Integration in Urban Environment Sigmoid
Free with trial This image illustrates a bar graph showing an upward trend in financial growth, accompanied by a line graph depicting market fluctuations over time. Analysis decrease illustrations Graphical representation of financial growth and fluctuation. This image illustrates a bar graph showing an upward trend in financial growth, accompanied by a line graph depicting market fluctuations over time
Free with trial A businessman wearing a suit analyzes cost reduction versus quality improvement He uses both a laptop and a tablet computer to look at the data and see how these two factors interact to produce the best result for his company and business dealings shown with a graph of numbers going up and down. Analysis decrease illustrations Cost reduction and quality improvement shown with businessman analyzing data on devices. A businessman wearing a suit analyzes cost reduction versus quality improvement He uses both a laptop and a tablet computer to look at the data and see how these two factors interact to produce the best result for his company and business dealings shown with a graph of numbers going up and down
Free with trial A symbolic representation of financial decline, this image features four stacks of gold coins, decreasing in height from left to right, symbolizing a reduction in wealth or value. A prominent red arrow, sharply descending, overlays the scene, reinforcing the concept of a market crash, economic recession, or financial loss. The clean white background and reflective surface emphasize the starkness of the downturn. Analysis decrease vectors Financial Downturn: Stacks of Gold Coins and Red Downward Arrow. A symbolic representation of financial decline, this image features four stacks of gold coins, decreasing in height from left to right, symbolizing a reduction in wealth or value. A prominent red arrow, sharply descending, overlays the scene, reinforcing the concept of a market crash, economic recession, or financial loss. The clean white background and reflective surface emphasize the starkness of the downturn.
Free with trial A dollar bill connected to a bar graph resembling a sound wave with an arrow. Clear details and vibrant colors. Analysis decrease illustrations Dollar Bill and Sound Wave Bar Graph with Arrow money finance. A dollar bill connected to a bar graph resembling a sound wave with an arrow. Clear details and vibrant colors
Free with trial Black icon with multiple curved arrows pointing downwards and converging on white. Analysis decrease illustrations Multiple curved arrows pointing down on white falling decline. Black icon with multiple curved arrows pointing downwards and converging on white
Free with trial Two blue bar graphs are depicted against a white background. The left graph bars increasing in height with an upward curving arrow, indicating growth. The right graph bars decreasing in height. Analysis decrease vectors Blue bar graphs showing upward and downward trends with arrows. Two blue bar graphs are depicted against a white background. The left graph bars increasing in height with an upward curving arrow, indicating growth. The right graph bars decreasing in height
Free with trial Frozen icicle bar chart showing a downward trend and frosty arrow. Concept of economic recession or financial crisis. Analysis decrease illustrations Frozen icicle bar chart showing a downward trend and frosty arrow
Free with trial An abstract representation of a stock market decline is illustrated through a sharply descending red line graph against a dark, grid-like background. The red hues emphasize the severity of the drop, suggesting financial loss. Numerical data points faintly accompany the visual. This image was generat. Analysis decrease illustrations Red Stock Decline. An abstract representation of a stock market decline is illustrated through a sharply descending red line graph against a dark, grid-like background. The red hues emphasize the severity of the drop, suggesting financial loss. Numerical data points faintly accompany the visual. This image was generat
Free with trial A circular icon containing a stylized representation of financial data. The icon features a series of black vertical bars of varying heights, suggesting a bar chart. Overlaid on the bars are two thin lines, one black and one grey, depicting line graphs with peaks and troughs, indicating fluctuating trends. The overall design is minimalist and symbolic, suitable for representing business analytics. Analysis decrease illustrations Circular Graph Icon with Bar and Line Charts Representing Financial Data and Trends business. A circular icon containing a stylized representation of financial data. The icon features a series of black vertical bars of varying heights, suggesting a bar chart. Overlaid on the bars are two thin lines, one black and one grey, depicting line graphs with peaks and troughs, indicating fluctuating trends. The overall design is minimalist and symbolic, suitable for representing business analytics
Free with trial Economic growth and decline. Profit and loss. Trading on stock exchanges and markets. Bring your business into profit. Analysis decrease illustrations Economic growth and decline. Profit and loss.
Free with trial A vibrant, hand-drawn doodle illustration centered around a large percentage sign. This creative sketch features various financial and business icons, including bar graphs, pie charts, stacks of coins, dollar signs, and arrows indicating growth and decline. The colorful, cartoonish style makes it perfect for illustrating concepts like interest rates, economic trends, business analytics, and financial reports. Ideal for use in presentations, infographics, websites, and educational materials, this vector art is isolated on a white background for versatile application. Analysis decrease illustrations Finance and Economy Doodle Illustration. A vibrant, hand-drawn doodle illustration centered around a large percentage sign. This creative sketch features various financial and business icons, including bar graphs, pie charts, stacks of coins, dollar signs, and arrows indicating growth and decline. The colorful, cartoonish style makes it perfect for illustrating concepts like interest rates, economic trends, business analytics, and financial reports. Ideal for use in presentations, infographics, websites, and educational materials, this vector art is isolated on a white background for versatile application.
Free with trial A simple line art icon of a decreasing bar chart with a trend arrow, representing negative growth or loss in business. Analysis decrease vectors Line Art Outline Decreasing Bar Chart Trend Arrow Business Icon. A simple line art icon of a decreasing bar chart with a trend arrow, representing negative growth or loss in business.
Free with trial A conceptual image representing a downturn in the real estate market. A hand guides a red arrow pointing downwards towards a miniature house. The word "SALE" is formed by wooden blocks on top of a contract. A set of keys lies nearby. This visual symbolizes a decline in property values and sales, potentially due to economic factors or market trends. Suitable for articles, reports, and presentations on real estate, finance, and economics. Analysis decrease illustrations Real Estate Market Downturn. A conceptual image representing a downturn in the real estate market. A hand guides a red arrow pointing downwards towards a miniature house. The word "SALE" is formed by wooden blocks on top of a contract. A set of keys lies nearby. This visual symbolizes a decline in property values and sales, potentially due to economic factors or market trends. Suitable for articles, reports, and presentations on real estate, finance, and economics.
Free with trial Purple Global economic crisis icon isolated on purple background. World finance crisis. Minimalism concept. 3D render illustration. Analysis decrease illustrations Purple Global economic crisis icon isolated on purple background. World finance crisis. Minimalism concept. 3D render
Free with trial This visually striking image depicts a futuristic financial concept. Scattered coins on a dark surface are illuminated by glowing neon percentages (1%, 10%, 20%, 30%, 50%, 100%). A subtle network of lines and lights in the background suggests a digital or abstract representation of data and growth. The composition evokes themes of investment, progress, and financial targets, suitable for business, finance, and technology-related content. Analysis decrease illustrations Digital Growth and Financial Percentages. This visually striking image depicts a futuristic financial concept. Scattered coins on a dark surface are illuminated by glowing neon percentages (1%, 10%, 20%, 30%, 50%, 100%). A subtle network of lines and lights in the background suggests a digital or abstract representation of data and growth. The composition evokes themes of investment, progress, and financial targets, suitable for business, finance, and technology-related content.
Free with trial A flat design vector illustration depicting a financial market data board or stock ticker. The black-bordered display features various stock symbols, numerical values like '$ ,80K', '$ ,22,50', and indicators of market performance. Prominently highlighted in red is the word 'LOSING', accompanied by a red downward arrow signifying a price drop, and a red downward triangle. Conversely, a green upward arrow indicates a price increase. This icon effectively visualizes concepts of financial loss, gain, market volatility, and investment trends, suitable for business, finance, and economic content. Analysis decrease illustrations Financial Market Data Board Icon with Loss and Gain Indicators. A flat design vector illustration depicting a financial market data board or stock ticker. The black-bordered display features various stock symbols, numerical values like '$ ,80K', '$ ,22,50', and indicators of market performance. Prominently highlighted in red is the word 'LOSING', accompanied by a red downward arrow signifying a price drop, and a red downward triangle. Conversely, a green upward arrow indicates a price increase. This icon effectively visualizes concepts of financial loss, gain, market volatility, and investment trends, suitable for business, finance, and economic content.
Free with trial Circular maze with a descending bar chart icon, symbolizing the challenge of navigating business data and analytics amid declines, obstacles, and the search for strategic solutions and recovery. Analysis decrease illustrations Navigating complex data decline challenges and finding solutions. Circular maze with a descending bar chart icon, symbolizing the challenge of navigating business data and analytics amid declines, obstacles, and the search for strategic solutions and recovery
Free with trial A blue holographic graph showing a downward trend with bars and a line chart is projected over a dark conference table and chairs. Analysis decrease illustrations Holographic graph displaying insurance reimbursement delays over a conference table chart. A blue holographic graph showing a downward trend with bars and a line chart is projected over a dark conference table and chairs
Free with trial Data metallic style declining sales graph illustration report forecast, revenue market, performance downturn data metallic style declining sales graph. Analysis decrease illustrations Data metallic style declining sales graph
Free with trial A red line graph showing a significant downward trend, indicating a decline or loss, set against a subtle white background with small, scattered grid points. Analysis decrease illustrations Red downward trend line on a white background with grid points. A red line graph showing a significant downward trend, indicating a decline or loss, set against a subtle white background with small, scattered grid points
Free with trial A single golden coin is presented with a magnifying glass symbol indicating a zoom-out function embossed on its surface. The coin has a ribbed edge and a polished, metallic sheen. It is set against a dark gradient background with a subtle shadow, highlighting its isolated, conceptual nature. Analysis decrease illustrations Golden Coin with Zoom Out Magnifying Glass Symbol on Dark Gradient Background image photo. A single golden coin is presented with a magnifying glass symbol indicating a zoom-out function embossed on its surface. The coin has a ribbed edge and a polished, metallic sheen. It is set against a dark gradient background with a subtle shadow, highlighting its isolated, conceptual nature
Free with trial This Financial and Economic Crisis Solid Vector Glyph Icon Set featuring Market Drop, Profit Loss, Debt Load, World Recession, and Inflation for Business and Global Economy News is a critical visual resource for the finance and news sectors. The set features essential icons for market crashes, economic decline, and financial risk, making it an ideal choice for economic reports, banking apps, and business news platforms. The bold, solid design provides a serious and professional tone, ensuring that each symbol representing inflation, bankruptcy, and recession is clearly recognizable to a global audience. Use these high-quality vectors to illustrate the complexities of the modern economic landscape, financial stability, and global trade challenges in your next professional presentation or digital project, providing a clear and impactful visual language for economic analysis. Analysis decrease vectors Financial Crisis Solid Icon Set with Market Drop, Profit Loss, Debt Load, World Recession, and Inflation. This Financial and Economic Crisis Solid Vector Glyph Icon Set featuring Market Drop, Profit Loss, Debt Load, World Recession, and Inflation for Business and Global Economy News is a critical visual resource for the finance and news sectors. The set features essential icons for market crashes, economic decline, and financial risk, making it an ideal choice for economic reports, banking apps, and business news platforms. The bold, solid design provides a serious and professional tone, ensuring that each symbol representing inflation, bankruptcy, and recession is clearly recognizable to a global audience. Use these high-quality vectors to illustrate the complexities of the modern economic landscape, financial stability, and global trade challenges in your next professional presentation or digital project, providing a clear and impactful visual language for economic analysis.
Free with trial Business partners discussing real estate investment with graphs and statistics in a modern office setting showcasing financial trends and growth potential Sigmoid. Analysis decrease illustrations Two business partners in formal attire engage in a conversation about real estate investments, with graphs and. Business partners discussing real estate investment with graphs and statistics in a modern office setting showcasing financial trends and growth potential Sigmoid
Free with trial An artistic creation that reflects beauty in simplicity. The design highlights precision, clean details, and a harmonious flow, resulting in a versatile and professional visual outcome. Analysis decrease vectors Business lion Presenting bar graph chart. An artistic creation that reflects beauty in simplicity. The design highlights precision, clean details, and a harmonious flow, resulting in a versatile and professional visual outcome
Free with trial A comprehensive vector icon collection illustrating various aspects of financial crises, market downturns, and economic challenges. This set includes symbols like bull and bear market dynamics, broken shields representing risk and vulnerability, declining bar charts, candlestick patterns, and emergency indicators. Concepts such as bankruptcy, recession, financial loss, and market volatility are visually conveyed. Ideal for financial news, economic reports, business presentations, educational materials, and articles discussing market risks or economic forecasts. Analysis decrease vectors Financial Crisis, Market Downturn, and Bankruptcy Vector Icons Set. A comprehensive vector icon collection illustrating various aspects of financial crises, market downturns, and economic challenges. This set includes symbols like bull and bear market dynamics, broken shields representing risk and vulnerability, declining bar charts, candlestick patterns, and emergency indicators. Concepts such as bankruptcy, recession, financial loss, and market volatility are visually conveyed. Ideal for financial news, economic reports, business presentations, educational materials, and articles discussing market risks or economic forecasts.
Free with trial Professional business man holding pie chart showing negative trend with loss. Economic crisis, recession, market crash, financial planning. Analysis decrease illustrations Business man holding pie chart showing negative trend with loss
Free with trial A thick, red, zigzagging line, potentially a stock chart, is superimposed over a dark background with glowing green and red data points and lines. Image. Analysis decrease illustrations Red Zigzag Line Overlaying Financial Data. A thick, red, zigzagging line, potentially a stock chart, is superimposed over a dark background with glowing green and red data points and lines. Image
Free with trial A black graph displays a downward curving line within a rectangular frame. Clear details and vibrant colors en. Analysis decrease illustrations Black graph showing a downward curve within a frame chart decline. A black graph displays a downward curving line within a rectangular frame. Clear details and vibrant colors en
Free with trial A prominent red arrow pointing downwards, symbolizing a decline or loss, set against a backdrop of a digital stock market chart with various financial figures and graphs. Analysis decrease illustrations Red Arrow Pointing Downwards on Stock Market Chart. A prominent red arrow pointing downwards, symbolizing a decline or loss, set against a backdrop of a digital stock market chart with various financial figures and graphs
Free with trial A vibrant red arrow dramatically points downwards, symbolizing a significant decline or loss, set against a blurred background of financial stock market charts and numbers, all bathed in a red hue. Analysis decrease illustrations Red Arrow Pointing Downwards with Stock Market Chart Background. A vibrant red arrow dramatically points downwards, symbolizing a significant decline or loss, set against a blurred background of financial stock market charts and numbers, all bathed in a red hue
Free with trial Magnifying glass icon with minus symbol representing zoom out, reduced scale view, and simplified search perspective. Ideal for navigation systems, mapping tools, and digital interfaces. Analysis decrease vectors Magnifying Glass With Minus Symbol Zoom Out Search Reduce View Scale Concept For Interface Navigation. Magnifying glass icon with minus symbol representing zoom out, reduced scale view, and simplified search perspective. Ideal for navigation systems, mapping tools, and digital interfaces
Free with trial A 3D rendered image of a bar chart with a downward trend, set against a bright yellow background. The chart features grey frame and orange bars, with a prominent red arrow indicating a decline. This image is suitable for illustrating concepts related to financial loss, market downturn, economic recession, or negative performance in business and investment contexts. Analysis decrease illustrations Downward Trend Chart on Yellow Background. A 3D rendered image of a bar chart with a downward trend, set against a bright yellow background. The chart features grey frame and orange bars, with a prominent red arrow indicating a decline. This image is suitable for illustrating concepts related to financial loss, market downturn, economic recession, or negative performance in business and investment contexts.
Free with trial A businessman interacts with a digital graph showcasing cost reduction through a declining trend. It symbolizes modern financial strategies and data-driven decision-making. XDMCP. Analysis decrease illustrations Businessman Presenting Digital Graph with Cost Reduction Concept, Showing Declining Trend in Expenses with Iconic. A businessman interacts with a digital graph showcasing cost reduction through a declining trend. It symbolizes modern financial strategies and data-driven decision-making. XDMCP
Free with trial Stickman presenting income growth with upward arrow and expenses decrease illustrated with chart. Perfect for financial themed presentations. Use as simple visual tool to show financial concepts on. Analysis decrease illustrations Stickman with Financial Graphic Illustration on White Background. Stickman presenting income growth with upward arrow and expenses decrease illustrated with chart. Perfect for financial themed presentations. Use as simple visual tool to show financial concepts on
Free with trial Clean magnifying glass icon featuring minus symbol representing zoom out function, search reduction, content minimization, scaling down view, and simplified data visualization. Analysis decrease vectors Magnifying Glass Icon with Minus Symbol for Zoom Out Search Reduction and Content Minimization Concept. Clean magnifying glass icon featuring minus symbol representing zoom out function, search reduction, content minimization, scaling down view, and simplified data visualization
Free with trial This image features two bar graphs isolated on a white background. The left graph, labeled 'PROFIT,' shows increasing bars indicating rising profit levels. The right graph, labeled 'LOSS,' displays decreasing bars, illustrating increasing loss levels. The image is clear, concise, and SEO-friendly, highlighting financial concepts. Analysis decrease illustrations Profit and loss graphs isolated on white background. This image features two bar graphs isolated on a white background. The left graph, labeled 'PROFIT,' shows increasing bars indicating rising profit levels. The right graph, labeled 'LOSS,' displays decreasing bars, illustrating increasing loss levels. The image is clear, concise, and SEO-friendly, highlighting financial concepts
Free with trial Stacks of coins are topped with wooden blocks displaying the numbers 2, 0, 2, and 6, arranged to represent the year 2026. The coins decrease in height from left to right. A magnifying glass with a wooden handle lies beside the stacks, suggesting examination or analysis. The background is a neutral gray, providing a clean, professional look associated with financial themes. Analysis decrease illustrations Searching for Financial Growth in 2026 - Money and Magnifying Glass. Stacks of coins are topped with wooden blocks displaying the numbers 2, 0, 2, and 6, arranged to represent the year 2026. The coins decrease in height from left to right. A magnifying glass with a wooden handle lies beside the stacks, suggesting examination or analysis. The background is a neutral gray, providing a clean, professional look associated with financial themes.
Free with trial Arrow Direction and Percentage Icons for Business Growth Concept. Analysis decrease illustrations Arrow Direction and Percentage Icons for Business Growth Concept
Free with trial A 3D rendered icon depicting a blue document with a raised bar graph. The bar graph features alternating blue, orange, and yellow bars of varying heights. White lines and a circular orange and white element are also present on the blue document surface. The icon is isolated on a white background. Analysis decrease vectors 3 D blue document icon with orange and blue bar graph and white lines image. A 3D rendered icon depicting a blue document with a raised bar graph. The bar graph features alternating blue, orange, and yellow bars of varying heights. White lines and a circular orange and white element are also present on the blue document surface. The icon is isolated on a white background
Free with trial A clean, white three-dimensional percentage symbol stands prominently against a pure white background. The symbol is rendered with smooth surfaces and clear edges, casting a subtle shadow beneath it. The design is simple and iconic, representing concepts of proportion or discount. Analysis decrease illustrations White 3D Percentage Symbol on White Background sign number. A clean, white three-dimensional percentage symbol stands prominently against a pure white background. The symbol is rendered with smooth surfaces and clear edges, casting a subtle shadow beneath it. The design is simple and iconic, representing concepts of proportion or discount
Free with trial A 3D rendered red bar chart and line graph show a downward trend against a white grid background. The graph reflects a decline with a red arrow pointing down. Analysis decrease illustrations Red downward trending bar chart and line graph on white grid image. A 3D rendered red bar chart and line graph show a downward trend against a white grid background. The graph reflects a decline with a red arrow pointing down
Free with trial A dramatic visual representation of a stock market crash, featuring a downward trending red candlestick chart against a dark, grid-like background. Numbers and financial data are subtly visible, emphasizing the financial context. This image evokes feelings of loss, recession, and economic downturn, making it ideal for illustrating financial crises, market volatility, and investment risks. Analysis decrease illustrations Red Stock Market Crash Chart. A dramatic visual representation of a stock market crash, featuring a downward trending red candlestick chart against a dark, grid-like background. Numbers and financial data are subtly visible, emphasizing the financial context. This image evokes feelings of loss, recession, and economic downturn, making it ideal for illustrating financial crises, market volatility, and investment risks.
Free with trial Bad stock market chart and sad bear. Analysis decrease illustrations Bad stock market chart and sad bear
Free with trial Blue bar chart with a black arrow bouncing backward vector illustration. Economic recession, financial loss, market crash, business failure, negative growth, setback. Data graph with falling pointer. Analysis decrease vectors Financial bar chart with a bouncing arrow pointing down economic recession and market loss vector illustration. Blue bar chart with a black arrow bouncing. Blue bar chart with a black arrow bouncing backward vector illustration. Economic recession, financial loss, market crash, business failure, negative growth, setback. Data graph with falling pointer
Free with trial A person in a suit holding a magnifying glass showing blue upward and red downward percentage arrows. Analysis decrease illustrations Person holding magnifying glass with percentage arrows hand blue. A person in a suit holding a magnifying glass showing blue upward and red downward percentage arrows.
Free with trial A bar chart displays four vertical bars in red, yellow, green, and blue, arranged in descending height from left to right. A thick, black arrow curves downwards from the top right, pointing towards the bars and indicating a downward trend or decline. The chart is presented on a plain white background. Analysis decrease illustrations Downward Trending Bar Chart with Red Yellow Green Blue Bars and Black Arrow graph statistics. A bar chart displays four vertical bars in red, yellow, green, and blue, arranged in descending height from left to right. A thick, black arrow curves downwards from the top right, pointing towards the bars and indicating a downward trend or decline. The chart is presented on a plain white background
Free with trial Futuristic Collaboration Between Human and Robot in Real Estate Market with House Icon and Declining Graph Indicators Sigmoid. Analysis decrease illustrations A unique representation of human and robotic interaction in the real estate sector, showcasing a house icon with. Futuristic Collaboration Between Human and Robot in Real Estate Market with House Icon and Declining Graph Indicators Sigmoid
Free with trial A conceptual vector illustration depicting a severe economic downturn. The image features a grey bar chart with progressively shorter bars, symbolizing declining profits or performance. A bold red arrow points sharply downwards, representing a crash or significant loss, alongside a blue line graph also showing a negative trend. This graphic is ideal for illustrating concepts such as financial crisis, recession, stock market crash, business failure, bankruptcy, and negative growth. Perfect for financial reports, business presentations, news articles, and economic analysis infographics. Analysis decrease illustrations Economic Downturn and Financial Crisis Graph. A conceptual vector illustration depicting a severe economic downturn. The image features a grey bar chart with progressively shorter bars, symbolizing declining profits or performance. A bold red arrow points sharply downwards, representing a crash or significant loss, alongside a blue line graph also showing a negative trend. This graphic is ideal for illustrating concepts such as financial crisis, recession, stock market crash, business failure, bankruptcy, and negative growth. Perfect for financial reports, business presentations, news articles, and economic analysis infographics.
Free with trial This image depicts a bar graph on an easel showing a clear downward trend. The bars are blue, and a large red arrow points downward, indicating a decline. Analysis decrease illustrations Decline in data represented by a descending bar graph on an easel. This image depicts a bar graph on an easel showing a clear downward trend. The bars are blue, and a large red arrow points downward, indicating a decline
Free with trial White Global economic crisis icon isolated with long shadow background. World finance crisis. Pink hexagon button. Vector. Analysis decrease illustrations White Global economic crisis icon isolated with long shadow background. World finance crisis. Pink hexagon button
Free with trial A seamless pattern of shiny golden percentage (%) symbols arranged in a grid on a light, gradient background. The 3D rendered symbols have a metallic sheen and cast subtle shadows, creating a sense of depth and luxury. This abstract background is ideal for financial, marketing, or sale-related themes, conveying concepts of discounts, interest rates, or economic growth. Analysis decrease illustrations Golden Percentage Symbols Pattern Background. A seamless pattern of shiny golden percentage (%) symbols arranged in a grid on a light, gradient background. The 3D rendered symbols have a metallic sheen and cast subtle shadows, creating a sense of depth and luxury. This abstract background is ideal for financial, marketing, or sale-related themes, conveying concepts of discounts, interest rates, or economic growth.
Free with trial This image showcases a red piggy bank, calculator, and pen, symbolizing financial planning. The realistic scene was generated by AI, emphasizing the tools needed for effective savings and budgeting. Perfect for financial literacy resources. Analysis decrease illustrations Saving & Budgeting Tools. This image showcases a red piggy bank, calculator, and pen, symbolizing financial planning. The realistic scene was generated by AI, emphasizing the tools needed for effective savings and budgeting. Perfect for financial literacy resources.
Free with trial Sophisticated financial dollar. Professional growth indicators. Economic statistics Vector. Professional currency exchanges. EPS 10. Analysis decrease vectors Sophisticated financial dollar. Professional growth indicators. Economic statistics Vector. Professional currency exchanges
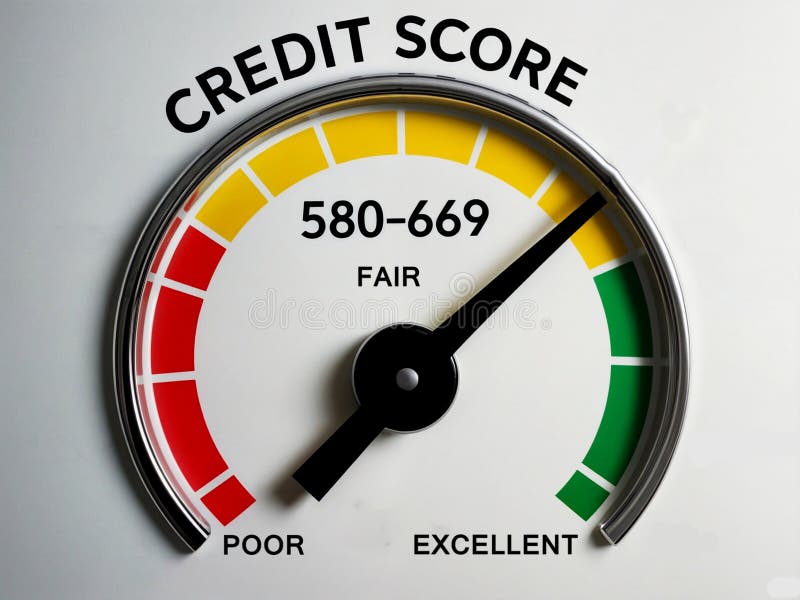
Free with trial 3d render illustration of a credit Score gauge meter within fair range 580 to 669. Analysis decrease illustrations Credit Score gauge meter within fair range 580 to 669
Free with trial Black line graph showing upward and downward trends with arrows on a white background. Analysis decrease illustrations Black line graph with upward and downward trends and arrows chart data. Black line graph showing upward and downward trends with arrows on a white background
Free with trial Bear market business vector concept. Symbol of finance, downturn, trading. Minimal design eps10 illustration. Analysis decrease vectors Bear market business vector concept. Symbol of finance, downturn, trading. Minimal illustration
Free with trial This image features an abstract illustration of a bar graph against a dark gray background. The graph consists of three vertical bars of varying heights, each with horizontal rectangles inside. The bars are shades of white and gray, creating a minimalist and modern design. This image can be used to represent data, growth, statistics, or business performance in a visually appealing manner. Analysis decrease vectors Abstract Bar Graph Illustration. This image features an abstract illustration of a bar graph against a dark gray background. The graph consists of three vertical bars of varying heights, each with horizontal rectangles inside. The bars are shades of white and gray, creating a minimalist and modern design. This image can be used to represent data, growth, statistics, or business performance in a visually appealing manner.
Free with trial A striking 3D rendering depicts a significant financial market decline, symbolized by a bold red arrow sharply pointing downwards across a dark grey background. The scene includes a subtle line graph and bar charts in shades of red and grey, illustrating a negative trend in data. This image effectively conveys concepts of economic recession, stock market crash, business losses, and financial crisis. Ideal for articles, presentations, and reports discussing market downturns, investment risks, or economic challenges. Analysis decrease illustrations Financial Market Decline with Red Arrow Chart. A striking 3D rendering depicts a significant financial market decline, symbolized by a bold red arrow sharply pointing downwards across a dark grey background. The scene includes a subtle line graph and bar charts in shades of red and grey, illustrating a negative trend in data. This image effectively conveys concepts of economic recession, stock market crash, business losses, and financial crisis. Ideal for articles, presentations, and reports discussing market downturns, investment risks, or economic challenges.
Free with trial Aesthetic pastel style diminishing line graph illustration soft gradient, design minimal, subtle smooth aesthetic pastel style diminishing line graph. Analysis decrease illustrations Aesthetic pastel style diminishing line graph
Free with trial A 3D rendering depicts a scale balancing location markers (representing market presence) and a downward-trending arrow (symbolizing market value decline). It visually represents the complex relationship between a business's geographic reach and its financial performance, highlighting how even strong. Analysis decrease illustrations Location vs. Market Value. A 3D rendering depicts a scale balancing location markers (representing market presence) and a downward-trending arrow (symbolizing market value decline). It visually represents the complex relationship between a business's geographic reach and its financial performance, highlighting how even strong
Free with trial A flat depicting two distinct financial charts against a white background. The left chart a bar graph with bars in shades of green and blue, topped by a jagged blue line graph ascending towards a green percentage symbol and an upward arrow. The right chart a bar graph with bars in yellow, orange, and red, with a red line graph descending from a yellow dollar sign. Analysis decrease illustrations Upward and downward financial charts with percentage and dollar symbols. A flat depicting two distinct financial charts against a white background. The left chart a bar graph with bars in shades of green and blue, topped by a jagged blue line graph ascending towards a green percentage symbol and an upward arrow. The right chart a bar graph with bars in yellow, orange, and red, with a red line graph descending from a yellow dollar sign
Free with trial Two distinct bar charts are depicted against a white background. The left chart a downward trend with bars in blue, yellow, and purple, accompanied by a yellow coin with a dollar sign and an arrow pointing down towards it from a small graph indicating a rising trend. The right chart an upward trend with bars in red, green, and blue, and a green coin with a dollar sign connected to a circle with a. Analysis decrease illustrations Bar charts showing financial growth and decline with dollar symbols. Two distinct bar charts are depicted against a white background. The left chart a downward trend with bars in blue, yellow, and purple, accompanied by a yellow coin with a dollar sign and an arrow pointing down towards it from a small graph indicating a rising trend. The right chart an upward trend with bars in red, green, and blue, and a green coin with a dollar sign connected to a circle with a
Free with trial A dynamic, futuristic digital display showing a falling stock market chart. This detailed financial graph features glowing red candlestick patterns and line charts indicating a significant downward trend and high volatility. The image represents concepts like an economic crisis, bear market, financial recession, investment risk, and a stock market crash. It's an ideal visual for business reports, financial news, technology articles, and presentations on global economics, trading, or fintech, conveying a sense of urgency and downturn. Analysis decrease illustrations Stock Market Crash and Financial Downturn Graph. A dynamic, futuristic digital display showing a falling stock market chart. This detailed financial graph features glowing red candlestick patterns and line charts indicating a significant downward trend and high volatility. The image represents concepts like an economic crisis, bear market, financial recession, investment risk, and a stock market crash. It's an ideal visual for business reports, financial news, technology articles, and presentations on global economics, trading, or fintech, conveying a sense of urgency and downturn.
Free with trial A 3D rendered candlestick stock market chart displays a downward trend. Green bars, indicating upward movement, are followed by red bars, signifying a decline. The chart is angled diagonally across a white background, with a subtle shadow cast beneath it, emphasizing the concept of financial loss or market downturn. Analysis decrease illustrations Downward Trending Stock Market Candlestick Chart with Red and Green Bars on a White Background. A 3D rendered candlestick stock market chart displays a downward trend. Green bars, indicating upward movement, are followed by red bars, signifying a decline. The chart is angled diagonally across a white background, with a subtle shadow cast beneath it, emphasizing the concept of financial loss or market downturn
Free with trial A 3D rendered illustration of a stock market candlestick chart is shown against a light blue background. The chart displays a mix of red and green candlesticks, indicating price fluctuations. A prominent red arrow points downwards, signifying a market decline. A white zigzag line also charts a downward trend. To the right, a red exclamation mark and a red dot serve as a warning or alert symbol. Analysis decrease illustrations 3D Rendered Stock Market Candlestick Chart with Falling Red Arrow and Exclamation Mark finance. A 3D rendered illustration of a stock market candlestick chart is shown against a light blue background. The chart displays a mix of red and green candlesticks, indicating price fluctuations. A prominent red arrow points downwards, signifying a market decline. A white zigzag line also charts a downward trend. To the right, a red exclamation mark and a red dot serve as a warning or alert symbol
Free with trial A businessman presents a tablet with glowing arrows symbolizing the interplay of quality improvement and cost reduction, showcasing concepts of business optimization and success. Qubit. Analysis decrease illustrations Businessman Holding Tablet with Neon Arrows Indicating Quality Increase and Cost Decrease, Concept of Optimizing. A businessman presents a tablet with glowing arrows symbolizing the interplay of quality improvement and cost reduction, showcasing concepts of business optimization and success. Qubit