Free with trial Visualizing cost reduction with stacked coins and a downward arrow. A concept showing financial challenges, expense management, and the importance of strategic planning for business success. Analysis decrease illustrations Cost reduction strategies and expense management tips for business to improve profitability growth. visualizing cost reduction with stacked coins and a downward arrow. A concept showing financial challenges, expense management, and the importance of strategic planning for business success.
Free with trial A collection of business-related icons illustrating various aspects of business, including target achievement, growth, decline, and organizational structure. Analysis decrease vectors Vector art of a set of business icons, , representing target achievement, growth, decline, and structure in a business or. A collection of business-related icons illustrating various aspects of business, including target achievement, growth, decline, and organizational structure
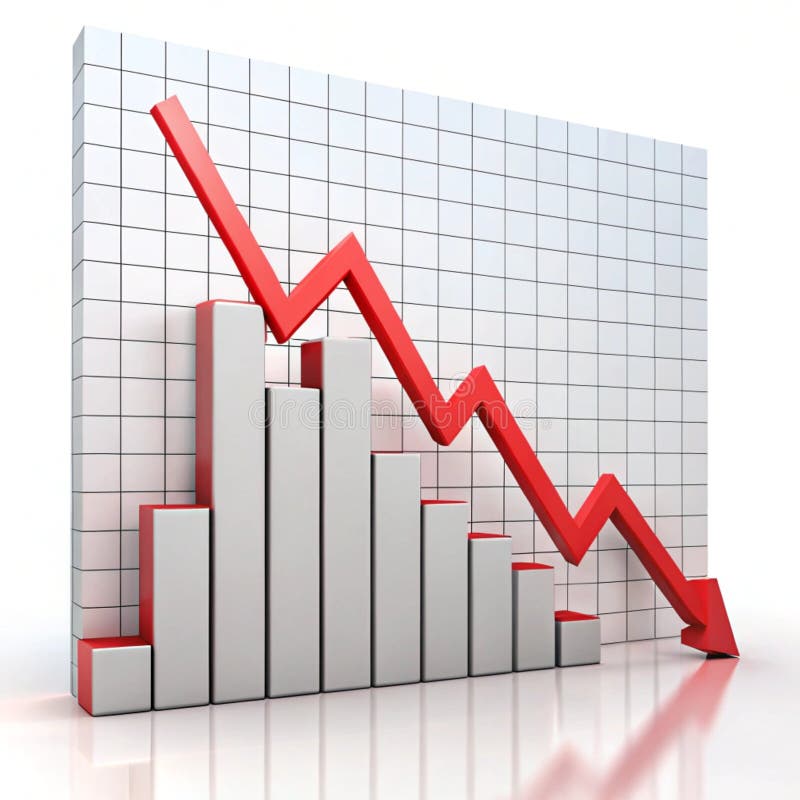
Free with trial 3D Illustration of Abstract Bar Graph finance. Analysis decrease illustrations 3D Illustration of Abstract Bar Graph
Free with trial A neon orange graph on a black background shows a sharp decline, symbolizing financial loss or a negative trend. Analysis decrease illustrations Neon orange downward trending graph with arrow indicating financial decline on a black background. A neon orange graph on a black background shows a sharp decline, symbolizing financial loss or a negative trend
Free with trial AI-generated image of a hand removing one star from a three-star rating, reflecting poor service, negative reviews, and consumer frustration. Perfect for brand reputation, online reviews, and feedback analysis. Keywords: rating, review, customer, dissatisfaction, star, feedback, negative, opinion, quality, experience, drop, product, poor, hand, score,one star review photo, customer dissatisfaction concept, service quality drop image, online rating removal visual, bad product experience photo, feedback and rating stock image, brand trust issues, AI-generated complaint photo, consumer opinion reaction, poor service concept. Analysis decrease illustrations One Star Rating Drop Showing Customer Dissatisfaction. AI-generated image of a hand removing one star from a three-star rating, reflecting poor service, negative reviews, and consumer frustration. Perfect for brand reputation, online reviews, and feedback analysis.Keywords: rating, review, customer, dissatisfaction, star, feedback, negative, opinion, quality, experience, drop, product, poor, hand, score,one star review photo, customer dissatisfaction concept, service quality drop image, online rating removal visual, bad product experience photo, feedback and rating stock image, brand trust issues, AI-generated complaint photo, consumer opinion reaction, poor service concept
Free with trial A person's open palm supports a glowing neon graph illustrating the relationship between cost and quality with upward and downward arrows. Analysis decrease illustrations Hand holding glowing cost quality graph palm open. A person's open palm supports a glowing neon graph illustrating the relationship between cost and quality with upward and downward arrows
Free with trial A 3D rendered image of a descending bar chart with teal and gray bars, each progressively lower than the previous, representing a financial or economic downturn. A bold red arrow slants downward across the bars, symbolizing decline. The graph is displayed against a dark background with white grid lines and axis labels, evoking a business or stock market concept. Isolated on a clean, dark surface. Analysis decrease illustrations 3D rendered bar chart with red arrow showing financial decline. A 3D rendered image of a descending bar chart with teal and gray bars, each progressively lower than the previous, representing a financial or economic downturn. A bold red arrow slants downward across the bars, symbolizing decline. The graph is displayed against a dark background with white grid lines and axis labels, evoking a business or stock market concept. Isolated on a clean, dark surface.
Free with trial A futuristic digital illustration depicts a world map with a dark background composed of small blue and green dots arranged in a dotted pattern to create depth and dimension, featuring a prominent downward-trending line graph at its center surrounded by a darker green line that represents declining financial data or stock market performance, creating a technological visualization of the global. Analysis decrease illustrations Digital world map with dotted pattern showing global economic downturn on dark background. A futuristic digital illustration depicts a world map with a dark background composed of small blue and green dots arranged in a dotted pattern to create depth and dimension, featuring a prominent downward-trending line graph at its center surrounded by a darker green line that represents declining financial data or stock market performance, creating a technological visualization of the global
Free with trial Bar graph with a downward arrow on a school hallway floor. Concept of declining performance, budget cuts, or failure in education and student outcomes. Analysis decrease illustrations Bar graph with a downward arrow on a school hallway floor. Concept of declining performance, budget cuts, or failure in education
Free with trial Colorful 3D Bar Chart Illustration for indicator economic review. Analysis decrease illustrations Colorful 3D Bar Chart Illustration
Free with trial Concept of real estate market fluctuations with miniature houses and rising graph lines. Vibrant tones and a grid layout convey, economic trends. Rising property values concept with red houses layout on rising red line graph on abstract blue background. 3D rendering. Analysis decrease illustrations 3D rendering of miniature red houses on a rising graph, real estate market fluctuations. Concept of real estate market fluctuations with miniature houses and rising graph lines. Vibrant tones and a grid layout convey, economic trends. Rising property values concept with red houses layout on rising red line graph on abstract blue background. 3D rendering
Free with trial Downward graph chart isolated on transparent background. Analysis decrease illustrations Downward graph chart
Free with trial Four distinct blue bar charts, each adorned with euro symbols, visually representing financial data with trends of both growth and decline, isolated on a white background. Analysis decrease vectors Four blue bar charts with euro symbols showing growth and decline, isolated on transparent background. Four distinct blue bar charts, each adorned with euro symbols, visually representing financial data with trends of both growth and decline, isolated on a white background
Free with trial This set includes 15 high-quality, vector business icons representing various aspects of finance, networking, and growth. Perfect for websites, presentations, and applications. These simple yet effective icons provide visual clarity and professionalism. Analysis decrease illustrations Business Icon Set. This set includes 15 high-quality, vector business icons representing various aspects of finance, networking, and growth. Perfect for websites, presentations, and applications. These simple yet effective icons provide visual clarity and professionalism.
Free with trial Financial chart with golden downward arrow, statistical data, numbers in focus, white background. Concept of economic decline. 3D Rendering. Analysis decrease illustrations Financial chart with downward trend and arrow on light background. 3D Rendering. Financial chart with golden downward arrow, statistical data, numbers in focus, white background. Concept of economic decline. 3D Rendering
Free with trial A graph showing global sales growth trends on a printed document with multiple colored lines. Analysis decrease illustrations Global Sales Growth Chart on Document. A graph showing global sales growth trends on a printed document with multiple colored lines
Free with trial A hand's finger pushes a bright yellow arrow downwards, directly onto a bar graph displaying a significant decrease. This image symbolizes financial decline and negative business trends. Analysis decrease illustrations Hand pushing down yellow arrow on declining business financial graph chart showing negative growth. A hand's finger pushes a bright yellow arrow downwards, directly onto a bar graph displaying a significant decrease. This image symbolizes financial decline and negative business trends
Free with trial Colorful Charts and Graphs Data Visualization Infographic. Analysis decrease illustrations Colorful Charts and Graphs Data Visualization Infographic
Free with trial Hand-drawn financial charts and graphs displayed on a transparent glass board, perfect for business presentations. Analysis decrease illustrations Glass Board with Hand-Drawn Financial Charts and Graphs. Hand-drawn financial charts and graphs displayed on a transparent glass board, perfect for business presentations
Free with trial Red zig-zag arrow pointing downwards, indicating decline or negative trend. Analysis decrease vectors Red Downward Trend Arrow Chart. Red zig-zag arrow pointing downwards, indicating decline or negative trend
Free with trial A hand interacting with a graph showing quality increasing and cost decreasing. it represents business success, improvement, and strategic financial planning. Analysis decrease illustrations Hand interacting with a quality and cost graph showing increasing quality and decreasing cost. a hand interacting with a graph showing quality increasing and cost decreasing. it represents business success, improvement, and strategic financial planning.
Free with trial A creative business and marketing illustration perfect for branding, presentations, and digital projects. Available in AI, EPS, PNG, SVG, and Figma. Analysis decrease vectors A sketchy style illustration showing a market failure. A creative business and marketing illustration perfect for branding, presentations, and digital projects. Available in AI, EPS, PNG, SVG, and Figma.
Free with trial Illustration depicting india's economy facing a downturn, with a graph showing a downward trend. This image represents a financial crisis, stock market crash, or economic recession in india. 200. Analysis decrease illustrations India economy crisis financial market stock market crash recession economic downturn graph chart down 100. illustration depicting india's economy facing a downturn, with a graph showing a downward trend. This image represents a financial crisis, stock market crash, or economic recession in india. 200
Free with trial An upset stickman faces a decreasing profits presented on a whiteboard with a colleague giving explanations isolated on a white background perfect for business concepts, financial analysis and. Analysis decrease illustrations Upset Stickman Faces Decreasing Profits on a Whiteboard Presentation with Colleague Giving Explanations in a Black and White. An upset stickman faces a decreasing profits presented on a whiteboard with a colleague giving explanations isolated on a white background perfect for business concepts, financial analysis and
Free with trial A chart with a red arrow pointing downward, isolated on a white background, representing financial decline or a negative trend. Analysis decrease illustrations Decreasing chart with red arrow isolated on white background. A chart with a red arrow pointing downward, isolated on a white background, representing financial decline or a negative trend
Free with trial Illuminated descending bar graph against a gradient blue background suggesting decline. Generative AI. Analysis decrease illustrations Illuminated descending bar graph against a gradient blue background suggesting decline
Free with trial Black zigzag arrow icon pointing downward, indicating a negative trend or decline. Analysis decrease vectors Falling down arrow graph symbol. Black zigzag arrow icon pointing downward, indicating a negative trend or decline
Free with trial A clean and minimalist black percentage symbol (%) enclosed within a bold black circle, set against a pristine white background. This vector graphic is ideal for conveying concepts of discounts, sales, interest rates, statistics, or any proportional value. Its simple, high-contrast design ensures versatility for web icons, mobile apps, marketing materials, financial reports, and educational content, offering clear communication in various digital and print applications. Analysis decrease vectors Black Percentage Symbol in Circle Icon. A clean and minimalist black percentage symbol (%) enclosed within a bold black circle, set against a pristine white background. This vector graphic is ideal for conveying concepts of discounts, sales, interest rates, statistics, or any proportional value. Its simple, high-contrast design ensures versatility for web icons, mobile apps, marketing materials, financial reports, and educational content, offering clear communication in various digital and print applications.
Free with trial A stylized blue price tag is depicted against a clean white background. The tag features a dark outline and a rounded bottom edge. Prominently displayed on its surface are two contrasting arrows: a vibrant green arrow pointing upwards and an orange arrow pointing downwards. These arrows symbolize concepts like exchange, trade, price fluctuations, or the movement of goods. The image is simple, graphic, and easily understandable, making it suitable for various commercial and informational applications. Analysis decrease illustrations Blue Price Tag with Up and Down Arrows. A stylized blue price tag is depicted against a clean white background. The tag features a dark outline and a rounded bottom edge. Prominently displayed on its surface are two contrasting arrows: a vibrant green arrow pointing upwards and an orange arrow pointing downwards. These arrows symbolize concepts like exchange, trade, price fluctuations, or the movement of goods. The image is simple, graphic, and easily understandable, making it suitable for various commercial and informational applications.
Free with trial A red line on a chart with a downward trend, indicating a decline or loss in the stock market. Generative AI. Analysis decrease illustrations Red Downward Trend. A red line on a chart with a downward trend, indicating a decline or loss in the stock market. Generative AI
Free with trial Process reduction icon vector sign illustration. Analysis decrease vectors Process reduction icon vector
Free with trial Computer with Candlestick Chart vector Crypto Investment concept icon or design element. Analysis decrease vectors Computer with Candlestick Chart vector Crypto Investment icon or design element
Free with trial Flat vector illustration of a chart depicting a negative trend, accompanied by a sad face icon, suggesting business decline or failure. Analysis decrease vectors A chart showing a negative trend with a sad face icon, indicating a decline in business. Flat vector illustration of a chart depicting a negative trend, accompanied by a sad face icon, suggesting business decline or failure.
Free with trial A bar chart shows a decline, coupled with a sad face, conveying negative trends in a flat design style. Analysis decrease vectors Declining bar chart with a sad face symbolizing loss, downturn, or negative trends. A bar chart shows a decline, coupled with a sad face, conveying negative trends in a flat design style.
Free with trial A minimalist, flat design illustration of a bar chart featuring three vertical bars of varying heights. The bars are colored teal, orange, and beige, with dark blue outlines. They stand on a light yellow base and are arranged from tallest to shortest, indicating a declining trend. This graphic is ideal for representing data, statistics, financial reports, or progress over time in a clean and modern visual style. Analysis decrease illustrations Colorful Bar Chart with Declining Trend. A minimalist, flat design illustration of a bar chart featuring three vertical bars of varying heights. The bars are colored teal, orange, and beige, with dark blue outlines. They stand on a light yellow base and are arranged from tallest to shortest, indicating a declining trend. This graphic is ideal for representing data, statistics, financial reports, or progress over time in a clean and modern visual style.
Free with trial An illustrative icon representing the exchange of digital information. Analysis decrease vectors Digital Dialogue and Data Download Icon. An illustrative icon representing the exchange of digital information
Free with trial This image depicts a bar graph with a downward trend, represented by red bars decreasing in height from left to right. A large red arrow at the end of the graph further emphasizes the downward direction, indicating a significant decline in the measured values. Analysis decrease illustrations Decreasing trend indicated by red arrow. This image depicts a bar graph with a downward trend, represented by red bars decreasing in height from left to right. A large red arrow at the end of the graph further emphasizes the downward direction, indicating a significant decline in the measured values
Free with trial Digital screen displays vibrant red downward trend line graph. Finance chart signals significant earning loss, economic crisis. Business performance decreased. Stock market faces. Analysis decrease illustrations Digital screen displays vibrant red downward trend line graph. Finance chart signals significant earning loss, economic crisis.
Free with trial A red arrow shaped like a declining graph illustrates a downward trend. This image can be used to represent financial loss, market crashes, or negative performance in business and economics. Analysis decrease illustrations Downward Trend Graph Red Arrow Decline. A red arrow shaped like a declining graph illustrates a downward trend. This image can be used to represent financial loss, market crashes, or negative performance in business and economics
Free with trial Red arrow pointing down graph shows market crash red arrow economics red AI-generated for unique and creative designs. Analysis decrease illustrations Red arrow pointing down, graph shows market crash , red arrow, economics, red. Red arrow pointing down graph shows market crash red arrow economics red AI-generated for unique and creative designs
Free with trial Bar graph growth and decline icon in flat style. Up and down arrow chart symbol illustration. Analysis decrease vectors Bar graph growth and decline icon in flat style. Up and down arrow chart symbol
Free with trial Orange bars on white platform show sharp downward trend with arrow pointing down. Represents economic decline, business failure, financial crisis. Conceptual graphic for market. Analysis decrease illustrations Orange bars on white platform show sharp downward trend with arrow pointing down. Represents economic decline, business failure
Free with trial A line art icon depicting dollar and yen exchange rate under a magnifying glass inside a security shield. Analysis decrease illustrations Dollar Yen Exchange Rate Security Shield. A line art icon depicting dollar and yen exchange rate under a magnifying glass inside a security shield.
Free with trial A digital representation illustrates the decline in Bitcoin value, depicted by a falling graph alongside the iconic Bitcoin symbol. The background glows in a vibrant green. Analysis decrease illustrations Bitcoin value decreases significantly as market trends show downward trajectory. A digital representation illustrates the decline in Bitcoin value, depicted by a falling graph alongside the iconic Bitcoin symbol. The background glows in a vibrant green
Free with trial Simple 3D bar graph with colored bars on a white background, representing data comparison. Analysis decrease illustrations Colorful Bar Graph Illustration on White. Simple 3D bar graph with colored bars on a white background, representing data comparison
Free with trial Confident businesswoman concept. Corporate executive holding a large arrow pointing down. Market decline, performance review, direction change. Vector illustration. Analysis decrease vectors Businesswoman. Flat Vector Illustration. Confident businesswoman concept. Corporate executive holding a large arrow pointing down. Market decline, performance review, direction change. Vector illustration.
Free with trial Hand holding holographic financial graph. Analysis decrease illustrations Hand Holding Evolving Green Financial Data Graph and Cityscape - Investment Growth Concept. Hand holding holographic financial graph
Free with trial Cost reduction strategy cut budget cost reduction strategy showing. Generative AI. Analysis decrease illustrations Cost reduction strategy cut budget cost reduction strategy showing
Free with trial Near a graph that symbolizes the rising and falling trends in logistics, a female courier is illustrated, and her. Analysis decrease illustrations Near a graph that symbolizes the rising and falling trends in logistics, a female courier is illustrated, and her
Free with trial A stylized stock market chart showing a downward trend with blue and orange bars on white. Generative AI. Analysis decrease illustrations A stylized stock market chart showing a downward trend with blue and orange bars on white
Free with trial A red candlestick chart digital market crash glitchy financial stock graph downward trend loss dramatic. Analysis decrease illustrations Red candlestick chart digital market crash glitchy financial stock graph downward trend loss dramatic
Free with trial A simple line graph showing a downward trend. The graph features a single black line that starts high on the left and ends low on the right, with a jagged pattern in between. The line ends with a large arrow pointing downwards, emphasizing the decline. The graph is set against a white background with a black border, making it a clear and concise visual representation of a decreasing trend. Analysis decrease vectors Downward Trend Graph. A simple line graph showing a downward trend. The graph features a single black line that starts high on the left and ends low on the right, with a jagged pattern in between. The line ends with a large arrow pointing downwards, emphasizing the decline. The graph is set against a white background with a black border, making it a clear and concise visual representation of a decreasing trend.
Free with trial A vivid red-themed digital display highlights a sharp decline in market performance, with 3d bar visuals emphasizing decreasing trends and financial volatility. Analysis decrease illustrations Close-up view of a red downward-trending stock market graph with 3d bar charts showing declining values, on a digital financial. A vivid red-themed digital display highlights a sharp decline in market performance, with 3d bar visuals emphasizing decreasing trends and financial volatility
Free with trial A simple line graph showing a downward trend. The graph features a single black line that starts high on the left and descends to the right, ending in a downward-pointing arrow. The background is white, providing a clean and neutral contrast to the black line. Analysis decrease vectors Downward Trend Graph. A simple line graph showing a downward trend. The graph features a single black line that starts high on the left and descends to the right, ending in a downward-pointing arrow. The background is white, providing a clean and neutral contrast to the black line.
Free with trial Red declining stock market graph over a world map on a white background. Concept of global financial crisis. 3D Rendering. Analysis decrease illustrations Red declining stock market graph on white background. 3D Rendering. Red declining stock market graph over a world map on a white background. Concept of global financial crisis. 3D Rendering
Free with trial Conceptual illustration representing cryptocurrency market trends with a bar graph showing financial growth alongside shadows of investment risk and volatility. Analysis decrease vectors Stylized illustration showing cryptocurrency growth with bar graphs and shadows representing investment risks and market trends. conceptual illustration representing cryptocurrency market trends with a bar graph showing financial growth alongside shadows of investment risk and volatility
Free with trial Oil pump jack under stormy sky with downward red financial chart, symbolizing declining oil prices, energy crisis, and unstable market conditions. Generative AI. Analysis decrease illustrations Oil Pump Jack with Falling Price Graph Storm. Oil pump jack under stormy sky with downward red financial chart, symbolizing declining oil prices, energy crisis, and unstable market conditions. Generative AI
Free with trial A visual representation of the indian economy facing a crisis, showing a downward trend on a graph against the backdrop of india's map, symbolizing financial recession and market decline. Analysis decrease illustrations India economy crisis financial recession india map chart graph business market investment stock market down trend. a visual representation of the indian economy facing a crisis, showing a downward trend on a graph against the backdrop of india's map, symbolizing financial recession and market decline.
Free with trial A visual representation of financial decline. Stacks of coins are juxtaposed with a red line graph depicting a downward trend, overlaid on a world map. The image conveys economic instability and market volatility. Analysis decrease illustrations Financial Downturn: Stacks of Coins with Red Line Graph Overlay, Global Economy. A visual representation of financial decline. Stacks of coins are juxtaposed with a red line graph depicting a downward trend, overlaid on a world map. The image conveys economic instability and market volatility
Free with trial A pink percentage symbol standing on a flat surface, simple and clear illustration. Analysis decrease illustrations Pink percentage symbol on a flat surface. A pink percentage symbol standing on a flat surface, simple and clear illustration
Free with trial Visualize financial downturns and market instability with this striking graph. Perfect for presentations on economic challenges, business losses, or strategic planning. Analysis decrease vectors Business decline represented by a downward trending graph and arrow. Visualize financial downturns and market instability with this striking graph. Perfect for presentations on economic challenges, business losses, or strategic planning
Free with trial Cost reduction strategy cut budget cost reduction improves. Generative AI. Analysis decrease illustrations Cost reduction strategy cut budget cost reduction improves
Free with trial Financial Decline Concept with Green Calculator and Downward Arrow Sign. Analysis decrease illustrations Financial Decline Concept with Green Calculator and Downward Arrow Sign
Free with trial A 3D percent sign on a flat surface with a light shining on it. Analysis decrease illustrations Three dimensional percent sign on surface. A 3D percent sign on a flat surface with a light shining on it
Free with trial An illustration depicting a downward trend in milk consumption or production, represented by a series of milk bottles with decreasing fill levels, accompanied by a red arrow graph trending downwards. Analysis decrease vectors Decline in Milk Consumption or Production. An illustration depicting a downward trend in milk consumption or production, represented by a series of milk bottles with decreasing fill levels, accompanied by a red arrow graph trending downwards.
Free with trial The image features four bar graphs displaying data trends over time, with varying scales and patterns on each graph. Analysis decrease illustrations Four graphs showing data trends over time. The image features four bar graphs displaying data trends over time, with varying scales and patterns on each graph
Free with trial A female courier is depicted near a rising and falling graph, symbolizing the fluctuating trends in the logistics. Analysis decrease illustrations A female courier is depicted near a rising and falling graph, symbolizing the fluctuating trends in the logistics
Free with trial Single oil barrel casting shadow of downward financial chart, symbolizing falling oil prices, market decline, reduced demand, and economic downturn concept. Generative AI. Analysis decrease illustrations Oil Barrel Casting Falling Market Shadowgraph. Single oil barrel casting shadow of downward financial chart, symbolizing falling oil prices, market decline, reduced demand, and economic downturn concept. Generative AI
Free with trial Colorful financial data displayed on laptop, urban background, detailed background Generative AI, visually striking background Generative AI. Analysis decrease illustrations Colorful financial data displayed on laptop, urban background
Free with trial Creative collection of wooden block icons illustrating various business growth statistics with positive and negative trends, perfect for presentations and reports. Analysis decrease illustrations Colorful business growth statistics blocks. Creative collection of wooden block icons illustrating various business growth statistics with positive and negative trends, perfect for presentations and reports
Free with trial A set of vector icons illustrating business process flow and funnel diagrams. The icons depict various stages of a process, including input, output, increase, decrease, equality, and filtration. These graphics can be used to represent sales funnels, customer journeys, or any other type of process flow in a business or marketing context. Analysis decrease illustrations Business process flow funnel diagram icons. A set of vector icons illustrating business process flow and funnel diagrams. The icons depict various stages of a process, including input, output, increase, decrease, equality, and filtration. These graphics can be used to represent sales funnels, customer journeys, or any other type of process flow in a business or marketing context.
Free with trial Creative collection of wooden block icons illustrating various business growth statistics with positive and negative trends, perfect for presentations and reports. Analysis decrease illustrations Colorful business growth statistics blocks. Creative collection of wooden block icons illustrating various business growth statistics with positive and negative. Creative collection of wooden block icons illustrating various business growth statistics with positive and negative trends, perfect for presentations and reports
Free with trial Vintage red color hexagon label banner with word severity on white background. Analysis decrease vectors Vintage red hexagon label banner with word severity on white background
Free with trial Red warning sign with white downward zigzag arrow hangs inside modern office building. Symbol indicates financial crisis, market decline, economic recession investment risk. Blurred. Analysis decrease illustrations Red warning sign with white downward zigzag arrow hangs inside modern office building. Symbol indicates financial crisis, market
Free with trial A close-up view of a digital screen displaying a red stock market graph in a financial district, capturing a sense of economic downturn. The red-lit screen contrasts with the city buildings and people in the background. Analysis decrease illustrations Red Stock Market Data Displayed on Screen in City Financial District at Twilight. A close-up view of a digital screen displaying a red stock market graph in a financial district, capturing a sense of economic downturn. The red-lit screen contrasts with the city buildings and people in the background
Free with trial The image shows a computer screen displaying a stock market chart with a downward trend. The chart features a red line with arrows indicating a decline, and various percentage values are marked along the graph. Analysis decrease illustrations Stock market downtrend displayed on screen. The image shows a computer screen displaying a stock market chart with a downward trend. The chart features a red line with arrows indicating a decline, and various percentage values are marked along the graph
Free with trial Declining stock market graph on smartphone screen indicates financial loss or crisis. Analysis decrease illustrations Smartphone screen displays declining stock market graph with red arrow. Declining stock market graph on smartphone screen indicates financial loss or crisis
Free with trial Growth and decline graph report icon illustration. Financial chart arrow up and down symbol on black circle. Analysis decrease vectors Growth and decline graph report icon. Financial chart arrow up and down symbol on black circle